| Param | Original file | Final file |
|---|---|---|
| Filename | modeM0/AS1A11_082T01_9000005356_37934cztM0_level2.evt | modeM0/AS1A11_082T01_9000005356_37934cztM0_level2_quad_clean.evt |
| Size (bytes) | 862,004,160 | 130,694,400 |
| Size | 822.1 MB | 124.6 MB |
| Events in quadrant A | 6,688,051 | 823,541 |
| Events in quadrant B | 6,735,330 | 819,204 |
| Events in quadrant C | 5,339,857 | 829,482 |
| Events in quadrant D | 6,621,520 | 745,862 |
| Mode M0 | |||
|---|---|---|---|
| Quadrant | BADHDUFLAG | Total packets | Discarded packets |
| A | 0 | 26879 | 4 |
| B | 0 | 27230 | 3 |
| C | 0 | 22689 | 3 |
| D | 0 | 27234 | 3 |
| Mode SS | |||
|---|---|---|---|
| Quadrant | BADHDUFLAG | Total packets | Discarded packets |
| A | 0 | 216 | 0 |
| B | 0 | 216 | 0 |
| C | 0 | 216 | 0 |
| D | 0 | 216 | 0 |
| Mode M9 | |||
|---|---|---|---|
| Quadrant | BADHDUFLAG | Total packets | Discarded packets |
| A | 0 | 33 | 0 |
| B | 0 | 33 | 0 |
| C | 0 | 33 | 0 |
| D | 0 | 34 | 0 |
| Quadrant | Total seconds | Saturated seconds | Saturation percentage |
|---|---|---|---|
| A | 10674 | 234 | 2.192243% |
| B | 10674 | 519 | 4.862282% |
| C | 10674 | 34 | 0.318531% |
| D | 10674 | 310 | 2.904253% |
Noise dominated data is calculated using 1-second bins in cleaned event files. If a bin has >2000 counts, and if more than 50% of those come from <1% of pixels, then it is considered to be noise-dominated and hence unusable.
| Quadrant | # 1 sec bins | Bins with >0 counts | Bins with >2000 counts | High rate bins dominated by noise | Noise dominated (total time) | Noise dominated (detector-on time) | Marked lightcurve |
|---|---|---|---|---|---|---|---|
| A | 13450 | 10676 | 212 | 212 | 1.58% | 1.99% | 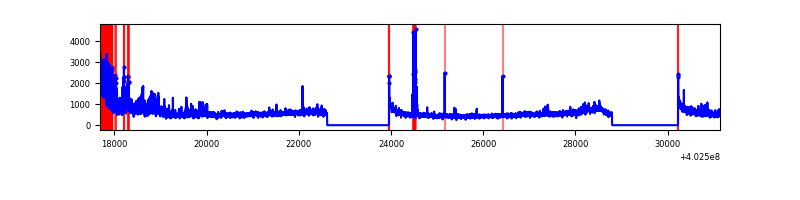 |
| B | 13450 | 10676 | 322 | 322 | 2.39% | 3.02% | 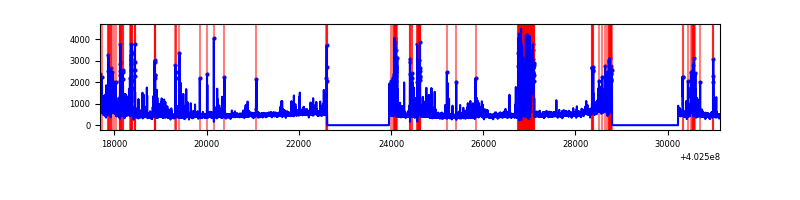 |
| C | 13450 | 10676 | 29 | 29 | 0.22% | 0.27% | 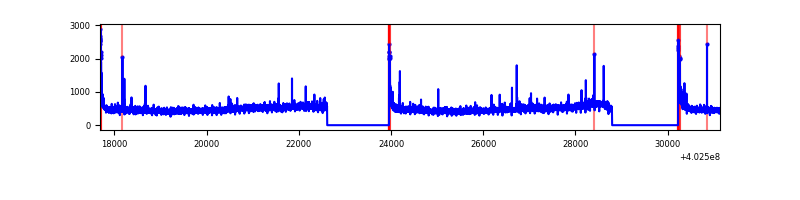 |
| D | 13450 | 10676 | 308 | 308 | 2.29% | 2.88% | 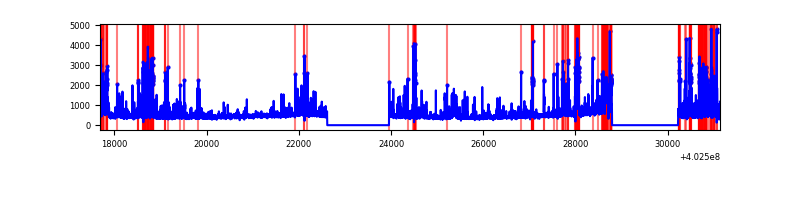 |
Top three noisy pixels from each quadrant. If the there are fewer than three noisy pixels in the level2.evt file, extra rows are filled as -1
| Pixel properties | Quadrant properties | ||||||
|---|---|---|---|---|---|---|---|
| Quadrant | DetID | PixID | Counts | Sigma | Mean | Median | Sigma |
| A | 15 | 222 | 1269404 | 5233.55 | 1196 | 1173 | 242.3 |
| A | 10 | 83 | 640069 | 2636.5 | 1196 | 1173 | 242.3 |
| A | 7 | 16 | 80969 | 329.29 | 1196 | 1173 | 242.3 |
| B | 4 | 171 | 820112 | 3660.47 | 1167 | 1136 | 223.7 |
| B | 5 | 172 | 573259 | 2557.14 | 1167 | 1136 | 223.7 |
| B | 0 | 229 | 267346 | 1189.84 | 1167 | 1136 | 223.7 |
| C | 15 | 214 | 444539 | 1636.44 | 1170 | 1180 | 270.9 |
| C | 0 | 10 | 222957 | 818.58 | 1170 | 1180 | 270.9 |
| C | 14 | 254 | 47661 | 171.56 | 1170 | 1180 | 270.9 |
| D | 2 | 249 | 486493 | 1714.31 | 1161 | 1130 | 283.1 |
| D | 1 | 52 | 472695 | 1665.57 | 1161 | 1130 | 283.1 |
| D | 12 | 227 | 332296 | 1169.68 | 1161 | 1130 | 283.1 |
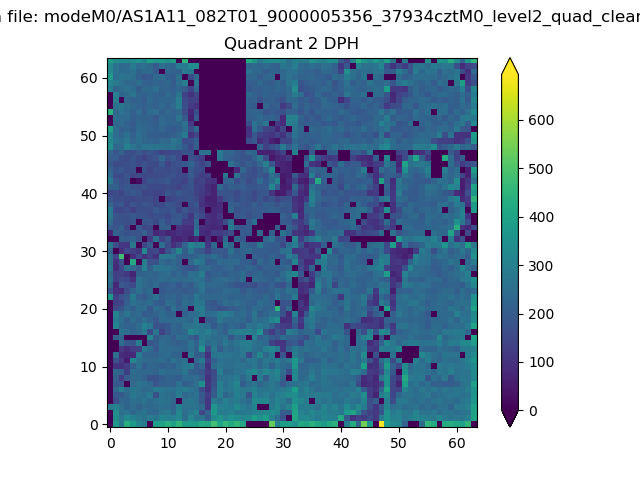
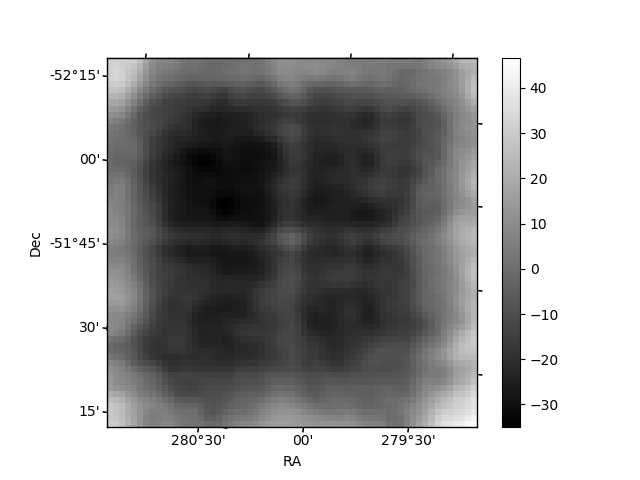
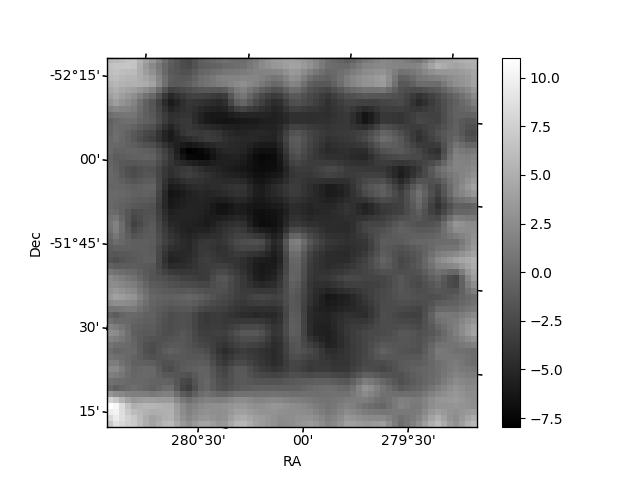
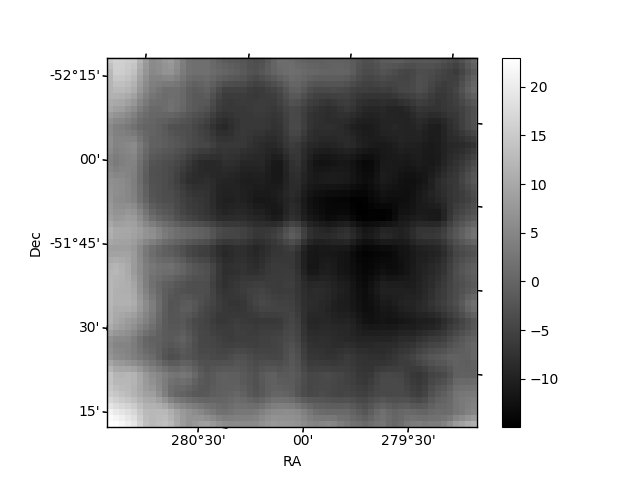
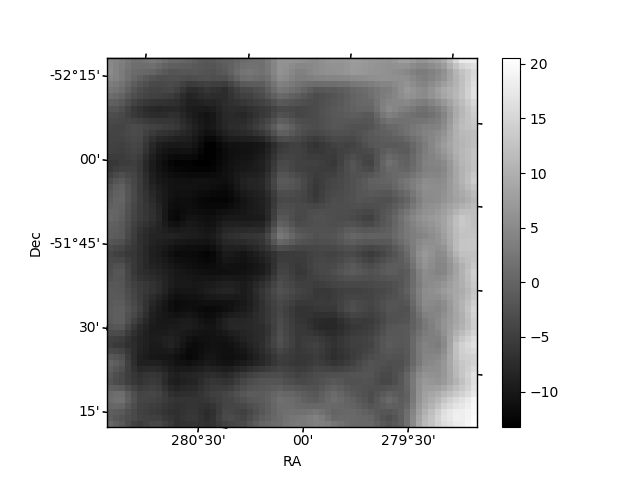
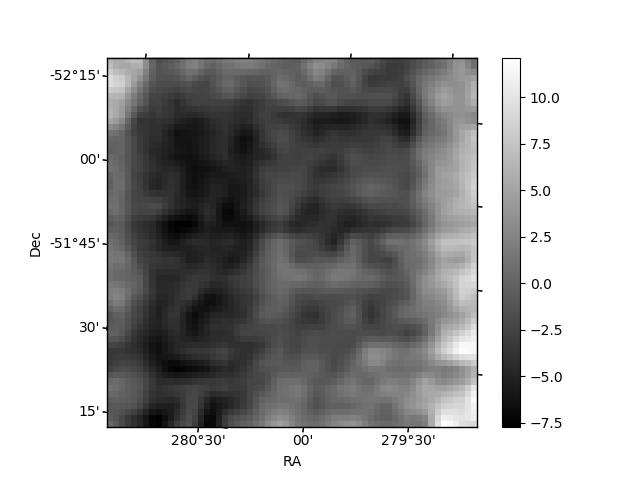
Histogram calculated using DETX and DETY for each event in the final _common_clean file
| Quadrant A | 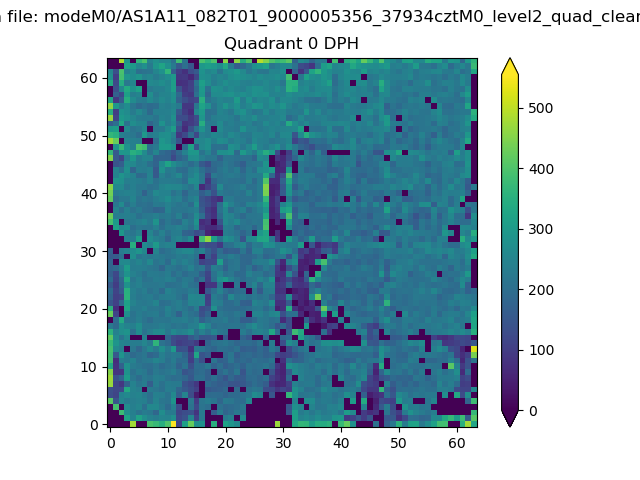 |
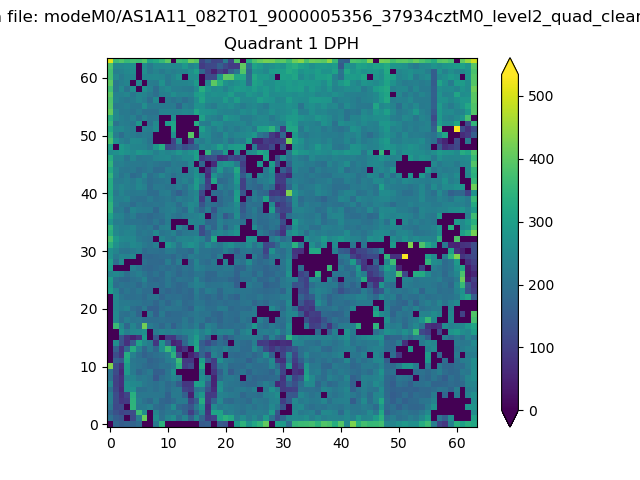 |
Quadrant B |
|---|---|---|---|
| Quadrant D | 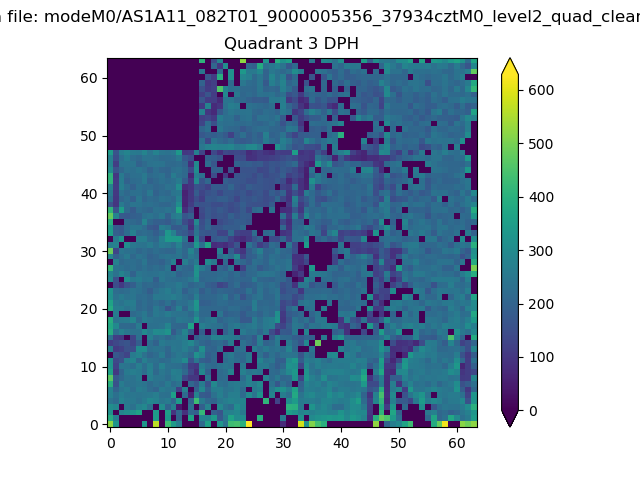 |
 |
Quadrant C |
| Plot type | Count rate plots | Images |
|---|---|---|
| Comparison with Poisson distribution Blue bars denote a histogram of data divided into 1 sec bins. Red curve is a Poisson curve with rate = median count rate of data. |
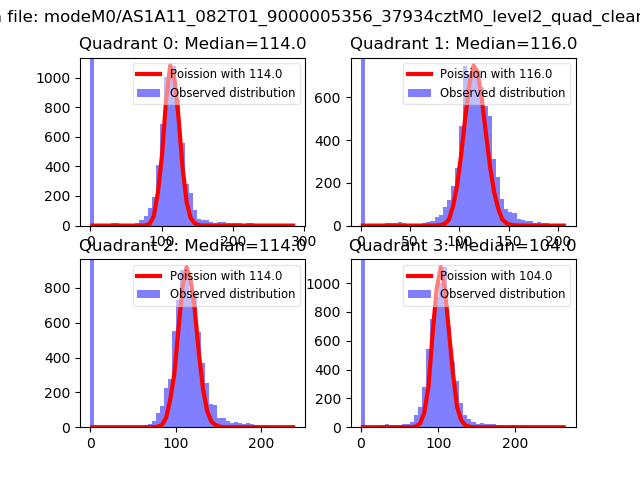 |
 |
| Quadrant-wise count rates Data is divided into 100 sec bins |
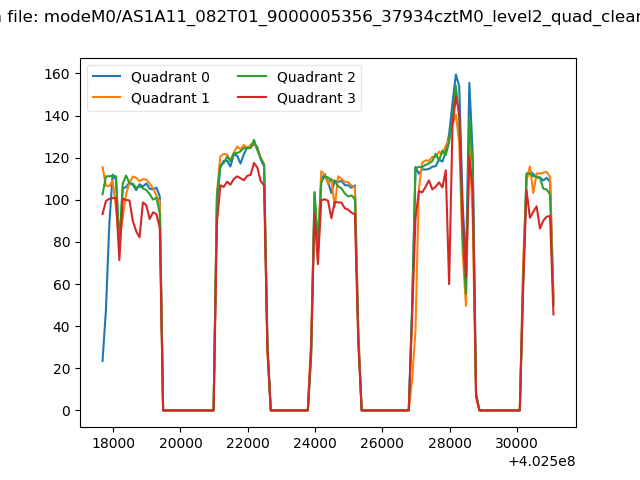 |
|
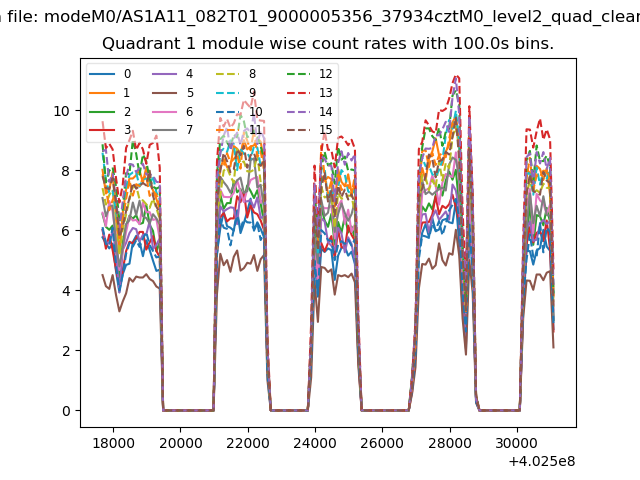
| Module-wise count rates for Quadrant A Data is divided into 100 sec bins |
 |
 |
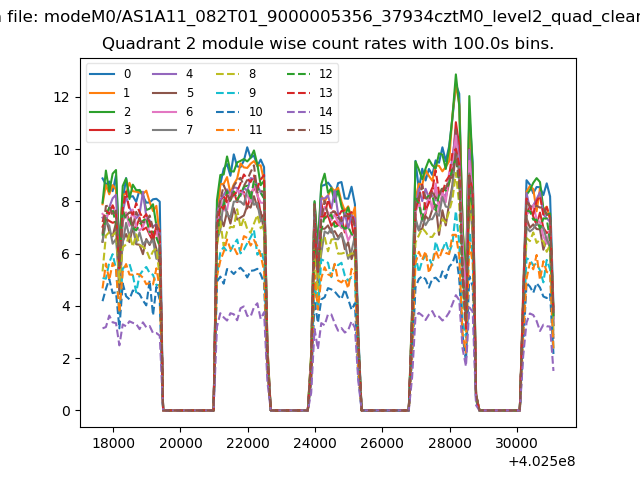
| Module-wise count rates for Quadrant B Data is divided into 100 sec bins |
 |
 |
| Module-wise count rates for Quadrant C Data is divided into 100 sec bins |
 |
 |
| Module-wise count rates for Quadrant D Data is divided into 100 sec bins |
 |
 |
| Parameter | Plot |
|---|---|
| CZT HV Monitor |  |
| D_VDD | 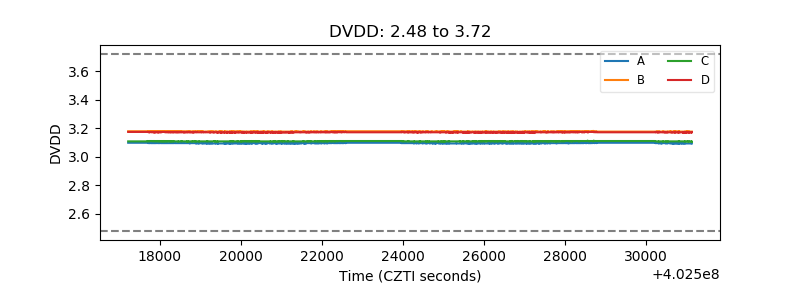 |
| Temperature 1 | 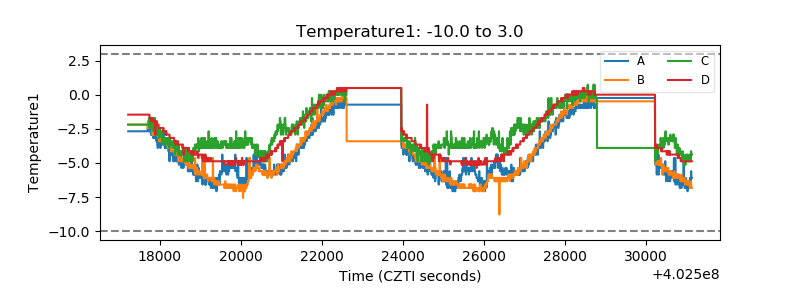 |
| Veto HV Monitor | 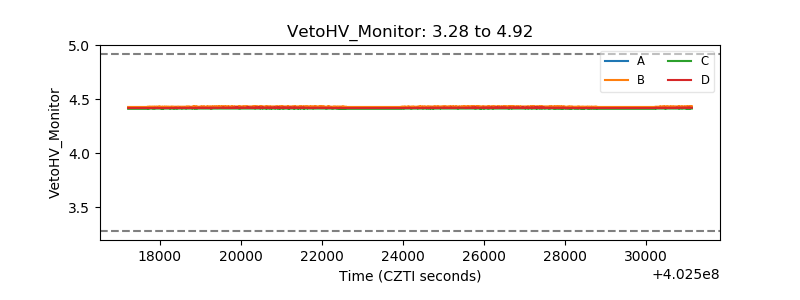 |
| Veto LLD | 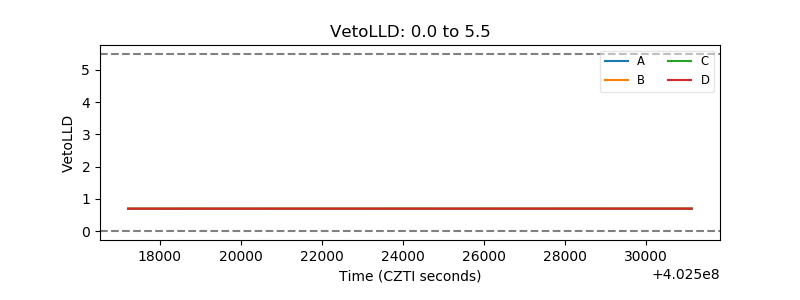 |
| Alpha Counter | 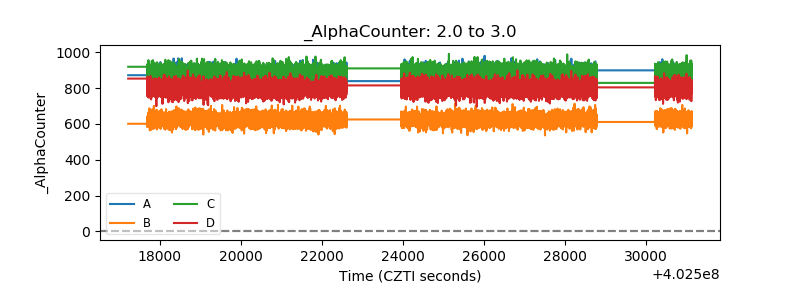 |
| _CPM_Rate | 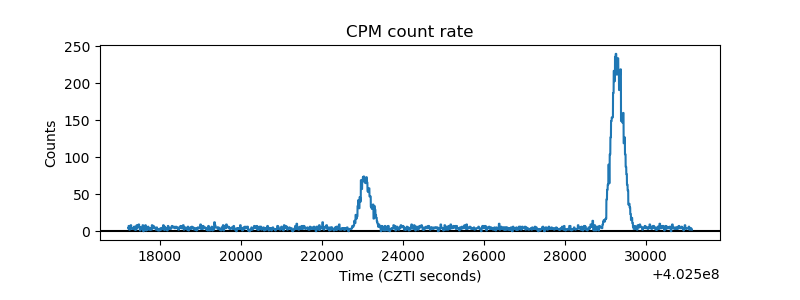 |
| CZT Counter | 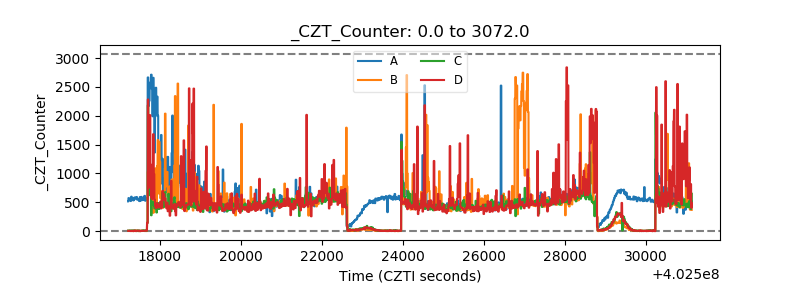 |
| +2.5 Volts monitor | 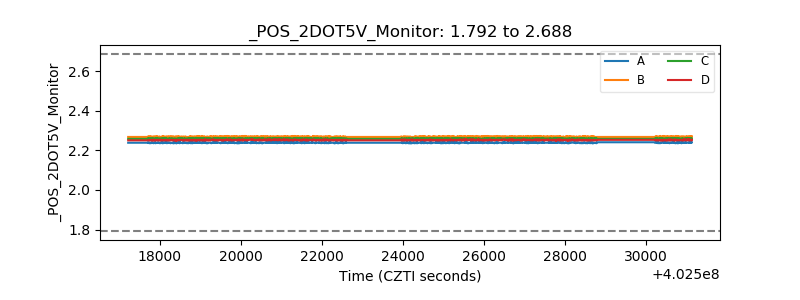 |
| +5 Volts monitor | 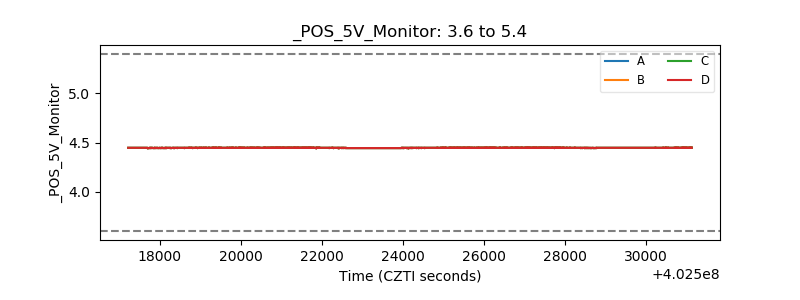 |
| _ROLL_ROT | 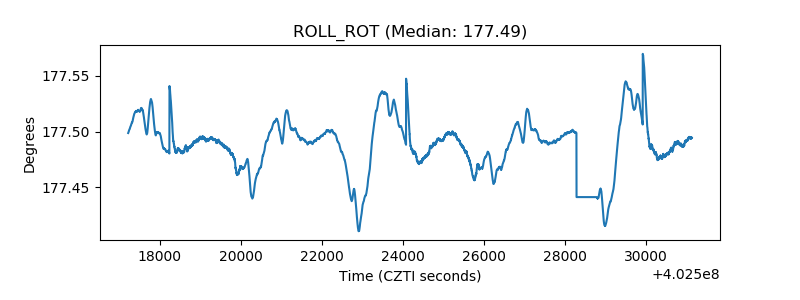 |
| _Roll_DEC | 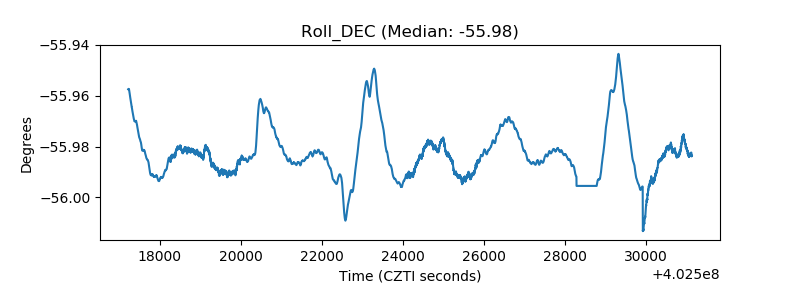 |
| _Roll_RA | 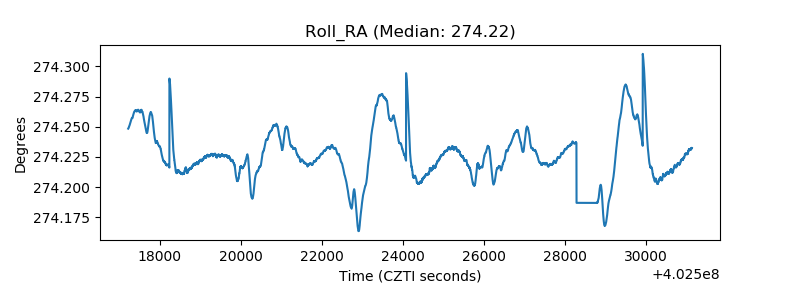 |
| Veto Counter | 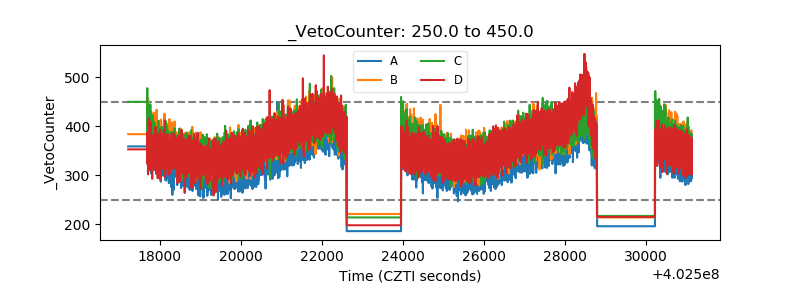 |