| Param | Original file | Final file |
|---|---|---|
| Filename | modeM0/AS1A11_082T01_9000005356_37936cztM0_level2.evt | modeM0/AS1A11_082T01_9000005356_37936cztM0_level2_quad_clean.evt |
| Size (bytes) | 823,484,160 | 117,411,840 |
| Size | 785.3 MB | 112.0 MB |
| Events in quadrant A | 6,723,997 | 736,402 |
| Events in quadrant B | 5,731,374 | 723,406 |
| Events in quadrant C | 5,275,399 | 730,855 |
| Events in quadrant D | 6,512,895 | 651,170 |
| Mode M0 | |||
|---|---|---|---|
| Quadrant | BADHDUFLAG | Total packets | Discarded packets |
| A | 0 | 27097 | 4 |
| B | 0 | 24087 | 3 |
| C | 0 | 21931 | 3 |
| D | 0 | 26817 | 3 |
| Mode SS | |||
|---|---|---|---|
| Quadrant | BADHDUFLAG | Total packets | Discarded packets |
| A | 0 | 212 | 0 |
| B | 0 | 212 | 0 |
| C | 0 | 212 | 0 |
| D | 0 | 212 | 0 |
| Mode M9 | |||
|---|---|---|---|
| Quadrant | BADHDUFLAG | Total packets | Discarded packets |
| A | 0 | 47 | 0 |
| B | 0 | 47 | 0 |
| C | 0 | 47 | 0 |
| D | 0 | 47 | 0 |
| Quadrant | Total seconds | Saturated seconds | Saturation percentage |
|---|---|---|---|
| A | 10292 | 89 | 0.864749% |
| B | 10292 | 223 | 2.166731% |
| C | 10292 | 50 | 0.485814% |
| D | 10292 | 435 | 4.226584% |
Noise dominated data is calculated using 1-second bins in cleaned event files. If a bin has >2000 counts, and if more than 50% of those come from <1% of pixels, then it is considered to be noise-dominated and hence unusable.
| Quadrant | # 1 sec bins | Bins with >0 counts | Bins with >2000 counts | High rate bins dominated by noise | Noise dominated (total time) | Noise dominated (detector-on time) | Marked lightcurve |
|---|---|---|---|---|---|---|---|
| A | 14980 | 10295 | 41 | 41 | 0.27% | 0.40% | 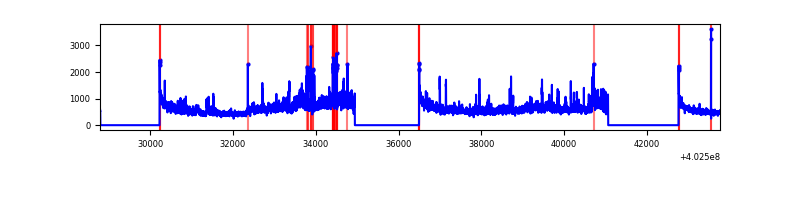 |
| B | 14980 | 10295 | 125 | 125 | 0.83% | 1.21% | 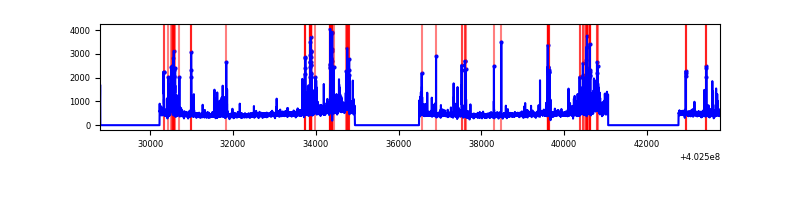 |
| C | 14980 | 10295 | 31 | 31 | 0.21% | 0.30% | 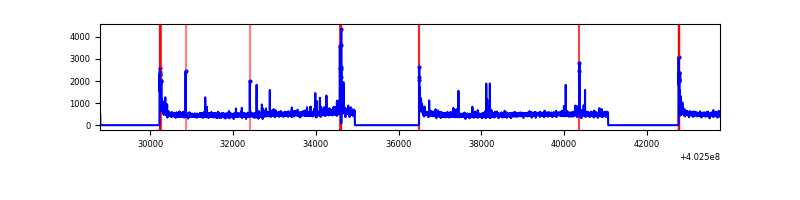 |
| D | 14980 | 10295 | 369 | 369 | 2.46% | 3.58% | 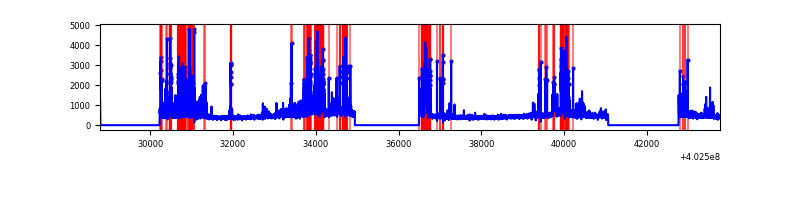 |
Top three noisy pixels from each quadrant. If the there are fewer than three noisy pixels in the level2.evt file, extra rows are filled as -1
| Pixel properties | Quadrant properties | ||||||
|---|---|---|---|---|---|---|---|
| Quadrant | DetID | PixID | Counts | Sigma | Mean | Median | Sigma |
| A | 15 | 222 | 1500359 | 6425.17 | 1162 | 1141 | 233.3 |
| A | 10 | 83 | 635511 | 2718.71 | 1162 | 1141 | 233.3 |
| A | 13 | 248 | 30232 | 124.67 | 1162 | 1141 | 233.3 |
| B | 5 | 172 | 604398 | 2797.19 | 1146 | 1117 | 215.7 |
| B | 0 | 230 | 142155 | 653.94 | 1146 | 1117 | 215.7 |
| B | 0 | 189 | 111198 | 510.4 | 1146 | 1117 | 215.7 |
| C | 15 | 214 | 429284 | 1634.46 | 1136 | 1144 | 261.9 |
| C | 0 | 10 | 232224 | 882.17 | 1136 | 1144 | 261.9 |
| C | 14 | 254 | 93191 | 351.4 | 1136 | 1144 | 261.9 |
| D | 2 | 249 | 895582 | 3300.28 | 1119 | 1087 | 271.0 |
| D | 12 | 233 | 551845 | 2032.05 | 1119 | 1087 | 271.0 |
| D | 2 | 250 | 166527 | 610.4 | 1119 | 1087 | 271.0 |
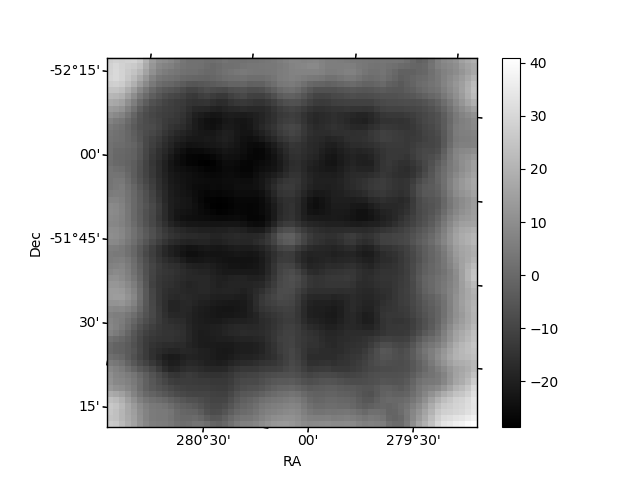
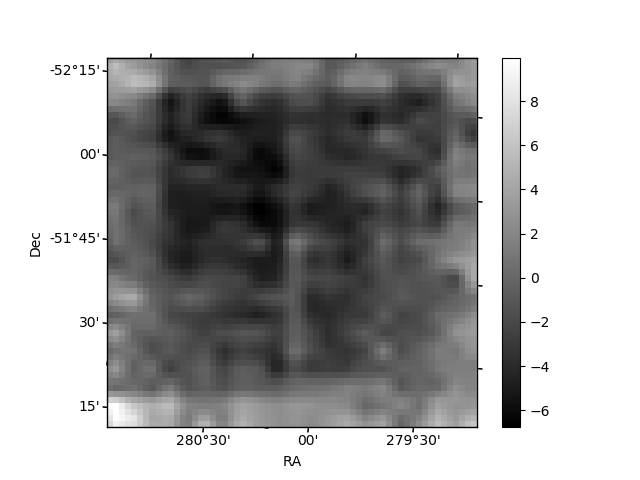
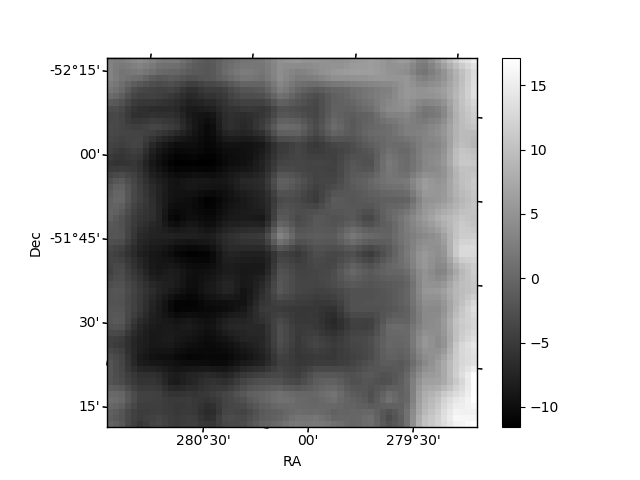
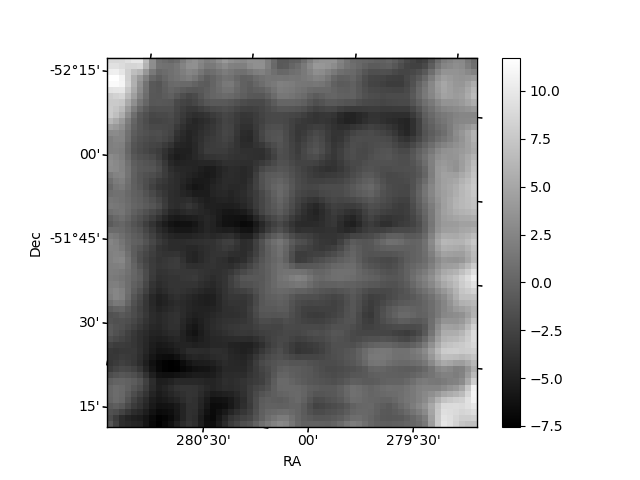
Histogram calculated using DETX and DETY for each event in the final _common_clean file
| Quadrant A | 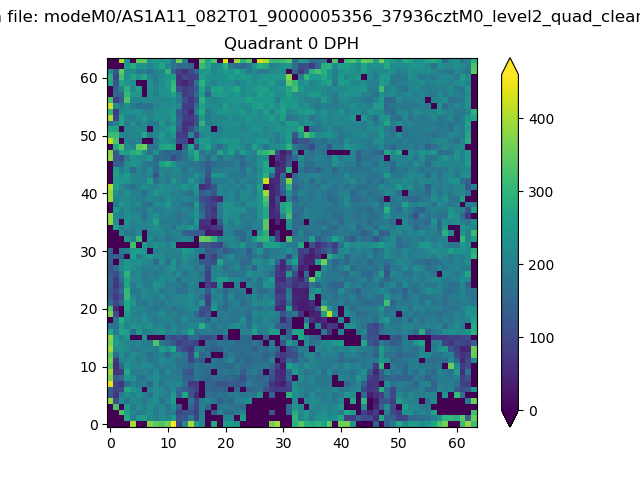 |
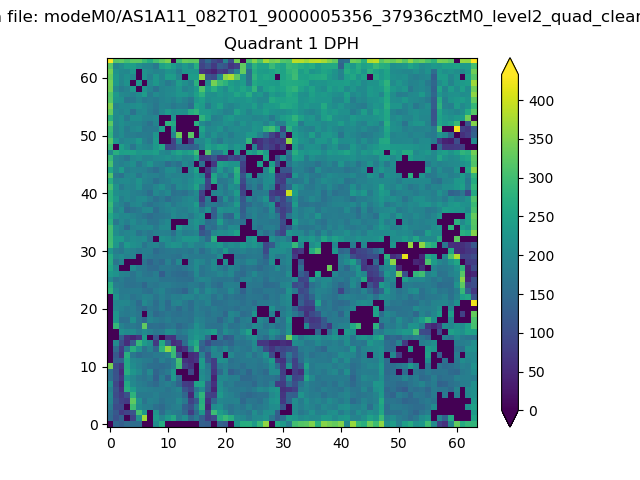 |
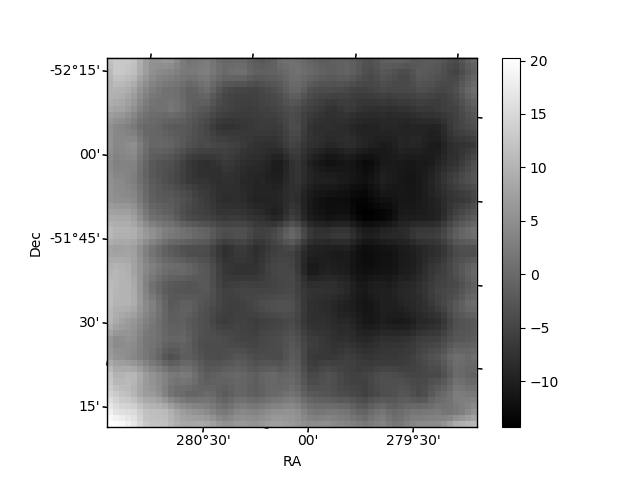
Quadrant B |
|---|---|---|---|
| Quadrant D | 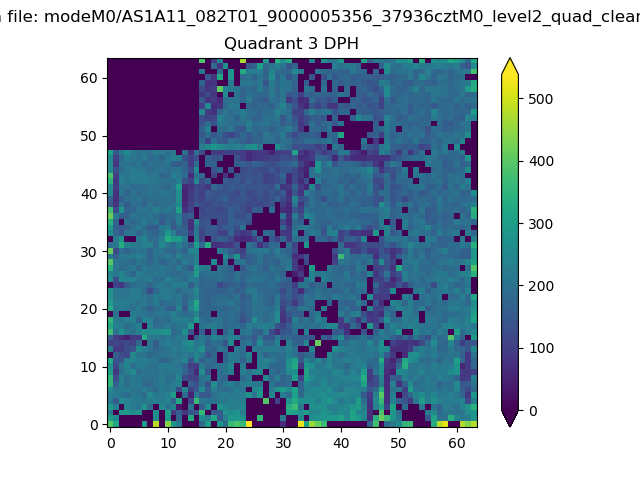 |
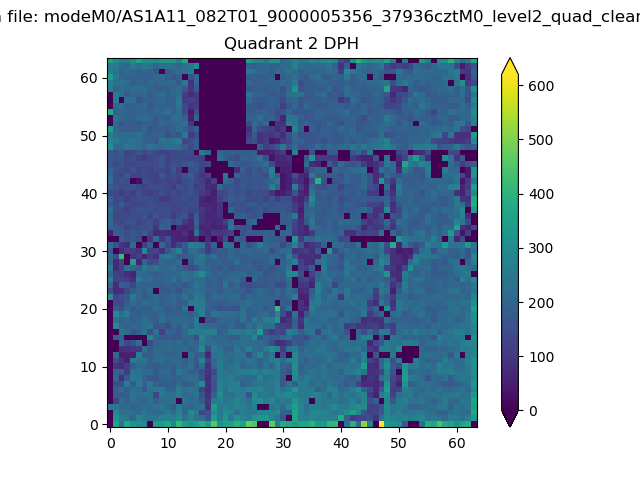 |
Quadrant C |
| Plot type | Count rate plots | Images |
|---|---|---|
| Comparison with Poisson distribution Blue bars denote a histogram of data divided into 1 sec bins. Red curve is a Poisson curve with rate = median count rate of data. |
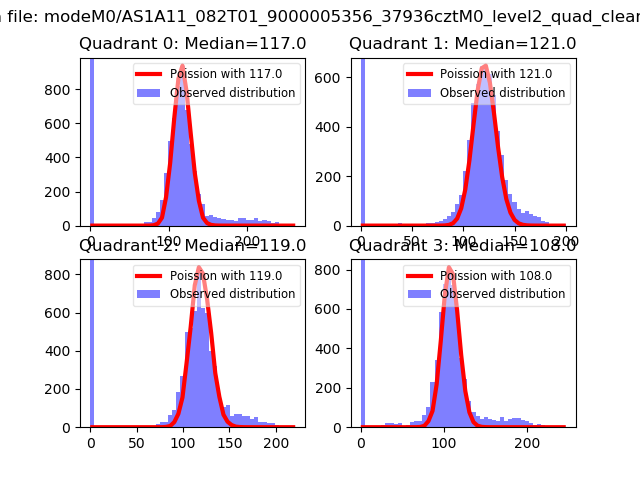 |
 |
| Quadrant-wise count rates Data is divided into 100 sec bins |
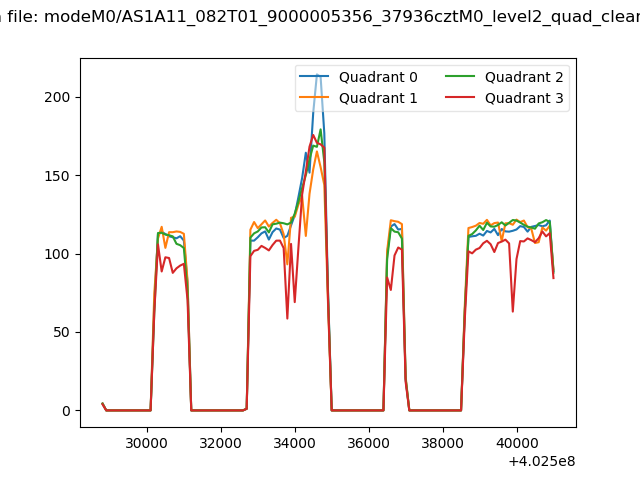 |
|
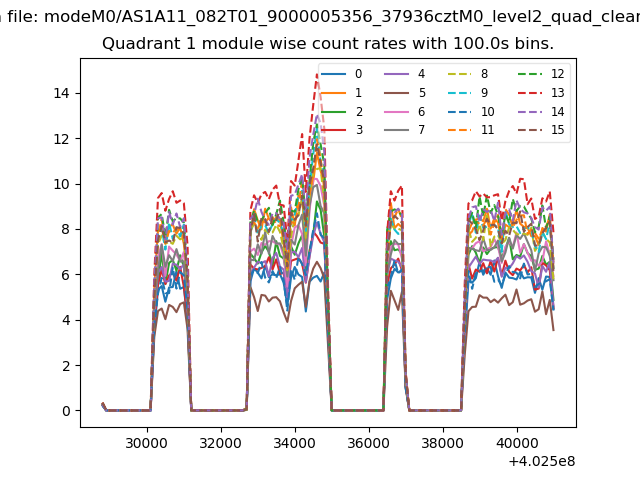
| Module-wise count rates for Quadrant A Data is divided into 100 sec bins |
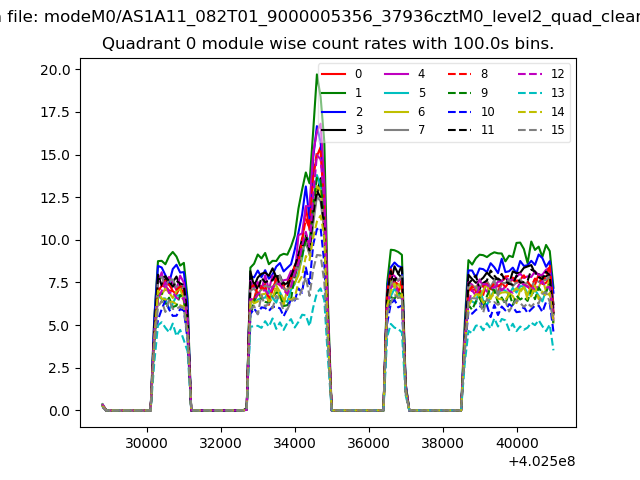 |
 |
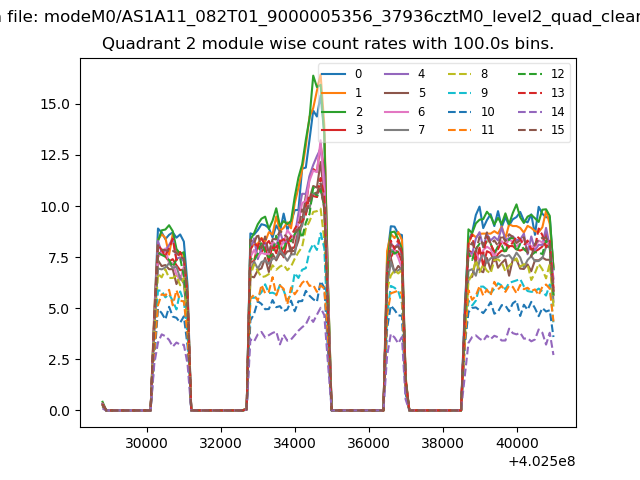
| Module-wise count rates for Quadrant B Data is divided into 100 sec bins |
 |
 |
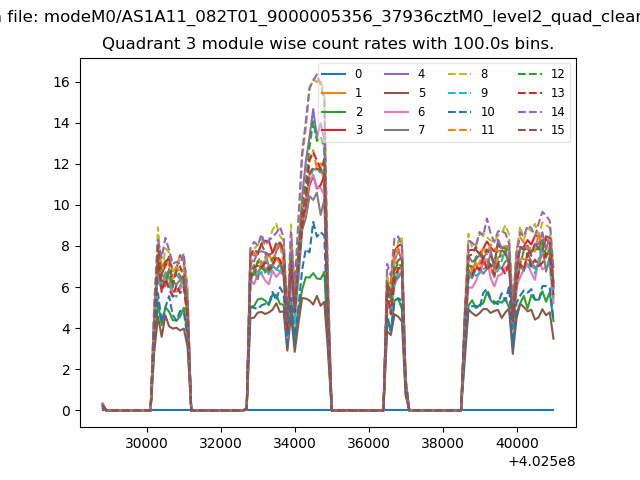
| Module-wise count rates for Quadrant C Data is divided into 100 sec bins |
 |
 |
| Module-wise count rates for Quadrant D Data is divided into 100 sec bins |
 |
 |
| Parameter | Plot |
|---|---|
| CZT HV Monitor |  |
| D_VDD | 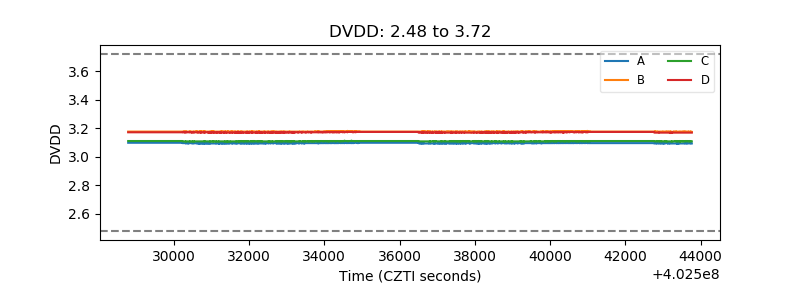 |
| Temperature 1 | 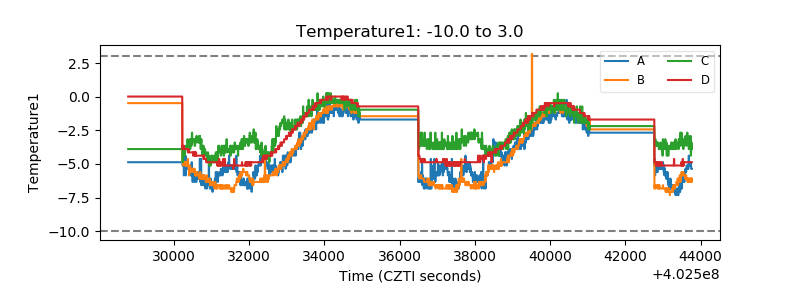 |
| Veto HV Monitor | 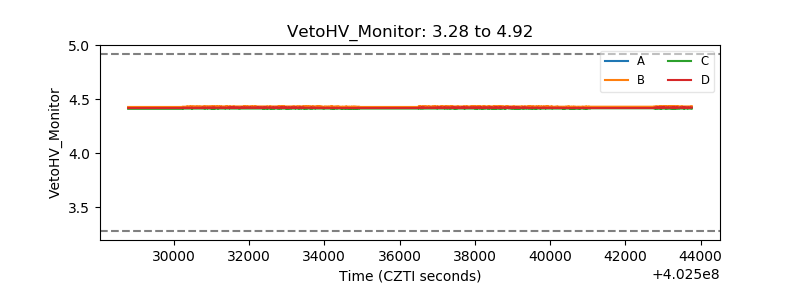 |
| Veto LLD | 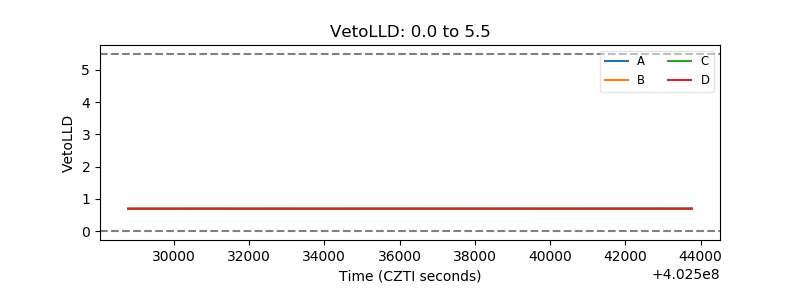 |
| Alpha Counter | 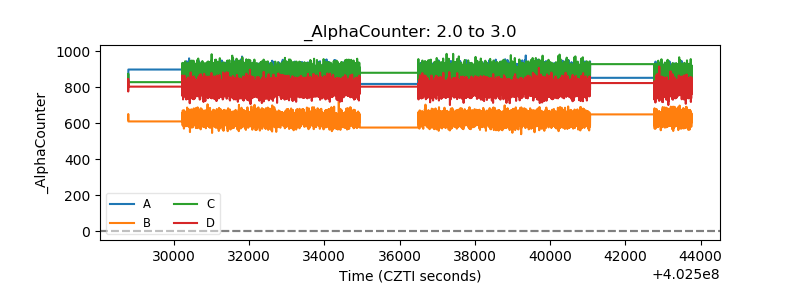 |
| _CPM_Rate | 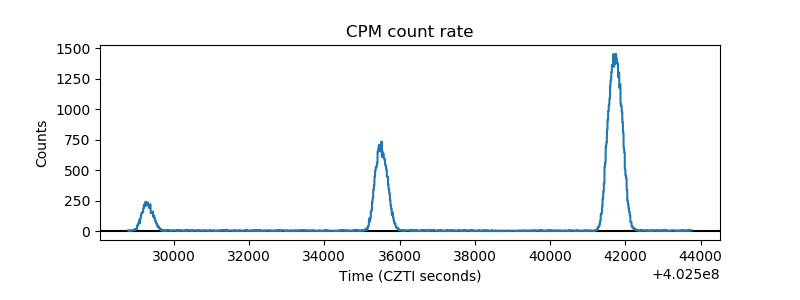 |
| CZT Counter | 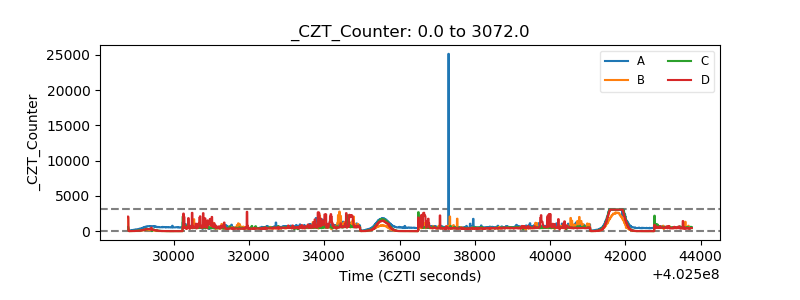 |
| +2.5 Volts monitor | 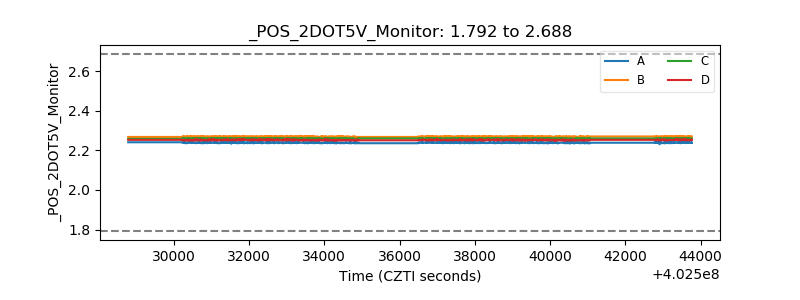 |
| +5 Volts monitor | 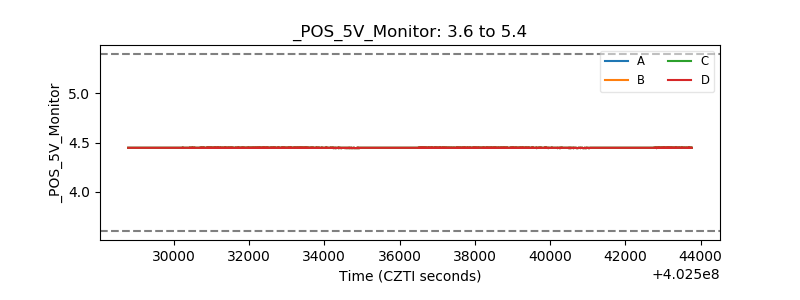 |
| _ROLL_ROT | 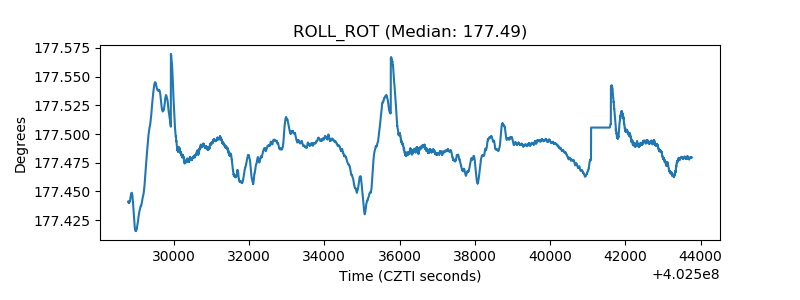 |
| _Roll_DEC | 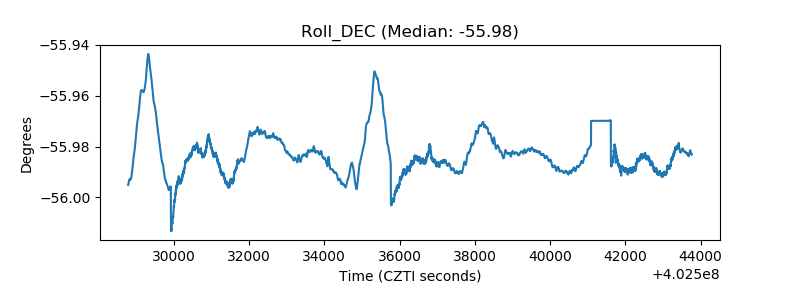 |
| _Roll_RA | 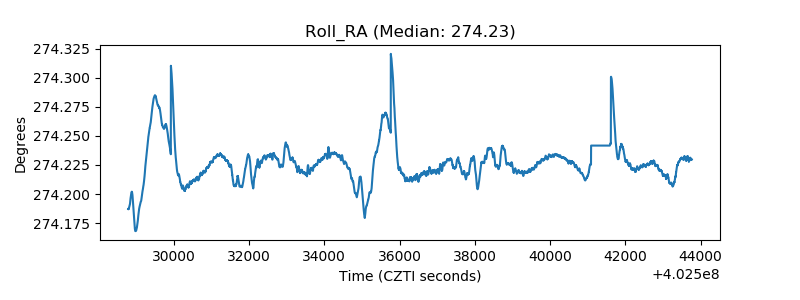 |
| Veto Counter | 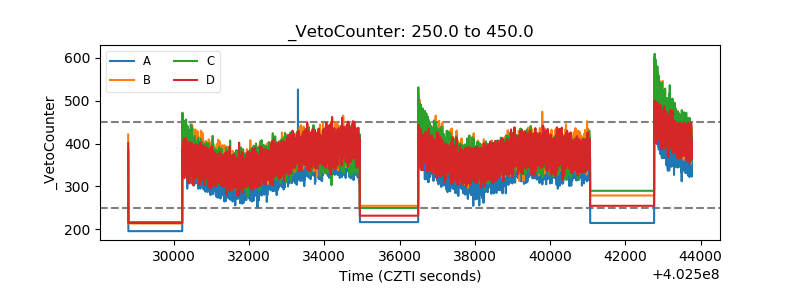 |