| Param | Original file | Final file |
|---|---|---|
| Filename | modeM0/AS1A11_082T01_9000005356_37938cztM0_level2.evt | modeM0/AS1A11_082T01_9000005356_37938cztM0_level2_quad_clean.evt |
| Size (bytes) | 482,713,920 | 58,374,720 |
| Size | 460.4 MB | 55.7 MB |
| Events in quadrant A | 3,070,834 | 353,417 |
| Events in quadrant B | 2,842,655 | 362,930 |
| Events in quadrant C | 2,815,392 | 369,980 |
| Events in quadrant D | 5,521,549 | 300,388 |
| Mode M0 | |||
|---|---|---|---|
| Quadrant | BADHDUFLAG | Total packets | Discarded packets |
| A | 0 | 12338 | 3 |
| B | 0 | 11868 | 2 |
| C | 0 | 11456 | 2 |
| D | 0 | 20183 | 2 |
| Mode SS | |||
|---|---|---|---|
| Quadrant | BADHDUFLAG | Total packets | Discarded packets |
| A | 0 | 110 | 0 |
| B | 0 | 110 | 0 |
| C | 0 | 110 | 0 |
| D | 0 | 110 | 0 |
| Mode M9 | |||
|---|---|---|---|
| Quadrant | BADHDUFLAG | Total packets | Discarded packets |
| A | 0 | 29 | 0 |
| B | 0 | 29 | 0 |
| C | 0 | 29 | 0 |
| D | 0 | 30 | 0 |
| Quadrant | Total seconds | Saturated seconds | Saturation percentage |
|---|---|---|---|
| A | 5434 | 20 | 0.368053% |
| B | 5434 | 43 | 0.791314% |
| C | 5434 | 27 | 0.496872% |
| D | 5434 | 800 | 14.722120% |
Noise dominated data is calculated using 1-second bins in cleaned event files. If a bin has >2000 counts, and if more than 50% of those come from <1% of pixels, then it is considered to be noise-dominated and hence unusable.
| Quadrant | # 1 sec bins | Bins with >0 counts | Bins with >2000 counts | High rate bins dominated by noise | Noise dominated (total time) | Noise dominated (detector-on time) | Marked lightcurve |
|---|---|---|---|---|---|---|---|
| A | 7256 | 5435 | 13 | 13 | 0.18% | 0.24% | 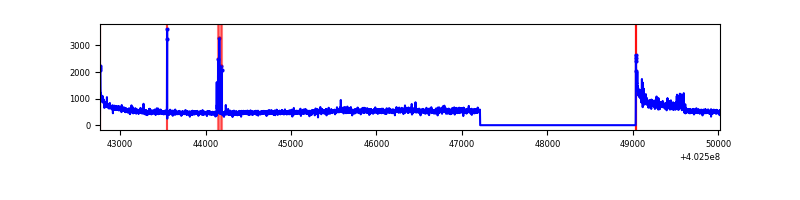 |
| B | 7256 | 5435 | 22 | 22 | 0.30% | 0.40% | 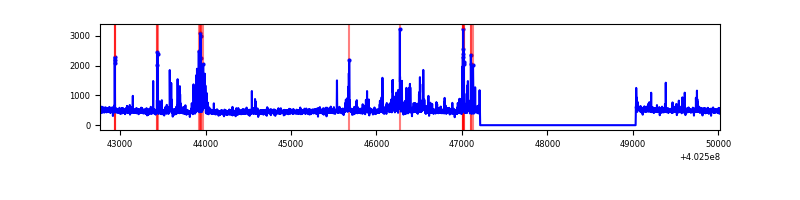 |
| C | 7256 | 5435 | 15 | 15 | 0.21% | 0.28% | 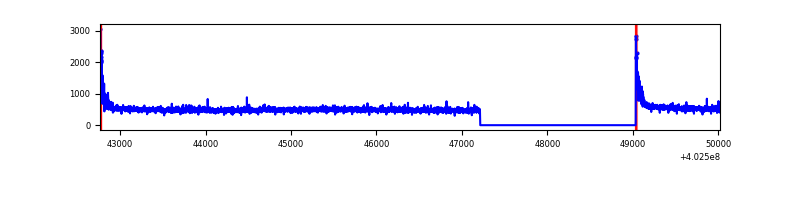 |
| D | 7256 | 5435 | 753 | 753 | 10.38% | 13.85% | 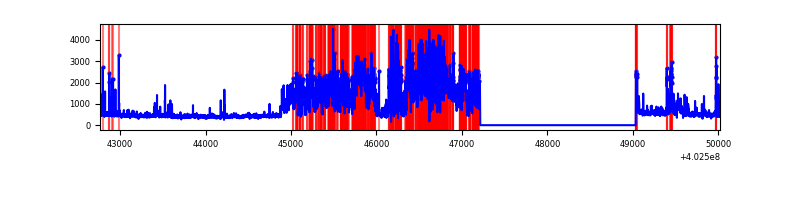 |
Top three noisy pixels from each quadrant. If the there are fewer than three noisy pixels in the level2.evt file, extra rows are filled as -1
| Pixel properties | Quadrant properties | ||||||
|---|---|---|---|---|---|---|---|
| Quadrant | DetID | PixID | Counts | Sigma | Mean | Median | Sigma |
| A | 10 | 83 | 362653 | 2858.67 | 630 | 619 | 126.6 |
| A | 15 | 222 | 191256 | 1505.3 | 630 | 619 | 126.6 |
| A | 7 | 3 | 26076 | 201.01 | 630 | 619 | 126.6 |
| B | 5 | 172 | 255692 | 2136.19 | 632 | 616 | 119.4 |
| B | 0 | 230 | 60050 | 497.74 | 632 | 616 | 119.4 |
| B | 4 | 171 | 24025 | 196.04 | 632 | 616 | 119.4 |
| C | 15 | 214 | 230074 | 1598.71 | 623 | 628 | 143.5 |
| C | 0 | 10 | 139058 | 964.54 | 623 | 628 | 143.5 |
| C | 14 | 254 | 7262 | 46.22 | 623 | 628 | 143.5 |
| D | 1 | 52 | 2029028 | 14333.67 | 588 | 572 | 141.5 |
| D | 12 | 233 | 943271 | 6661.39 | 588 | 572 | 141.5 |
| D | 9 | 35 | 115254 | 810.38 | 588 | 572 | 141.5 |
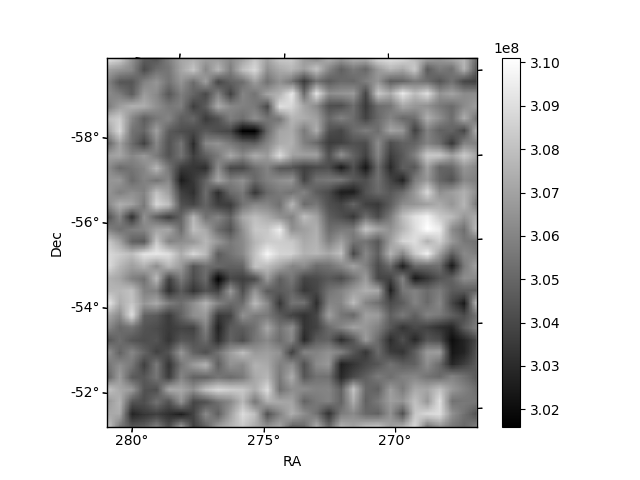
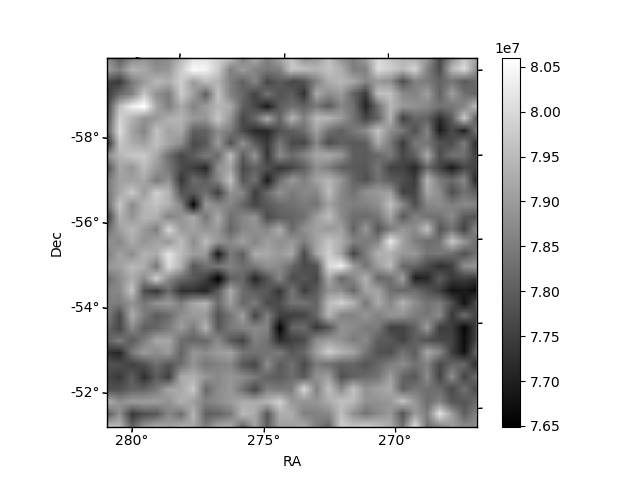
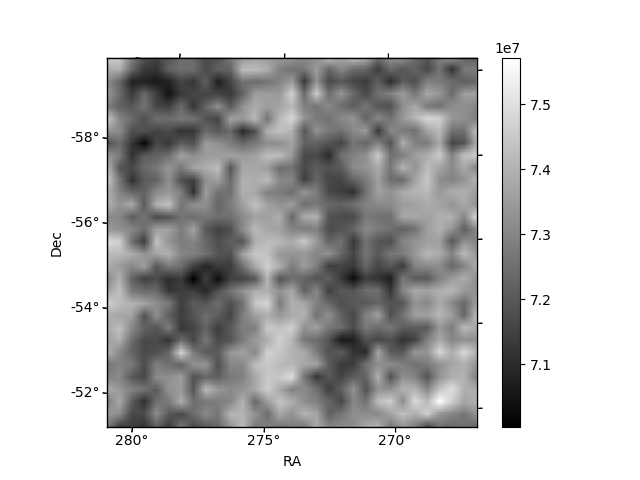
Histogram calculated using DETX and DETY for each event in the final _common_clean file
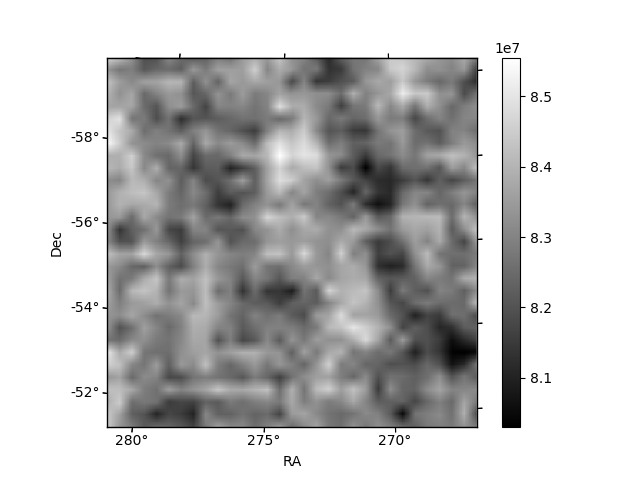
| Quadrant A | 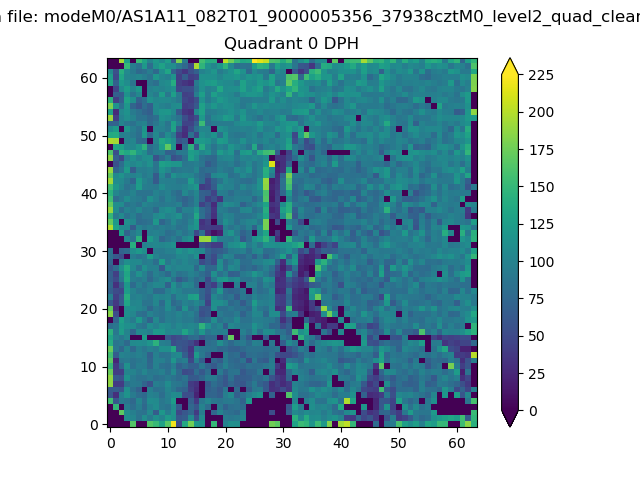 |
 |
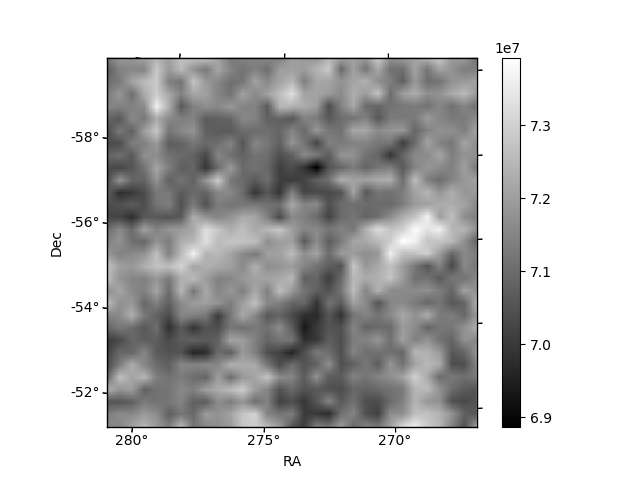
Quadrant B |
|---|---|---|---|
| Quadrant D | 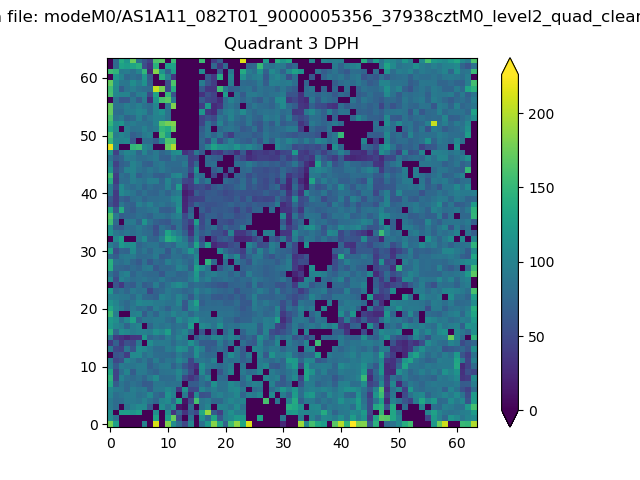 |
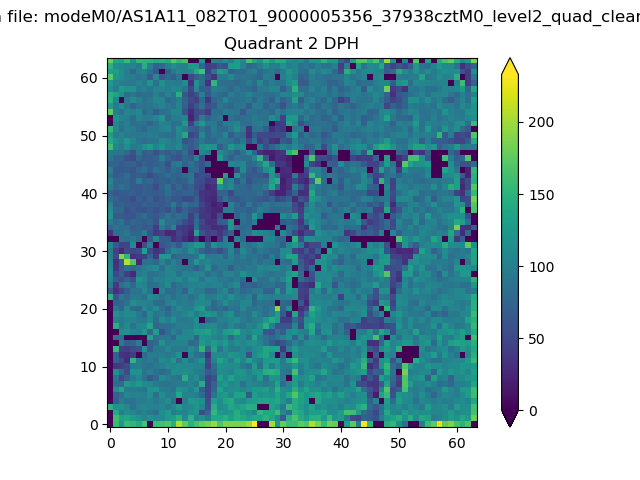 |
Quadrant C |
| Plot type | Count rate plots | Images |
|---|---|---|
| Comparison with Poisson distribution Blue bars denote a histogram of data divided into 1 sec bins. Red curve is a Poisson curve with rate = median count rate of data. |
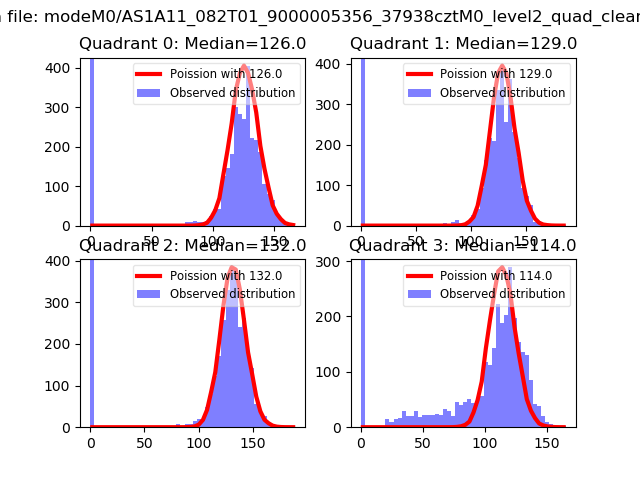 |
 |
| Quadrant-wise count rates Data is divided into 100 sec bins |
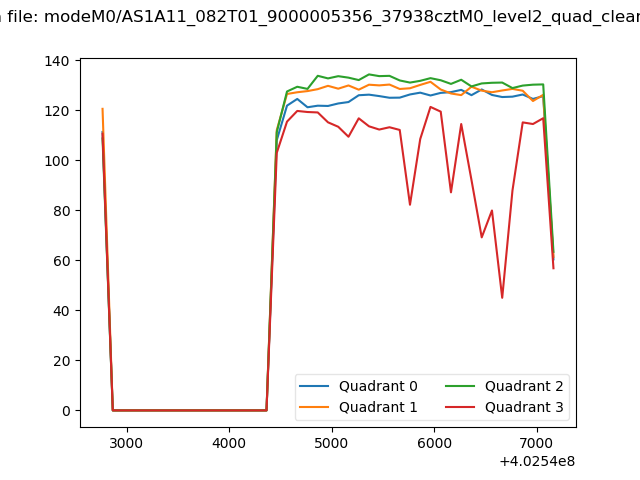 |
|
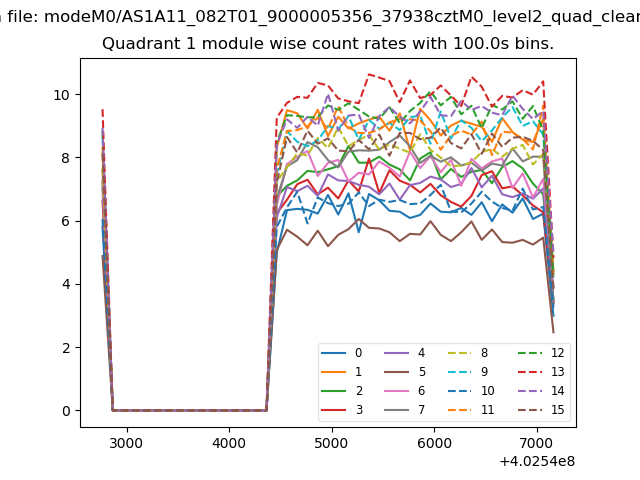
| Module-wise count rates for Quadrant A Data is divided into 100 sec bins |
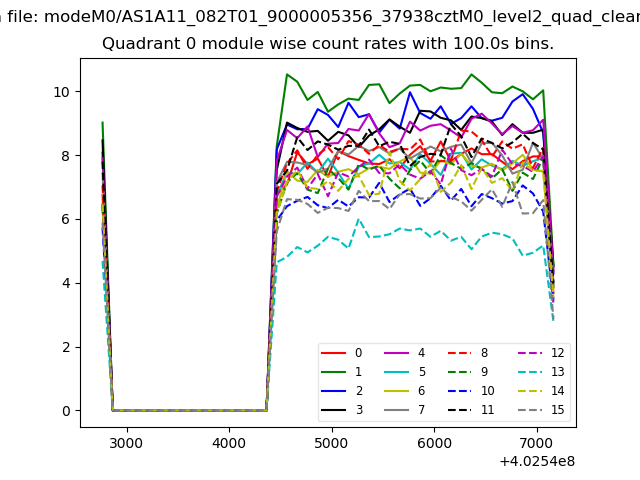 |
 |
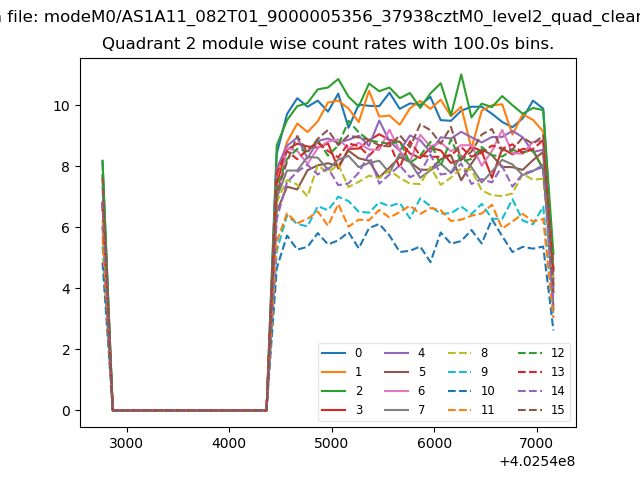
| Module-wise count rates for Quadrant B Data is divided into 100 sec bins |
 |
 |
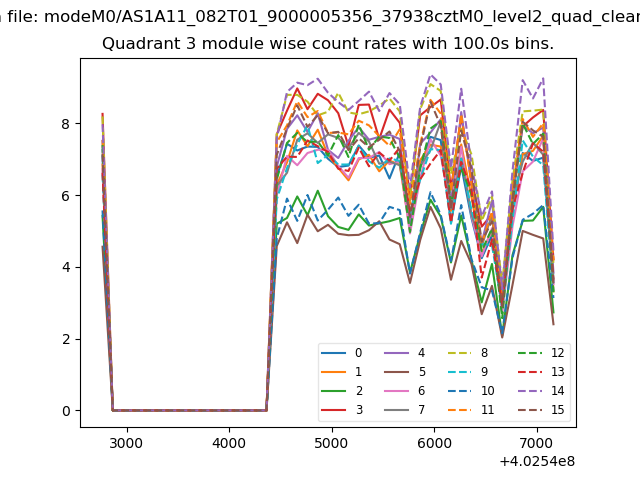
| Module-wise count rates for Quadrant C Data is divided into 100 sec bins |
 |
 |
| Module-wise count rates for Quadrant D Data is divided into 100 sec bins |
 |
 |
| Parameter | Plot |
|---|---|
| CZT HV Monitor | 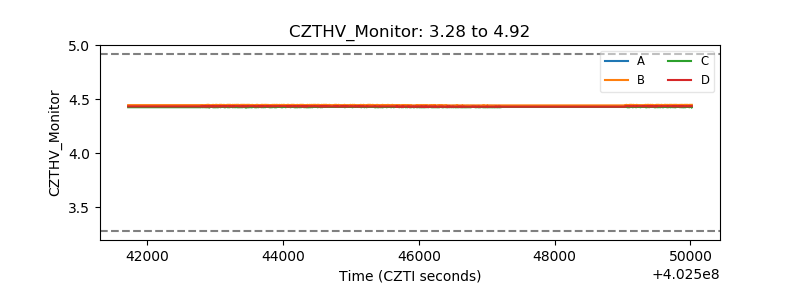 |
| D_VDD | 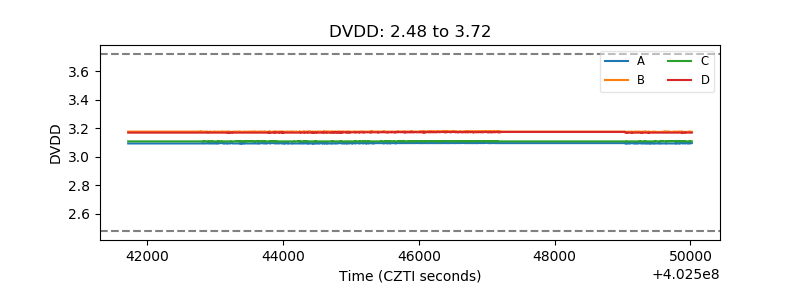 |
| Temperature 1 | 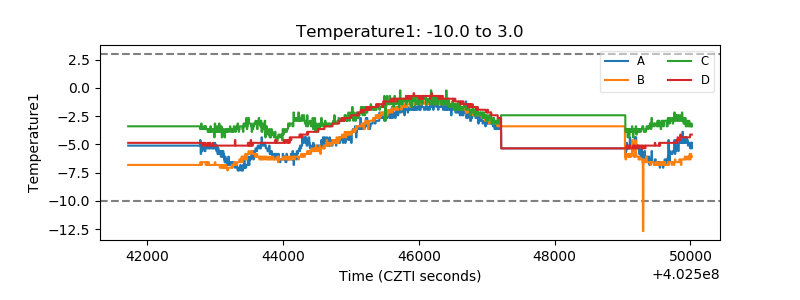 |
| Veto HV Monitor | 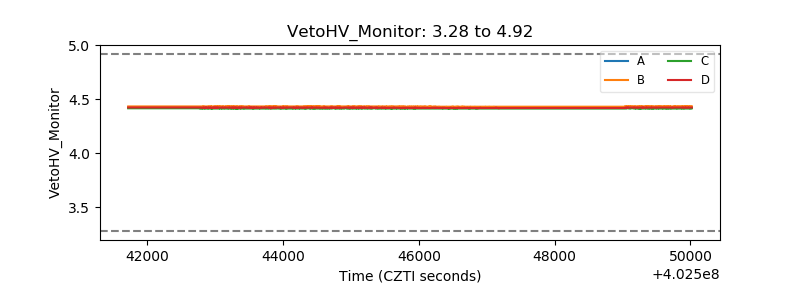 |
| Veto LLD | 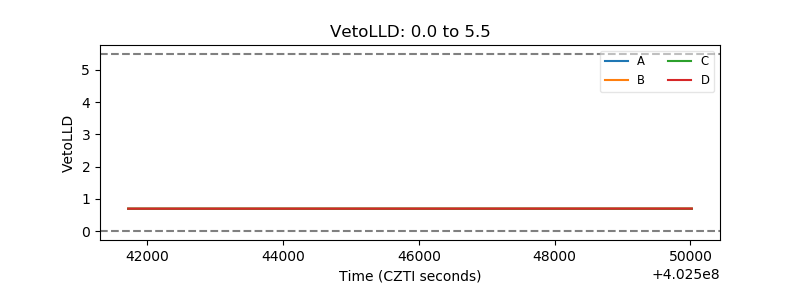 |
| Alpha Counter | 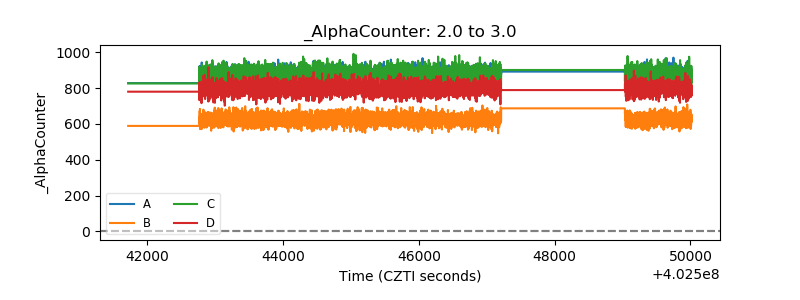 |
| _CPM_Rate | 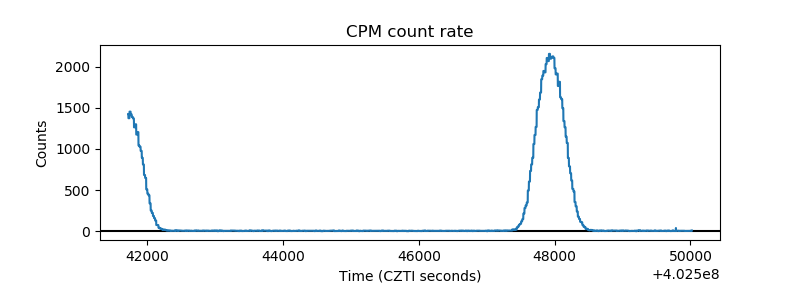 |
| CZT Counter | 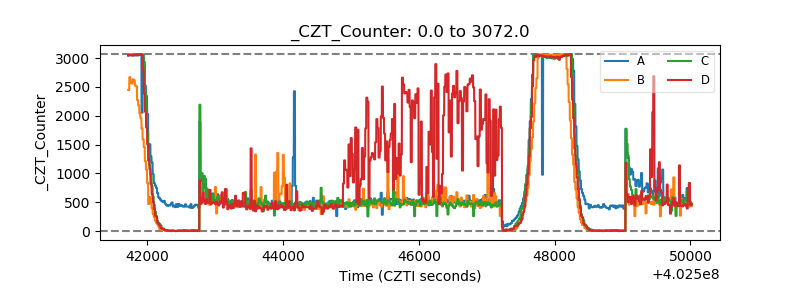 |
| +2.5 Volts monitor | 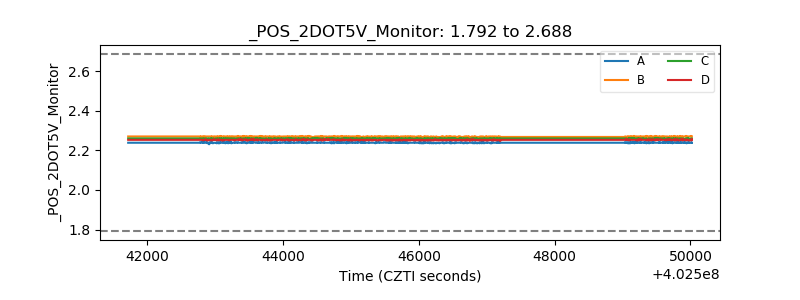 |
| +5 Volts monitor | 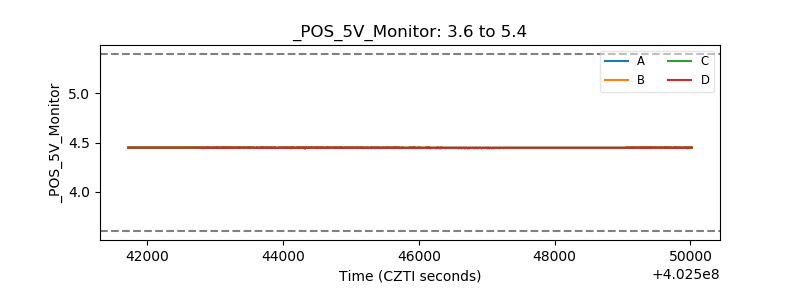 |
| _ROLL_ROT | 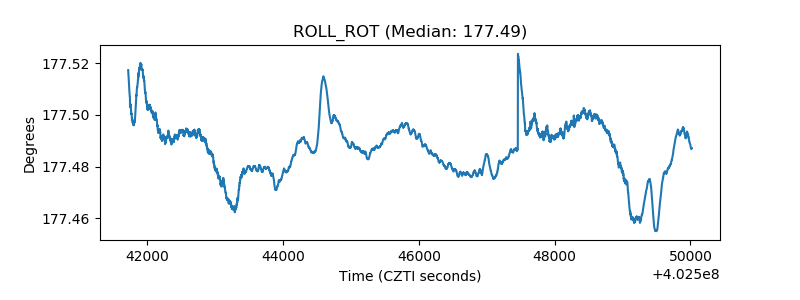 |
| _Roll_DEC | 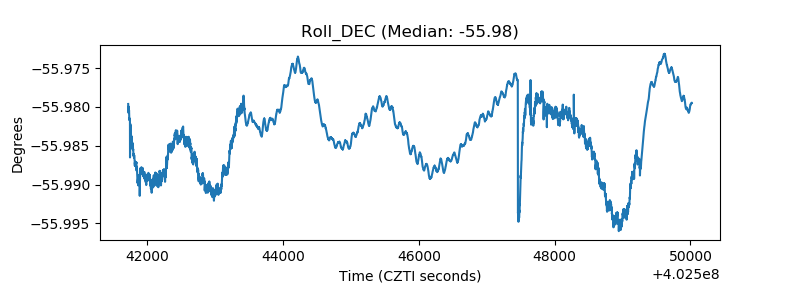 |
| _Roll_RA | 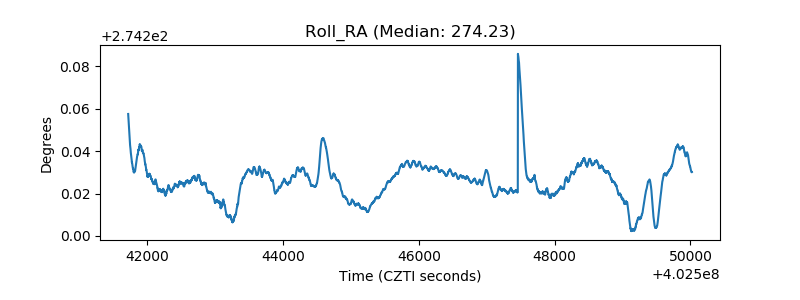 |
| Veto Counter | 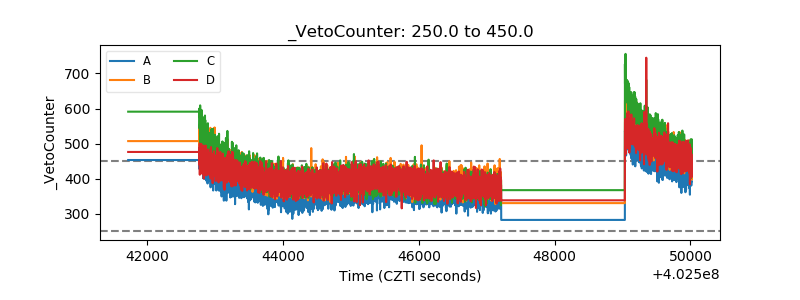 |