| Param | Original file | Final file |
|---|---|---|
| Filename | modeM0/AS1A11_082T01_9000005356_37939cztM0_level2.evt | modeM0/AS1A11_082T01_9000005356_37939cztM0_level2_quad_clean.evt |
| Size (bytes) | 434,082,240 | 59,564,160 |
| Size | 414.0 MB | 56.8 MB |
| Events in quadrant A | 2,972,179 | 366,588 |
| Events in quadrant B | 2,566,348 | 378,676 |
| Events in quadrant C | 2,792,554 | 374,239 |
| Events in quadrant D | 4,465,067 | 322,912 |
| Mode M0 | |||
|---|---|---|---|
| Quadrant | BADHDUFLAG | Total packets | Discarded packets |
| A | 0 | 11776 | 3 |
| B | 0 | 10705 | 2 |
| C | 0 | 11178 | 2 |
| D | 0 | 16698 | 2 |
| Mode SS | |||
|---|---|---|---|
| Quadrant | BADHDUFLAG | Total packets | Discarded packets |
| A | 0 | 106 | 0 |
| B | 0 | 106 | 0 |
| C | 0 | 106 | 0 |
| D | 0 | 106 | 0 |
| Mode M9 | |||
|---|---|---|---|
| Quadrant | BADHDUFLAG | Total packets | Discarded packets |
| A | 0 | 29 | 0 |
| B | 0 | 29 | 0 |
| C | 0 | 29 | 0 |
| D | 0 | 30 | 0 |
| Quadrant | Total seconds | Saturated seconds | Saturation percentage |
|---|---|---|---|
| A | 5151 | 12 | 0.232964% |
| B | 5151 | 11 | 0.213551% |
| C | 5151 | 23 | 0.446515% |
| D | 5151 | 308 | 5.979421% |
Noise dominated data is calculated using 1-second bins in cleaned event files. If a bin has >2000 counts, and if more than 50% of those come from <1% of pixels, then it is considered to be noise-dominated and hence unusable.
| Quadrant | # 1 sec bins | Bins with >0 counts | Bins with >2000 counts | High rate bins dominated by noise | Noise dominated (total time) | Noise dominated (detector-on time) | Marked lightcurve |
|---|---|---|---|---|---|---|---|
| A | 7124 | 5152 | 6 | 6 | 0.08% | 0.12% | 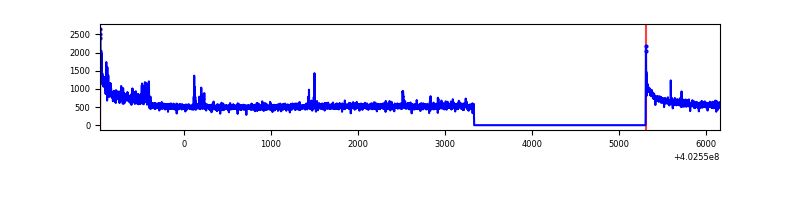 |
| B | 7124 | 5152 | 6 | 6 | 0.08% | 0.12% | 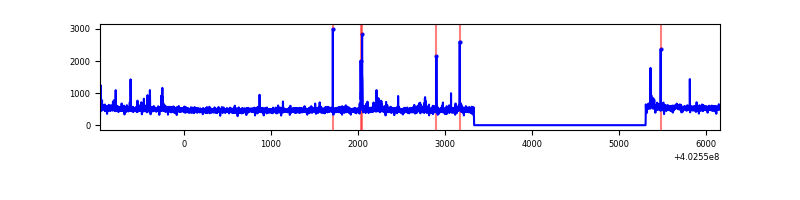 |
| C | 7124 | 5152 | 13 | 13 | 0.18% | 0.25% | 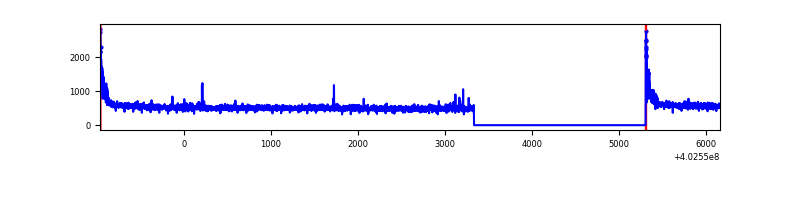 |
| D | 7124 | 5152 | 302 | 302 | 4.24% | 5.86% | 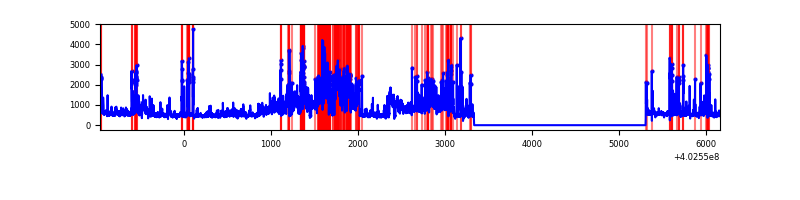 |
Top three noisy pixels from each quadrant. If the there are fewer than three noisy pixels in the level2.evt file, extra rows are filled as -1
| Pixel properties | Quadrant properties | ||||||
|---|---|---|---|---|---|---|---|
| Quadrant | DetID | PixID | Counts | Sigma | Mean | Median | Sigma |
| A | 10 | 83 | 353643 | 2835.69 | 624 | 612 | 124.5 |
| A | 15 | 222 | 155315 | 1242.64 | 624 | 612 | 124.5 |
| A | 14 | 239 | 21767 | 169.93 | 624 | 612 | 124.5 |
| B | 5 | 172 | 52882 | 452.24 | 623 | 608 | 115.6 |
| B | 0 | 230 | 36137 | 307.37 | 623 | 608 | 115.6 |
| B | 12 | 111 | 13751 | 113.7 | 623 | 608 | 115.6 |
| C | 15 | 214 | 221728 | 1570.28 | 618 | 622 | 140.8 |
| C | 0 | 10 | 134266 | 949.13 | 618 | 622 | 140.8 |
| C | 14 | 254 | 9027 | 59.69 | 618 | 622 | 140.8 |
| D | 1 | 52 | 1166711 | 7978.61 | 604 | 589 | 146.2 |
| D | 5 | 32 | 292967 | 2000.45 | 604 | 589 | 146.2 |
| D | 2 | 249 | 219860 | 1500.25 | 604 | 589 | 146.2 |
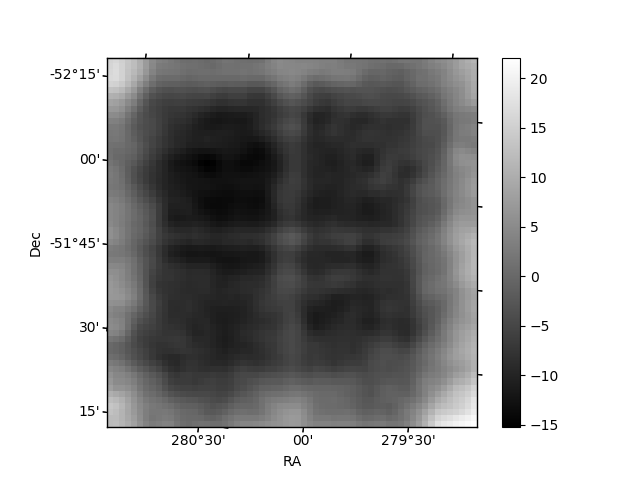
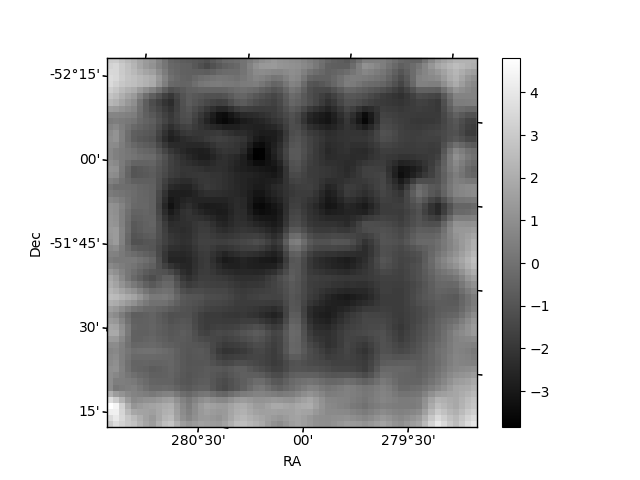
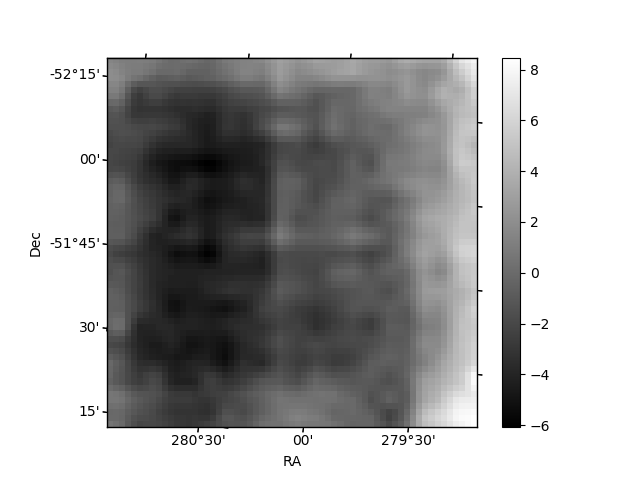
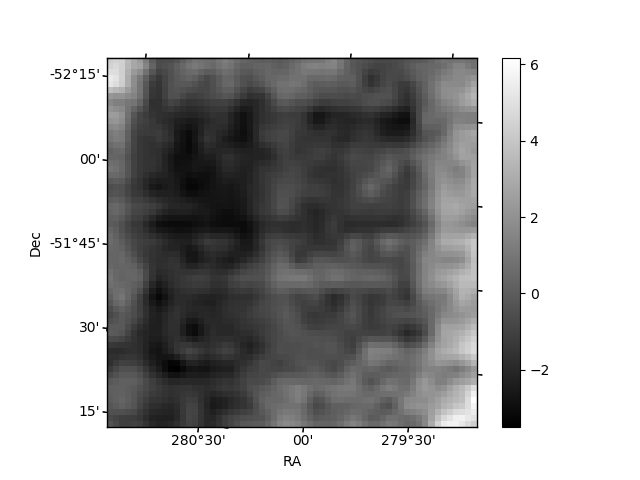
Histogram calculated using DETX and DETY for each event in the final _common_clean file
| Quadrant A | 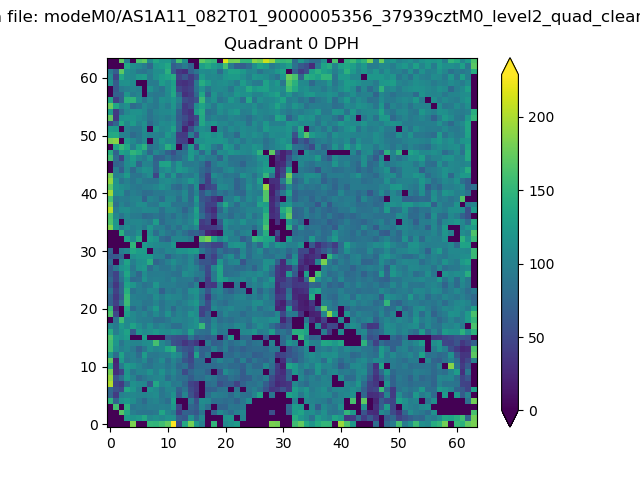 |
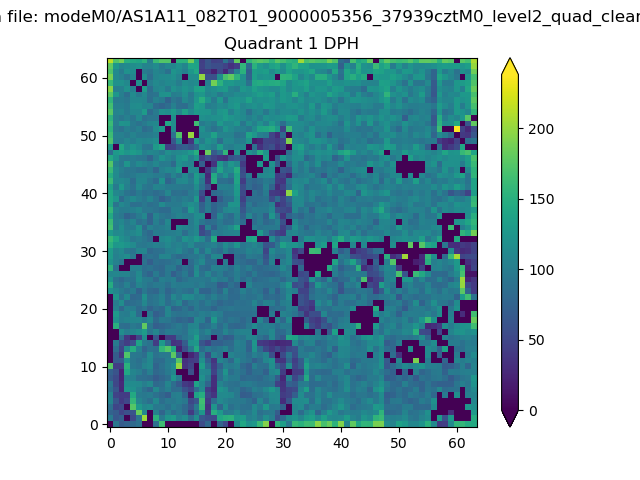 |
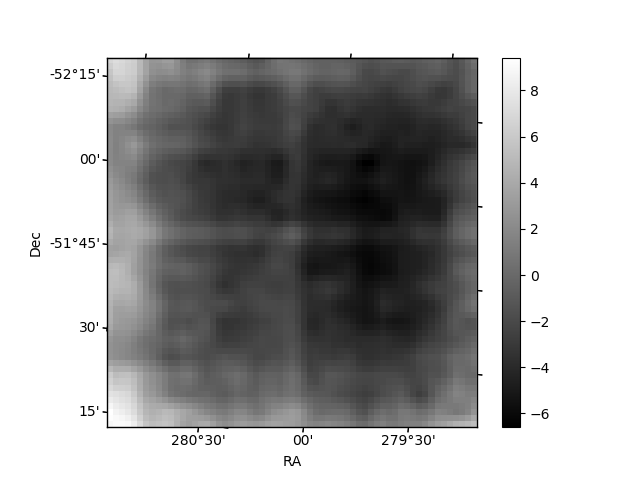
Quadrant B |
|---|---|---|---|
| Quadrant D | 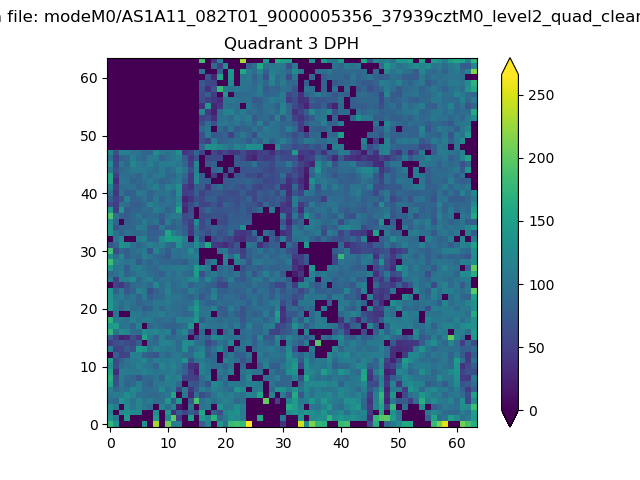 |
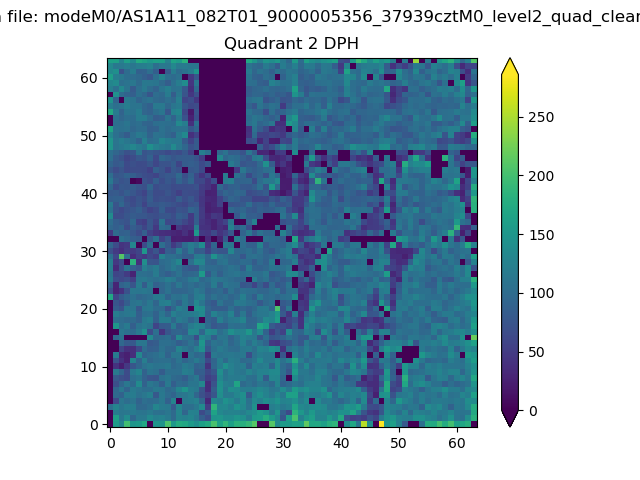 |
Quadrant C |
| Plot type | Count rate plots | Images |
|---|---|---|
| Comparison with Poisson distribution Blue bars denote a histogram of data divided into 1 sec bins. Red curve is a Poisson curve with rate = median count rate of data. |
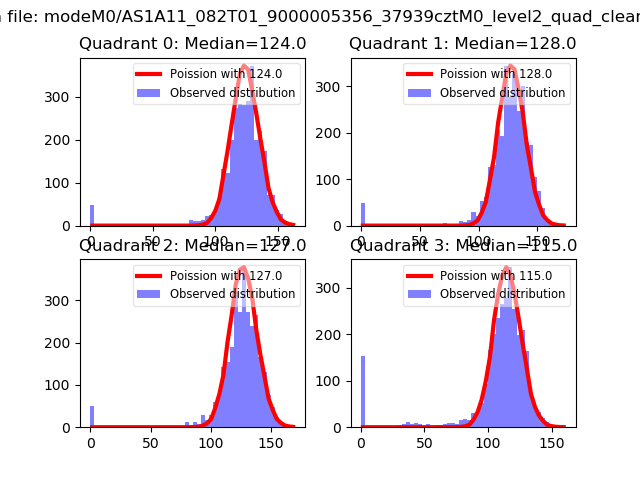 |
 |
| Quadrant-wise count rates Data is divided into 100 sec bins |
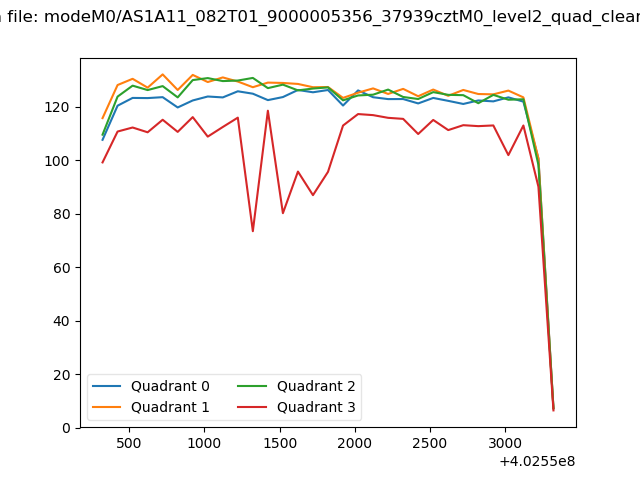 |
|
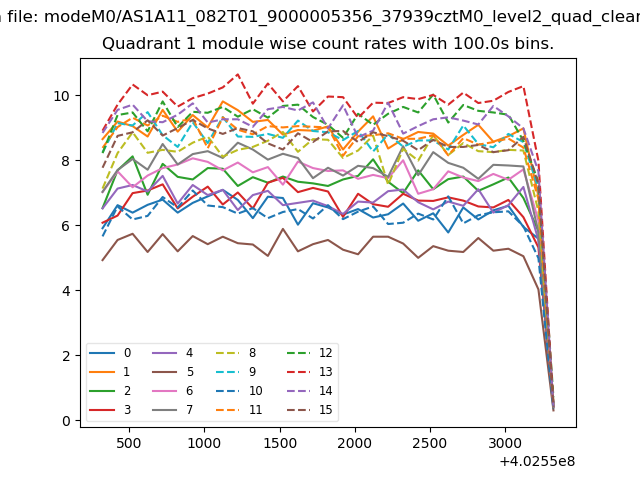
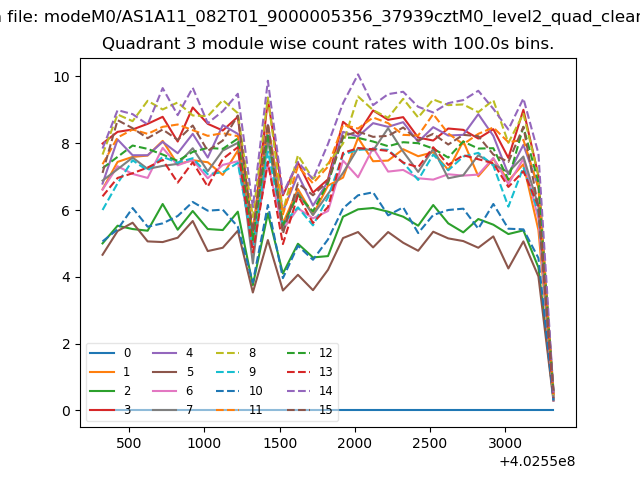
| Module-wise count rates for Quadrant A Data is divided into 100 sec bins |
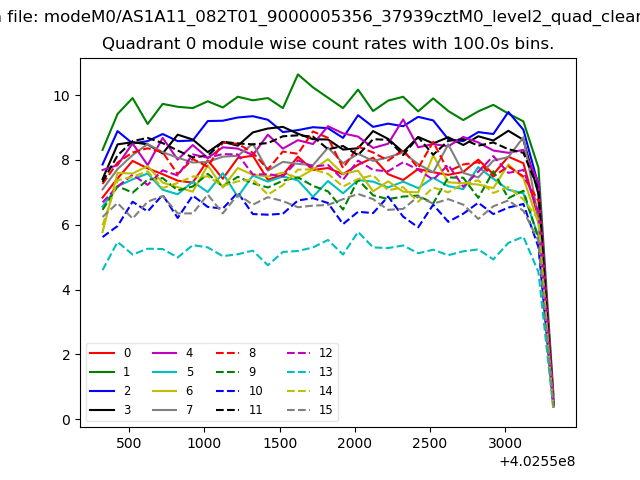 |
 |
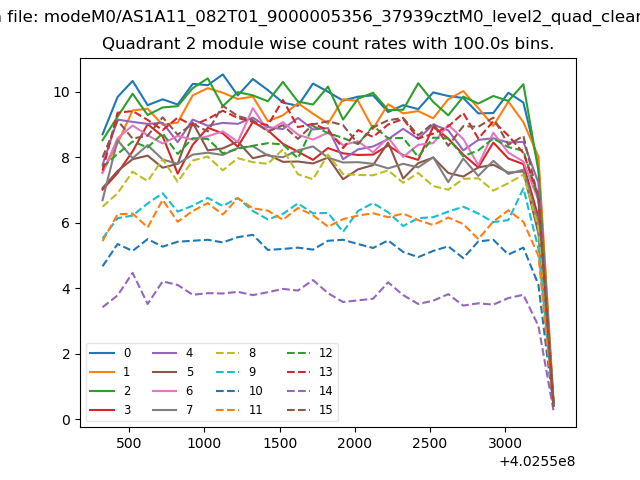
| Module-wise count rates for Quadrant B Data is divided into 100 sec bins |
 |
 |
| Module-wise count rates for Quadrant C Data is divided into 100 sec bins |
 |
 |
| Module-wise count rates for Quadrant D Data is divided into 100 sec bins |
 |
 |
| Parameter | Plot |
|---|---|
| CZT HV Monitor | 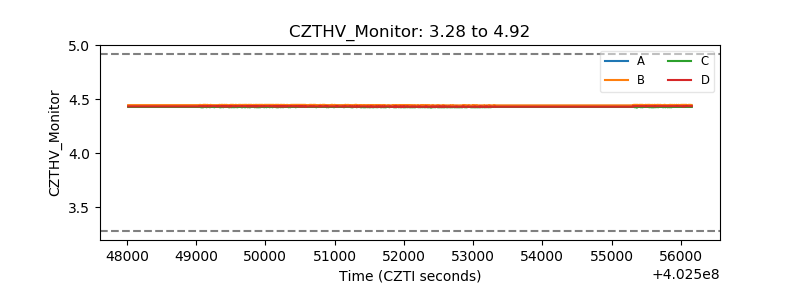 |
| D_VDD | 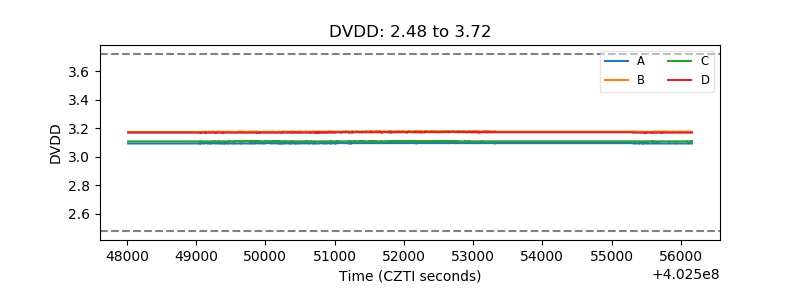 |
| Temperature 1 | 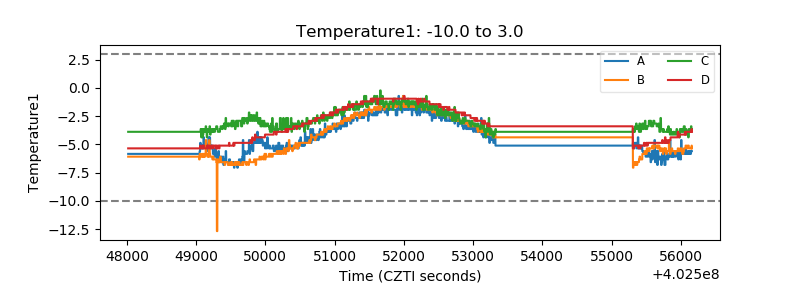 |
| Veto HV Monitor | 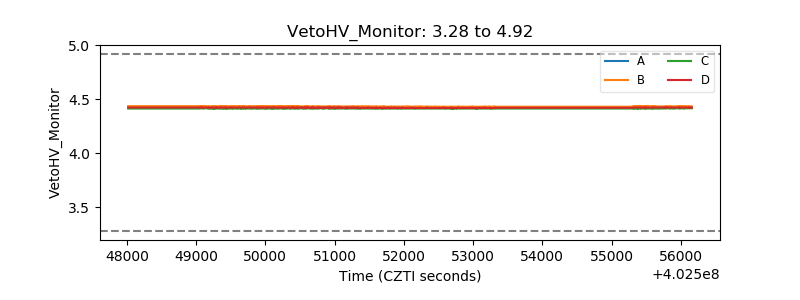 |
| Veto LLD | 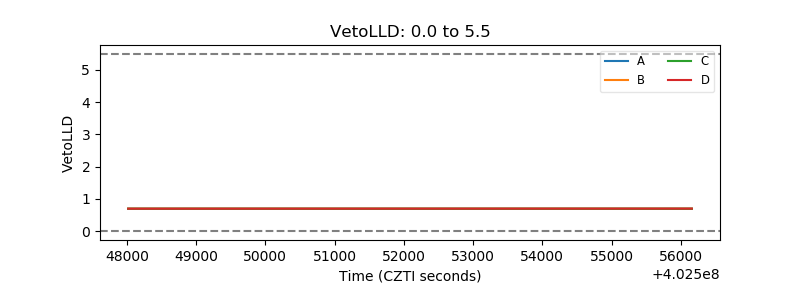 |
| Alpha Counter | 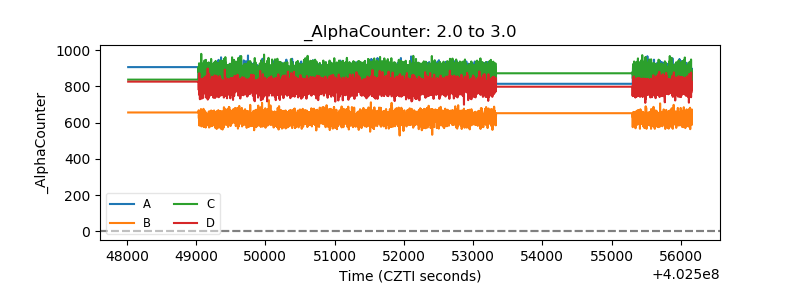 |
| _CPM_Rate | 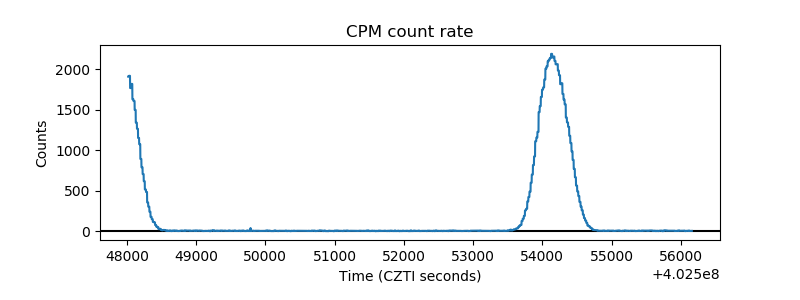 |
| CZT Counter | 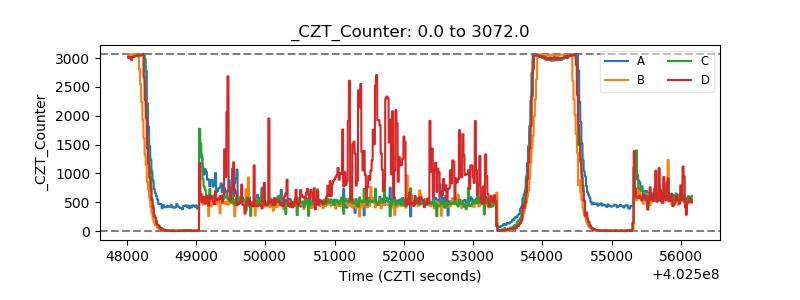 |
| +2.5 Volts monitor | 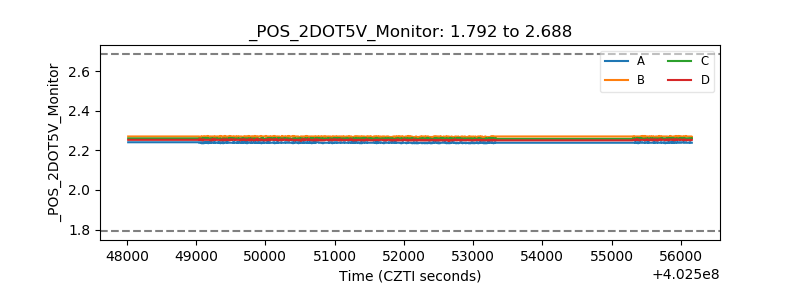 |
| +5 Volts monitor | 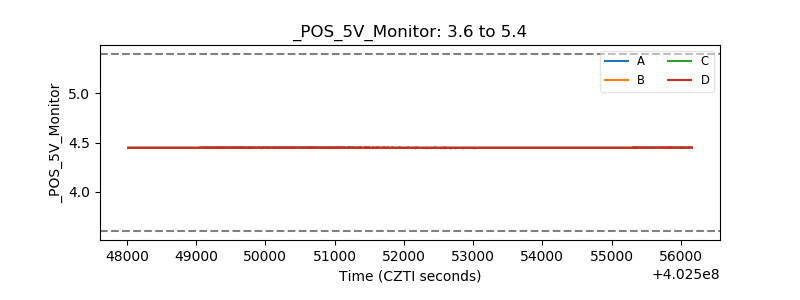 |
| _ROLL_ROT | 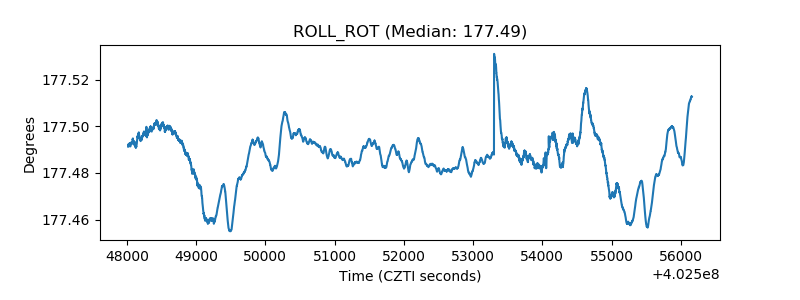 |
| _Roll_DEC | 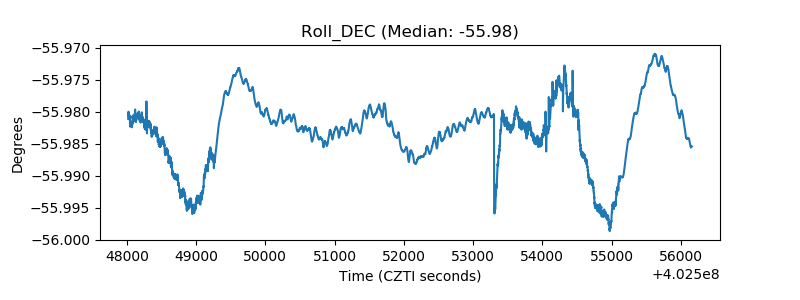 |
| _Roll_RA | 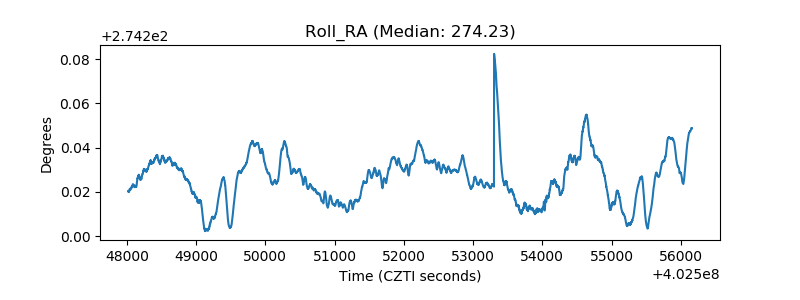 |
| Veto Counter | 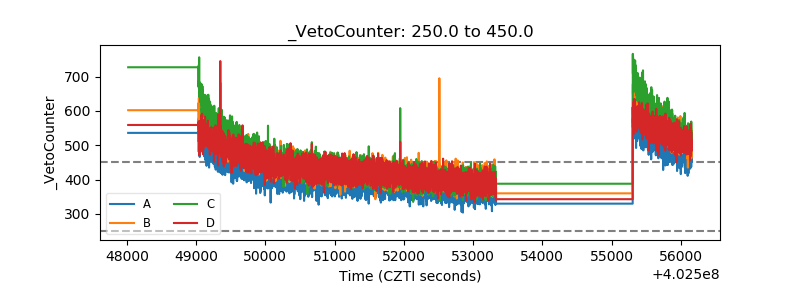 |