| Param | Original file | Final file |
|---|---|---|
| Filename | modeM0/AS1A11_082T01_9000005356_37940cztM0_level2.evt | modeM0/AS1A11_082T01_9000005356_37940cztM0_level2_quad_clean.evt |
| Size (bytes) | 408,398,400 | 53,648,640 |
| Size | 389.5 MB | 51.2 MB |
| Events in quadrant A | 2,817,565 | 327,456 |
| Events in quadrant B | 2,792,214 | 332,586 |
| Events in quadrant C | 2,776,404 | 331,797 |
| Events in quadrant D | 3,641,055 | 280,563 |
| Mode M0 | |||
|---|---|---|---|
| Quadrant | BADHDUFLAG | Total packets | Discarded packets |
| A | 0 | 11241 | 3 |
| B | 0 | 11174 | 2 |
| C | 0 | 11140 | 2 |
| D | 0 | 13989 | 2 |
| Mode SS | |||
|---|---|---|---|
| Quadrant | BADHDUFLAG | Total packets | Discarded packets |
| A | 0 | 102 | 0 |
| B | 0 | 102 | 0 |
| C | 0 | 102 | 0 |
| D | 0 | 102 | 0 |
| Mode M9 | |||
|---|---|---|---|
| Quadrant | BADHDUFLAG | Total packets | Discarded packets |
| A | 0 | 29 | 0 |
| B | 0 | 29 | 0 |
| C | 0 | 29 | 0 |
| D | 0 | 30 | 0 |
| Quadrant | Total seconds | Saturated seconds | Saturation percentage |
|---|---|---|---|
| A | 5021 | 7 | 0.139414% |
| B | 5021 | 71 | 1.414061% |
| C | 5021 | 24 | 0.477992% |
| D | 5021 | 301 | 5.994822% |
Noise dominated data is calculated using 1-second bins in cleaned event files. If a bin has >2000 counts, and if more than 50% of those come from <1% of pixels, then it is considered to be noise-dominated and hence unusable.
| Quadrant | # 1 sec bins | Bins with >0 counts | Bins with >2000 counts | High rate bins dominated by noise | Noise dominated (total time) | Noise dominated (detector-on time) | Marked lightcurve |
|---|---|---|---|---|---|---|---|
| A | 7083 | 5022 | 5 | 5 | 0.07% | 0.10% | 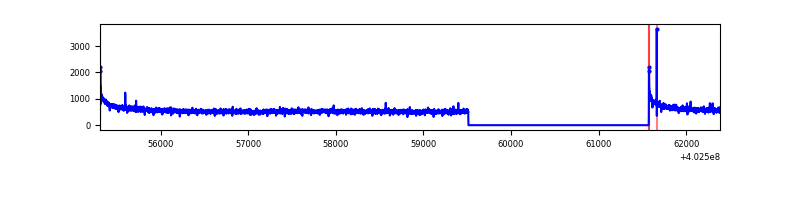 |
| B | 7083 | 5022 | 44 | 44 | 0.62% | 0.88% | 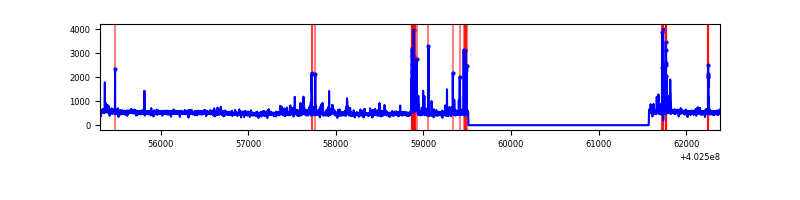 |
| C | 7083 | 5022 | 18 | 18 | 0.25% | 0.36% | 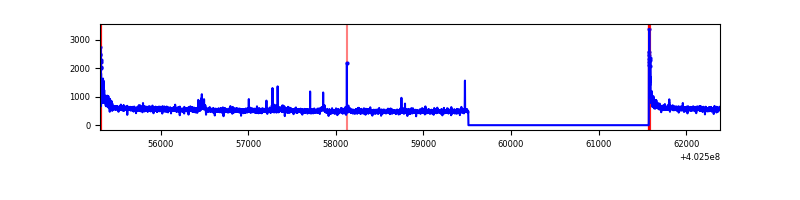 |
| D | 7083 | 5022 | 260 | 260 | 3.67% | 5.18% | 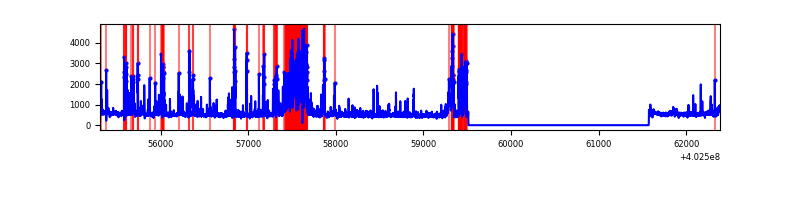 |
Top three noisy pixels from each quadrant. If the there are fewer than three noisy pixels in the level2.evt file, extra rows are filled as -1
| Pixel properties | Quadrant properties | ||||||
|---|---|---|---|---|---|---|---|
| Quadrant | DetID | PixID | Counts | Sigma | Mean | Median | Sigma |
| A | 10 | 83 | 343371 | 2742.29 | 626 | 618 | 125.0 |
| A | 12 | 189 | 17727 | 136.89 | 626 | 618 | 125.0 |
| A | 15 | 222 | 12954 | 98.7 | 626 | 618 | 125.0 |
| B | 5 | 172 | 252700 | 2173.09 | 620 | 605 | 116.0 |
| B | 0 | 230 | 51895 | 442.13 | 620 | 605 | 116.0 |
| B | 4 | 80 | 28481 | 240.29 | 620 | 605 | 116.0 |
| C | 15 | 214 | 215683 | 1534.53 | 615 | 620 | 140.1 |
| C | 0 | 10 | 111569 | 791.65 | 615 | 620 | 140.1 |
| C | 14 | 254 | 28581 | 199.51 | 615 | 620 | 140.1 |
| D | 2 | 249 | 865050 | 5860.9 | 604 | 588 | 147.5 |
| D | 1 | 52 | 279614 | 1891.75 | 604 | 588 | 147.5 |
| D | 13 | 249 | 59325 | 398.23 | 604 | 588 | 147.5 |
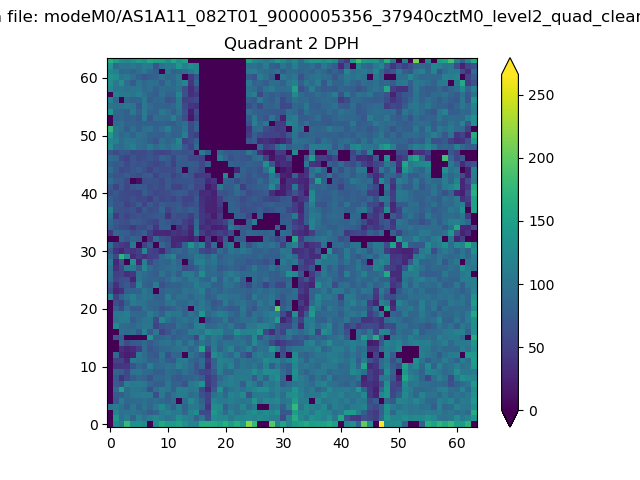
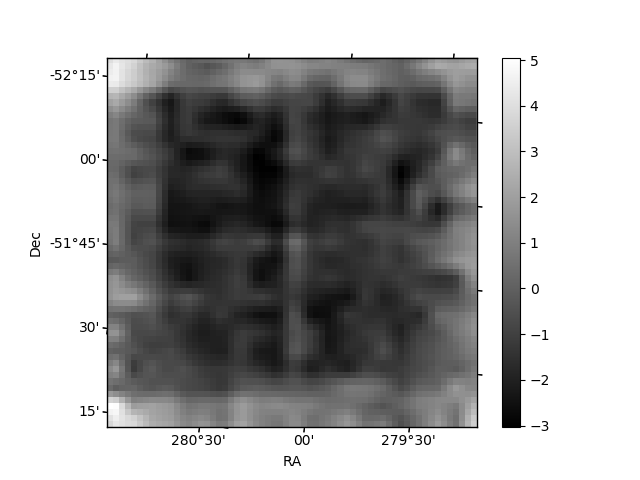
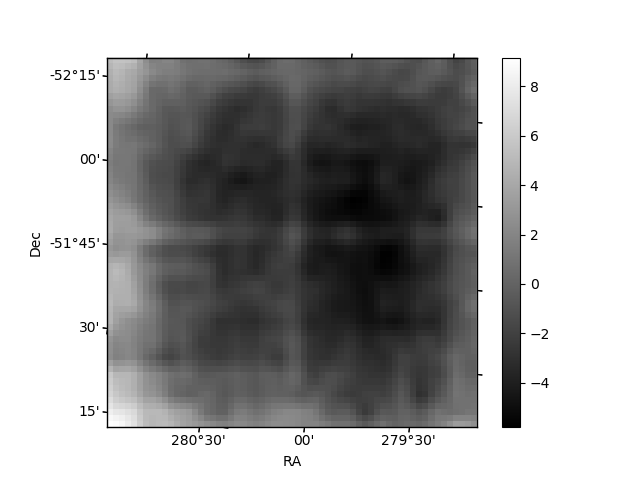
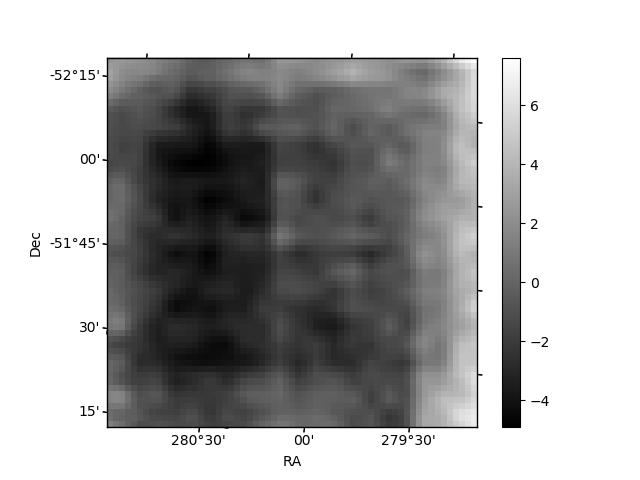
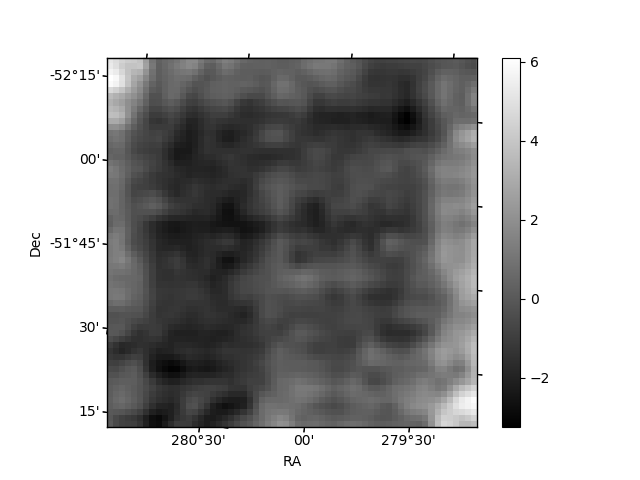
Histogram calculated using DETX and DETY for each event in the final _common_clean file
| Quadrant A | 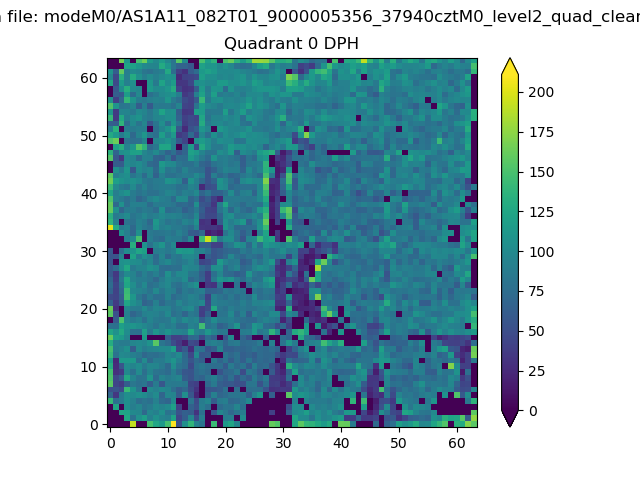 |
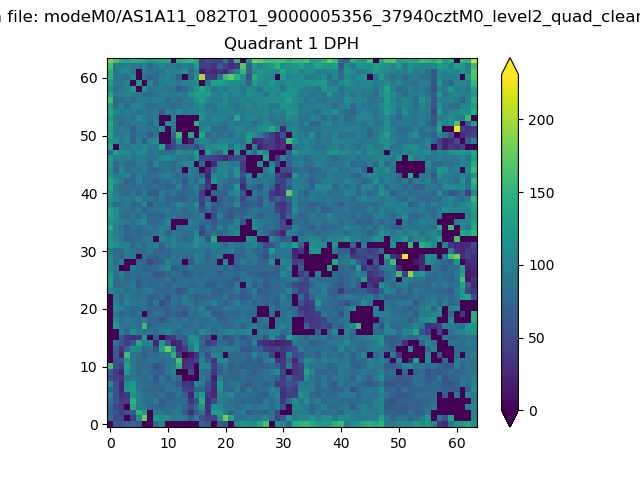 |
Quadrant B |
|---|---|---|---|
| Quadrant D | 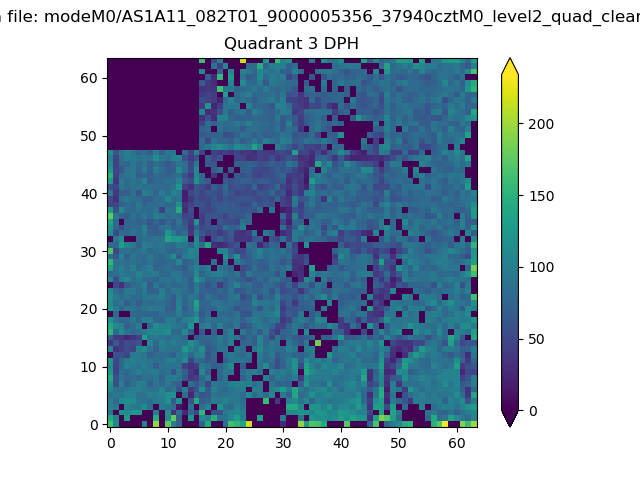 |
 |
Quadrant C |
| Plot type | Count rate plots | Images |
|---|---|---|
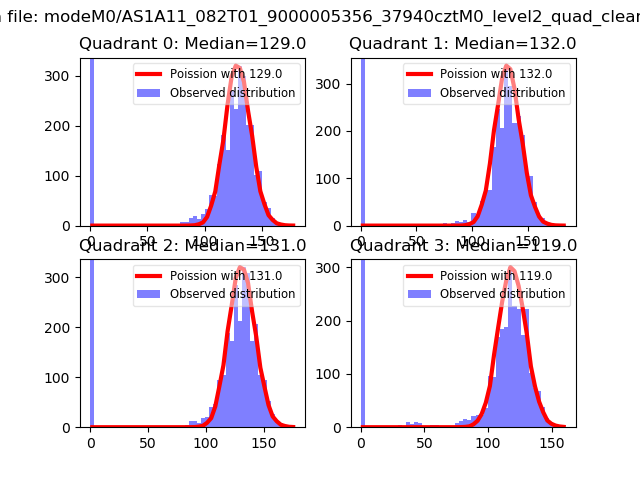
| Comparison with Poisson distribution Blue bars denote a histogram of data divided into 1 sec bins. Red curve is a Poisson curve with rate = median count rate of data. |
 |
 |
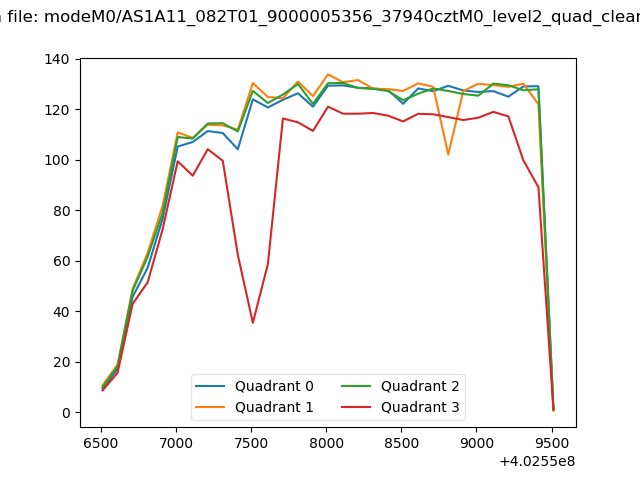
| Quadrant-wise count rates Data is divided into 100 sec bins |
 |
|
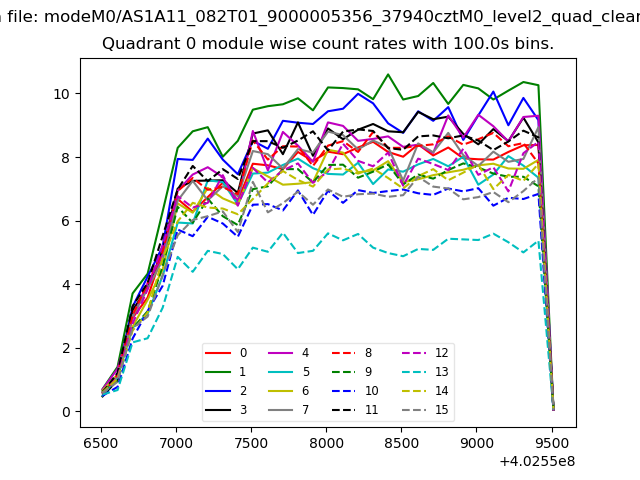
| Module-wise count rates for Quadrant A Data is divided into 100 sec bins |
 |
 |
| Module-wise count rates for Quadrant B Data is divided into 100 sec bins |
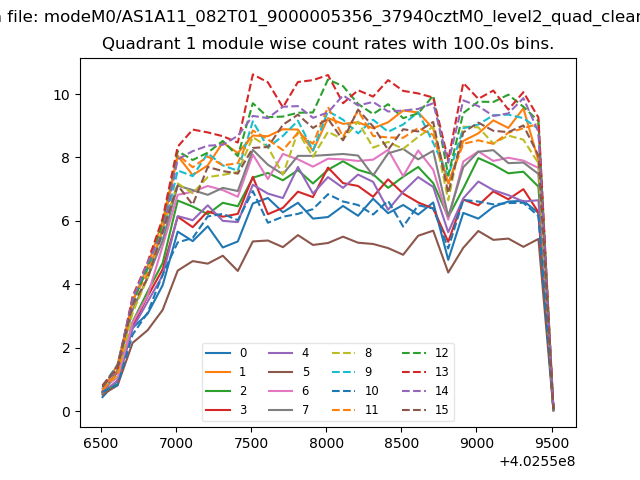 |
 |
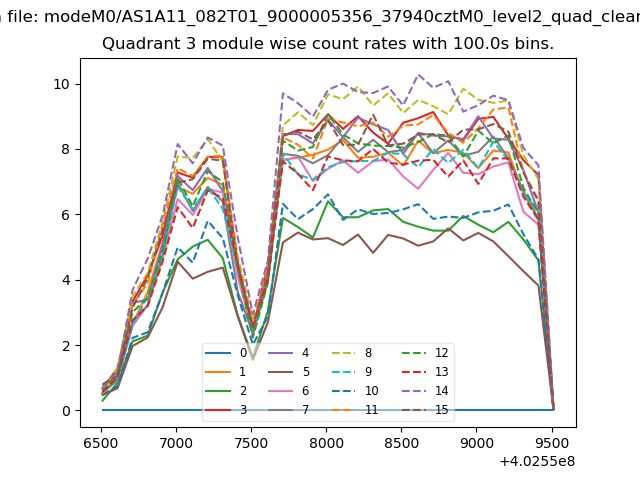
| Module-wise count rates for Quadrant C Data is divided into 100 sec bins |
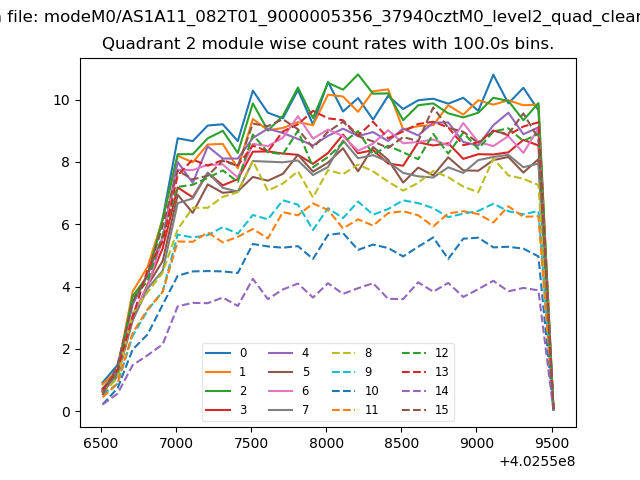 |
 |
| Module-wise count rates for Quadrant D Data is divided into 100 sec bins |
 |
 |
| Parameter | Plot |
|---|---|
| CZT HV Monitor | 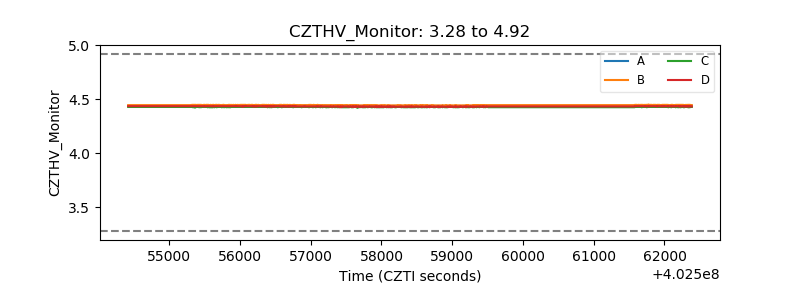 |
| D_VDD |  |
| Temperature 1 | 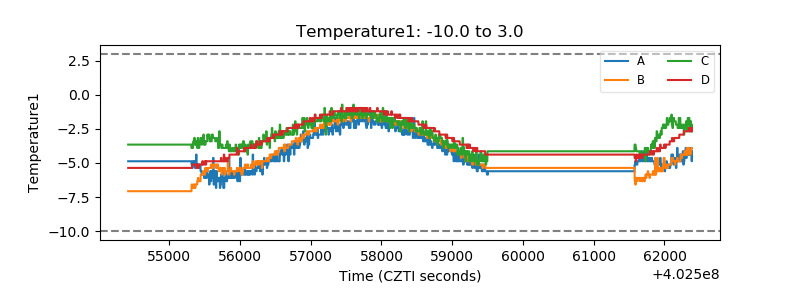 |
| Veto HV Monitor | 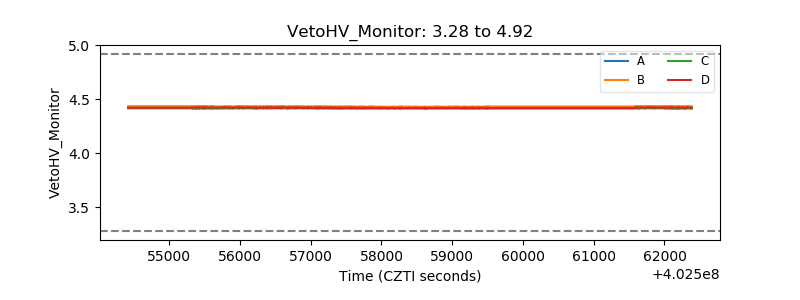 |
| Veto LLD | 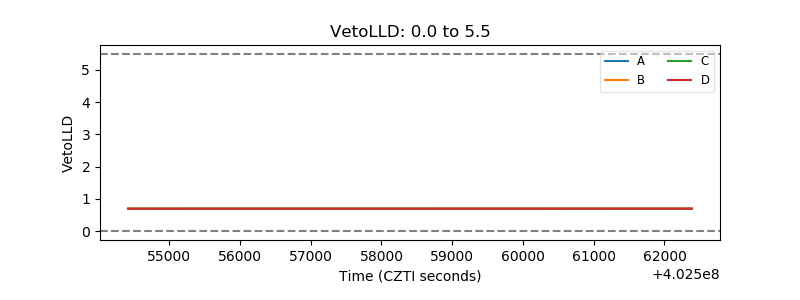 |
| Alpha Counter | 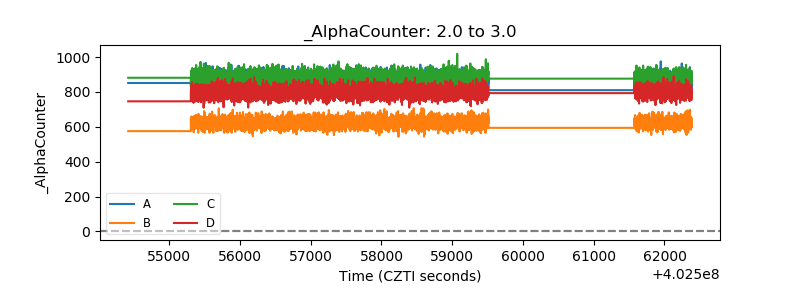 |
| _CPM_Rate | 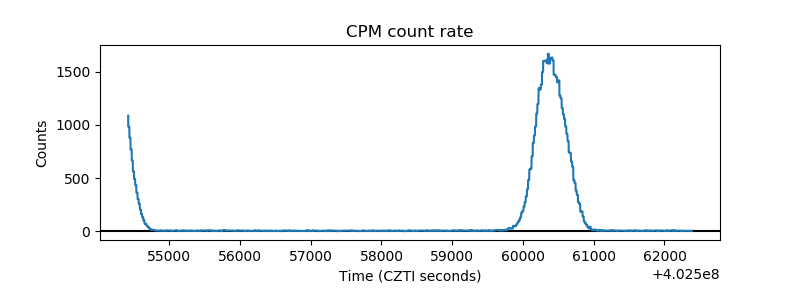 |
| CZT Counter | 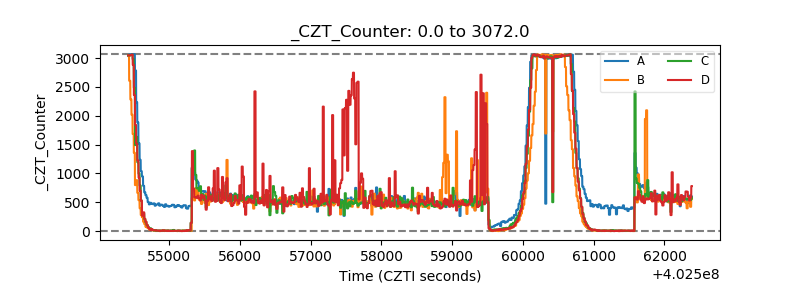 |
| +2.5 Volts monitor | 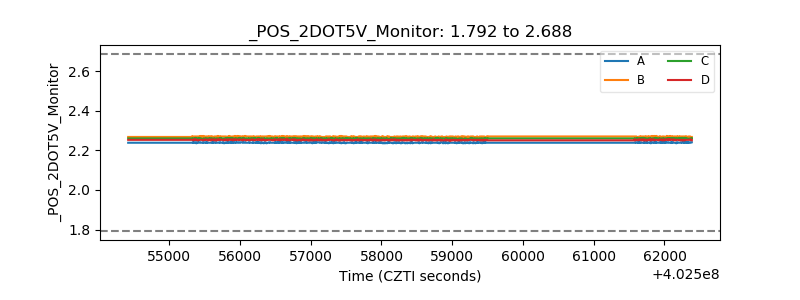 |
| +5 Volts monitor | 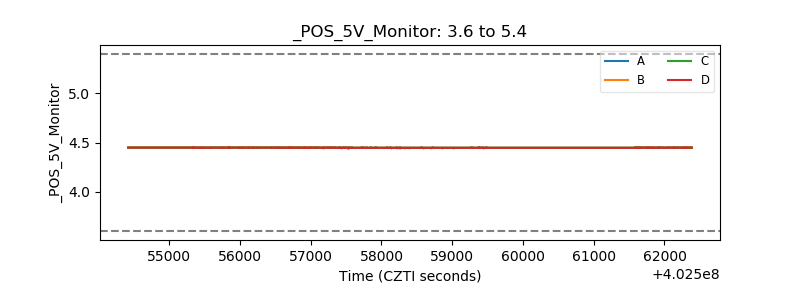 |
| _ROLL_ROT | 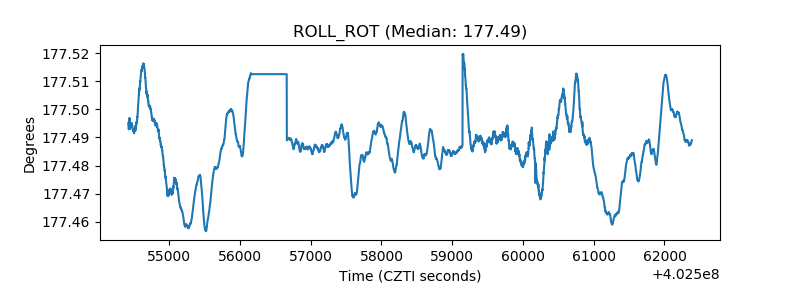 |
| _Roll_DEC | 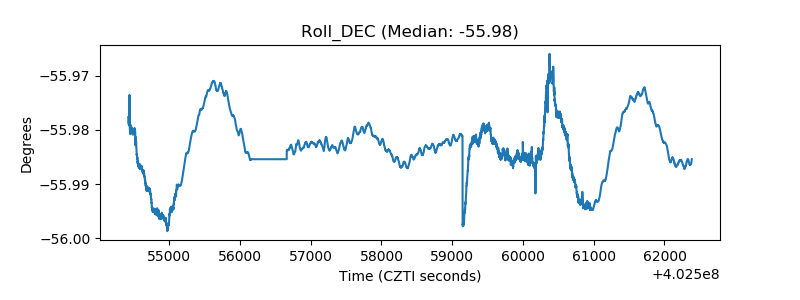 |
| _Roll_RA | 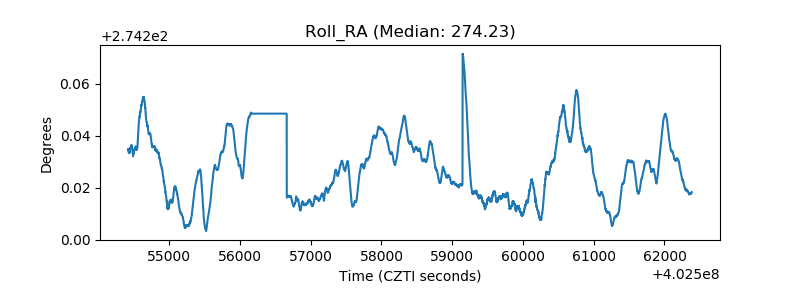 |
| Veto Counter | 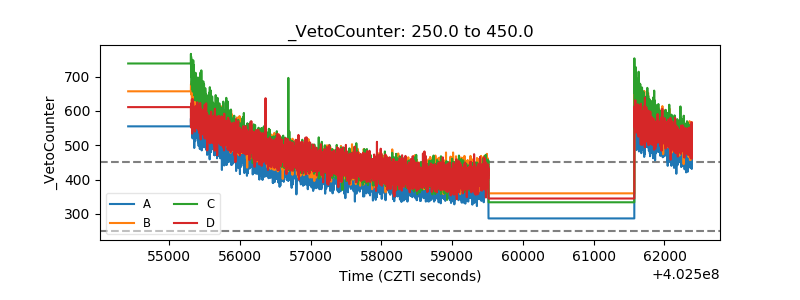 |