| Param | Original file | Final file |
|---|---|---|
| Filename | modeM0/AS1A11_082T01_9000005356_37941cztM0_level2.evt | modeM0/AS1A11_082T01_9000005356_37941cztM0_level2_quad_clean.evt |
| Size (bytes) | 380,992,320 | 54,720,000 |
| Size | 363.3 MB | 52.2 MB |
| Events in quadrant A | 2,751,226 | 335,786 |
| Events in quadrant B | 2,645,040 | 340,997 |
| Events in quadrant C | 2,666,577 | 337,247 |
| Events in quadrant D | 3,144,880 | 301,613 |
| Mode M0 | |||
|---|---|---|---|
| Quadrant | BADHDUFLAG | Total packets | Discarded packets |
| A | 0 | 10995 | 3 |
| B | 0 | 10764 | 2 |
| C | 0 | 10713 | 2 |
| D | 0 | 12354 | 2 |
| Mode SS | |||
|---|---|---|---|
| Quadrant | BADHDUFLAG | Total packets | Discarded packets |
| A | 0 | 98 | 0 |
| B | 0 | 98 | 0 |
| C | 0 | 98 | 0 |
| D | 0 | 98 | 0 |
| Mode M9 | |||
|---|---|---|---|
| Quadrant | BADHDUFLAG | Total packets | Discarded packets |
| A | 0 | 29 | 0 |
| B | 0 | 29 | 0 |
| C | 0 | 29 | 0 |
| D | 0 | 30 | 0 |
| Quadrant | Total seconds | Saturated seconds | Saturation percentage |
|---|---|---|---|
| A | 4867 | 8 | 0.164372% |
| B | 4867 | 68 | 1.397165% |
| C | 4867 | 26 | 0.534210% |
| D | 4867 | 132 | 2.712143% |
Noise dominated data is calculated using 1-second bins in cleaned event files. If a bin has >2000 counts, and if more than 50% of those come from <1% of pixels, then it is considered to be noise-dominated and hence unusable.
| Quadrant | # 1 sec bins | Bins with >0 counts | Bins with >2000 counts | High rate bins dominated by noise | Noise dominated (total time) | Noise dominated (detector-on time) | Marked lightcurve |
|---|---|---|---|---|---|---|---|
| A | 7018 | 4868 | 5 | 5 | 0.07% | 0.10% | 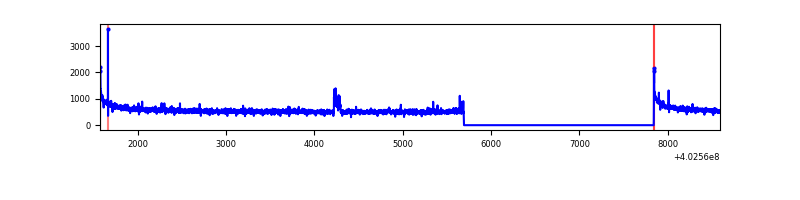 |
| B | 7018 | 4868 | 41 | 41 | 0.58% | 0.84% | 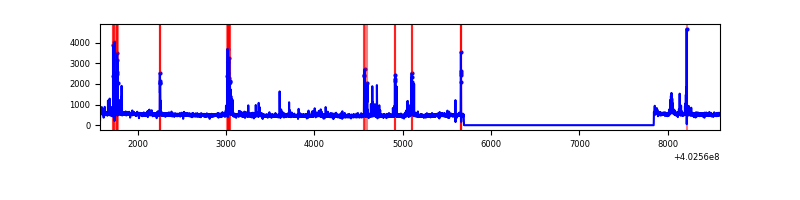 |
| C | 7018 | 4868 | 18 | 18 | 0.26% | 0.37% | 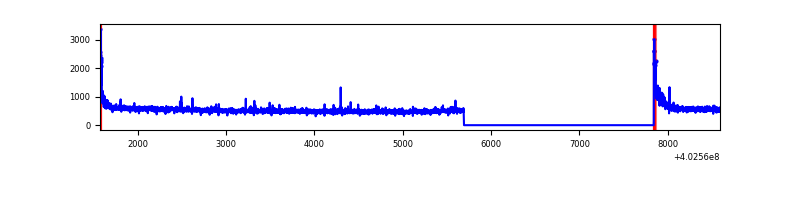 |
| D | 7018 | 4868 | 106 | 106 | 1.51% | 2.18% | 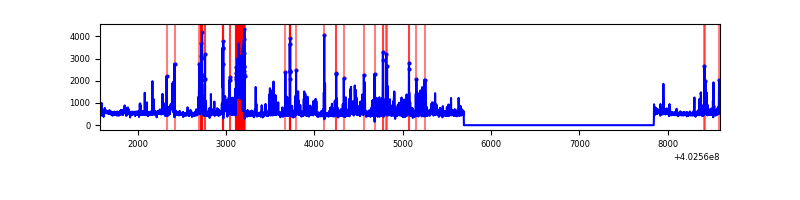 |
Top three noisy pixels from each quadrant. If the there are fewer than three noisy pixels in the level2.evt file, extra rows are filled as -1
| Pixel properties | Quadrant properties | ||||||
|---|---|---|---|---|---|---|---|
| Quadrant | DetID | PixID | Counts | Sigma | Mean | Median | Sigma |
| A | 10 | 83 | 346507 | 2894.04 | 602 | 592 | 119.5 |
| A | 15 | 222 | 30529 | 250.46 | 602 | 592 | 119.5 |
| A | 12 | 189 | 17144 | 138.48 | 602 | 592 | 119.5 |
| B | 5 | 172 | 241868 | 2170.45 | 594 | 579 | 111.2 |
| B | 0 | 230 | 29341 | 258.72 | 594 | 579 | 111.2 |
| B | 4 | 81 | 24598 | 216.06 | 594 | 579 | 111.2 |
| C | 15 | 214 | 211465 | 1554.92 | 589 | 593 | 135.6 |
| C | 0 | 10 | 127149 | 933.19 | 589 | 593 | 135.6 |
| C | 14 | 254 | 18885 | 134.88 | 589 | 593 | 135.6 |
| D | 1 | 52 | 360042 | 2526.87 | 586 | 571 | 142.3 |
| D | 2 | 249 | 211943 | 1485.82 | 586 | 571 | 142.3 |
| D | 12 | 233 | 86341 | 602.91 | 586 | 571 | 142.3 |
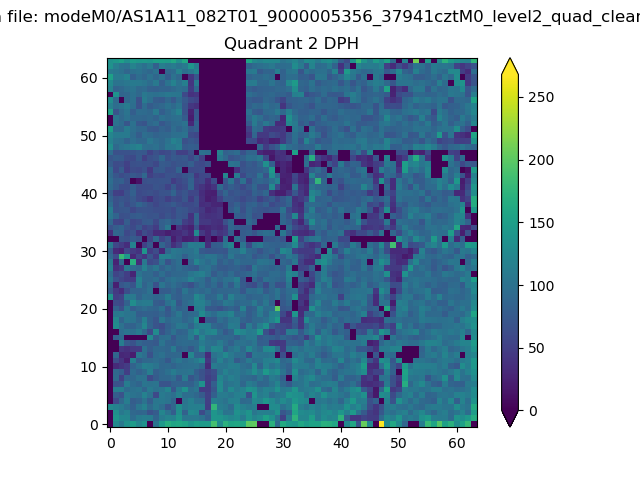
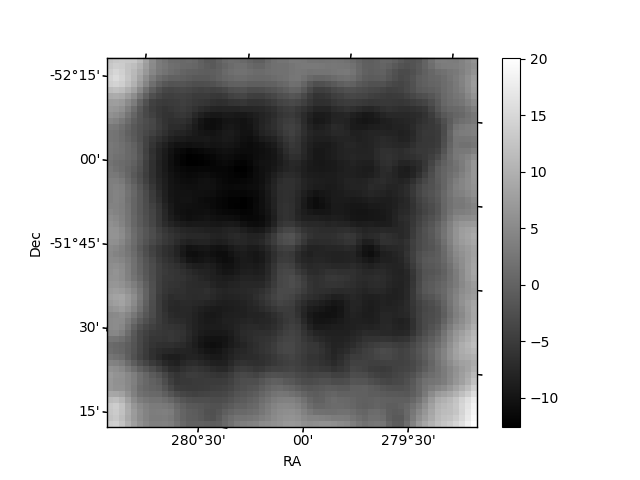
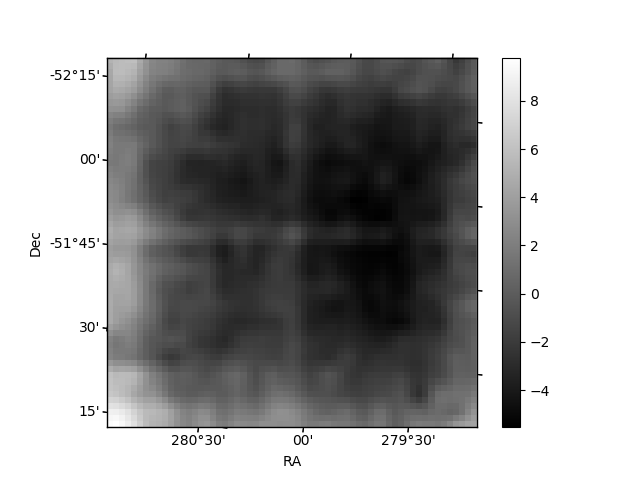
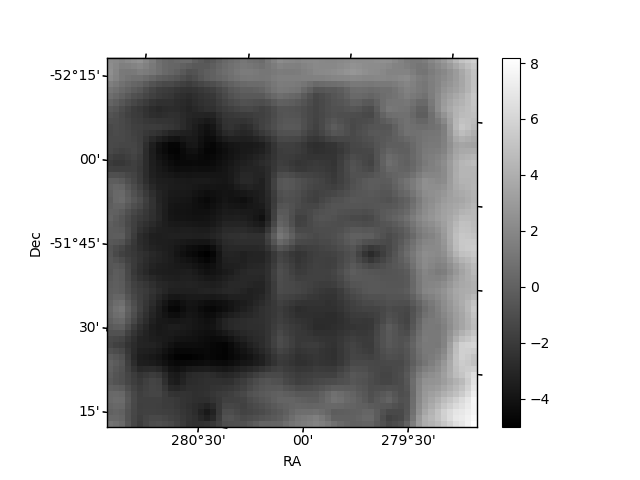
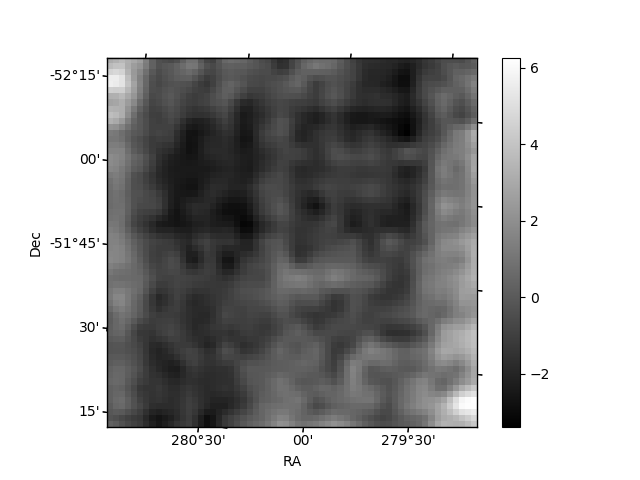
Histogram calculated using DETX and DETY for each event in the final _common_clean file
| Quadrant A | 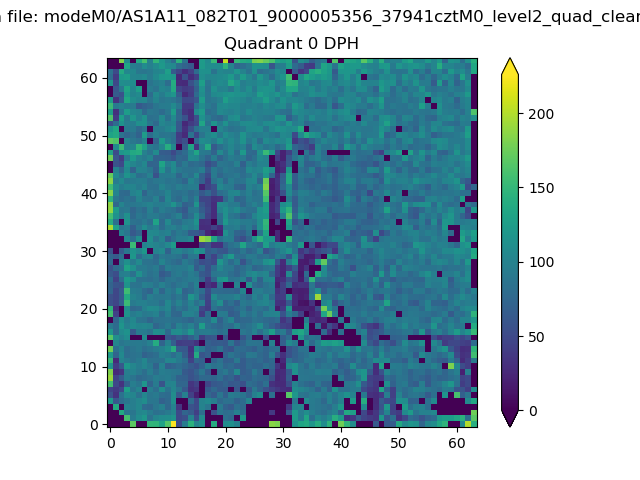 |
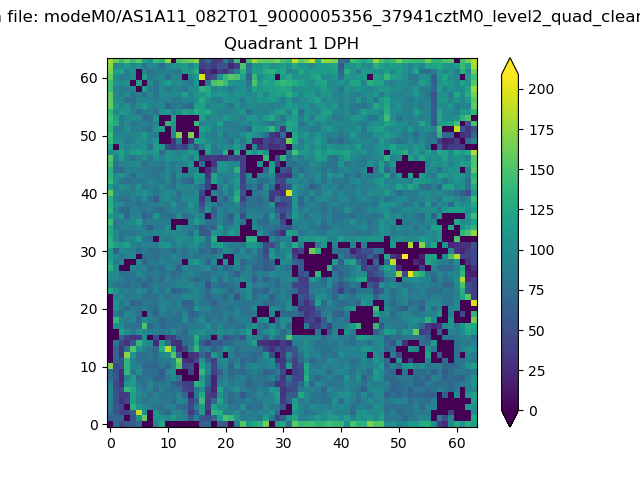 |
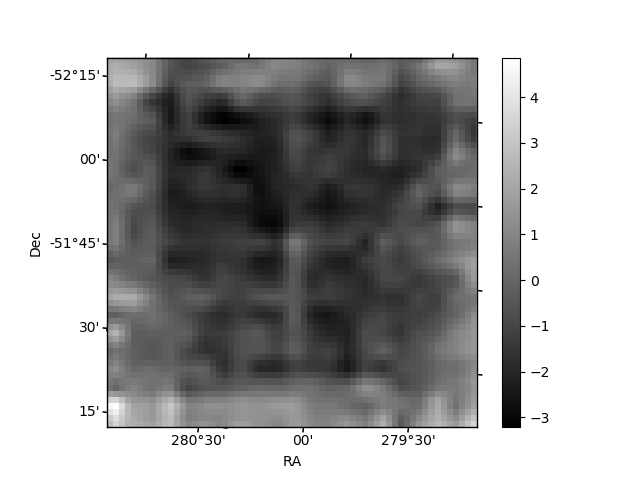
Quadrant B |
|---|---|---|---|
| Quadrant D | 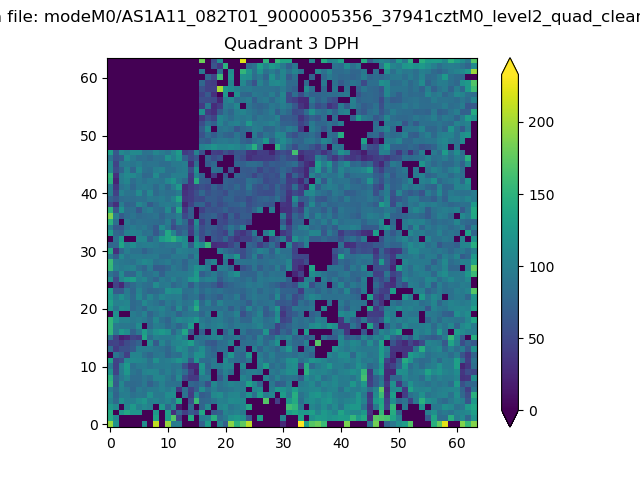 |
 |
Quadrant C |
| Plot type | Count rate plots | Images |
|---|---|---|
| Comparison with Poisson distribution Blue bars denote a histogram of data divided into 1 sec bins. Red curve is a Poisson curve with rate = median count rate of data. |
 |
 |
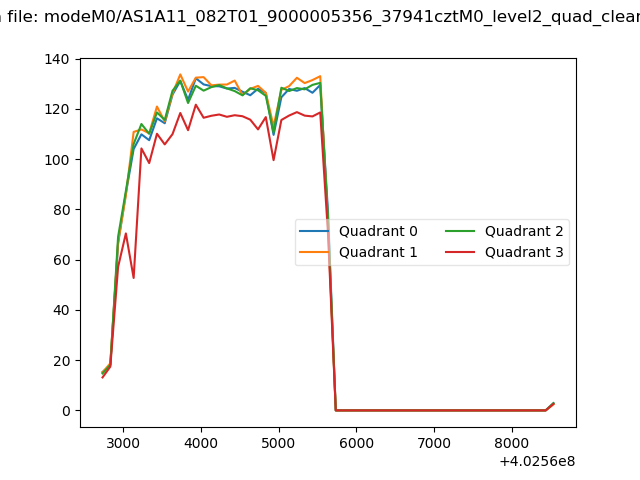
| Quadrant-wise count rates Data is divided into 100 sec bins |
 |
|
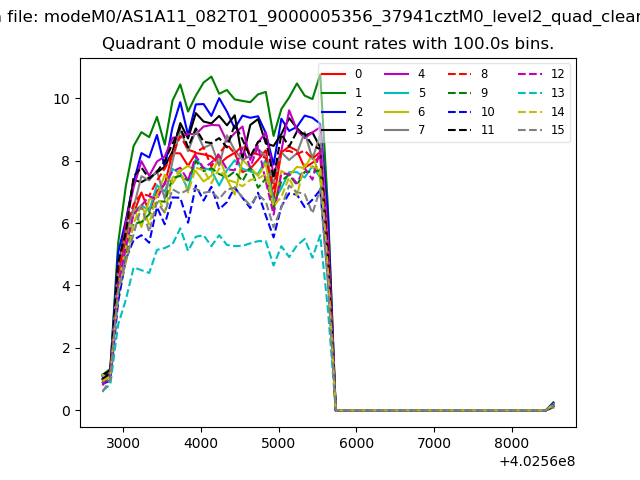
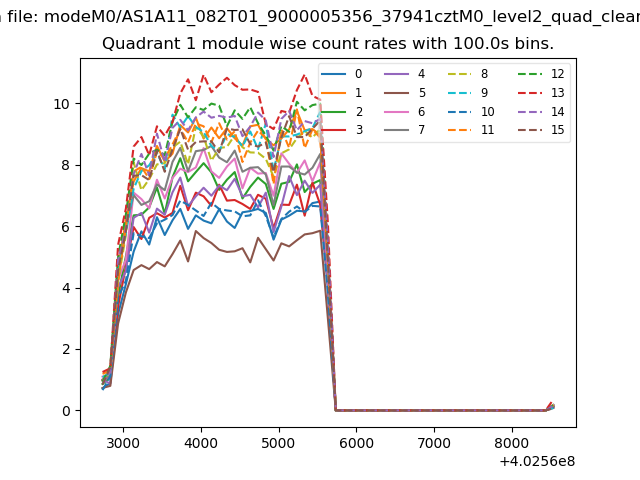
| Module-wise count rates for Quadrant A Data is divided into 100 sec bins |
 |
 |
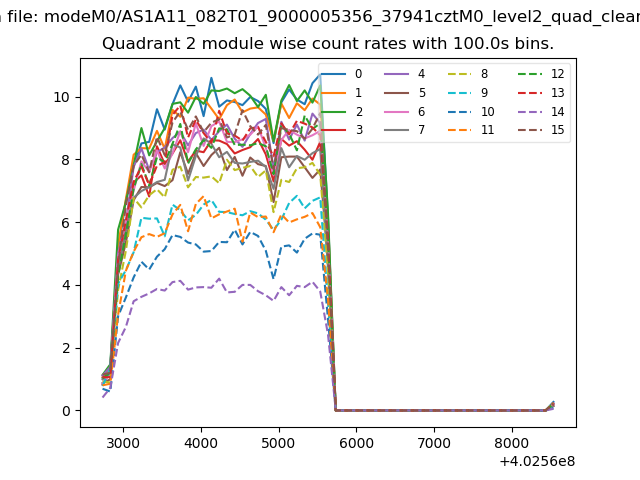
| Module-wise count rates for Quadrant B Data is divided into 100 sec bins |
 |
 |
| Module-wise count rates for Quadrant C Data is divided into 100 sec bins |
 |
 |
| Module-wise count rates for Quadrant D Data is divided into 100 sec bins |
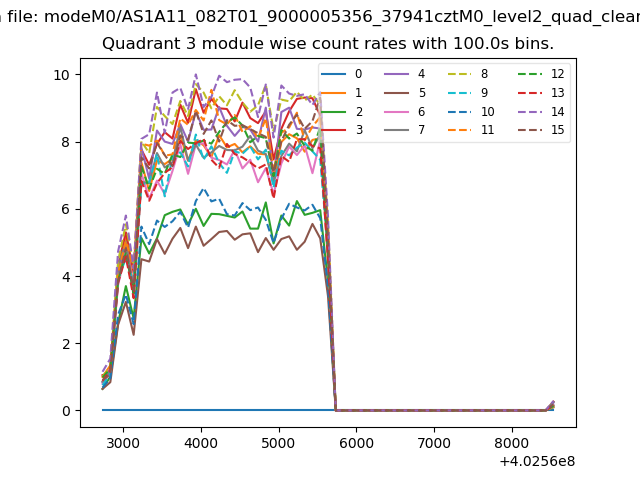 |
 |
| Parameter | Plot |
|---|---|
| CZT HV Monitor | 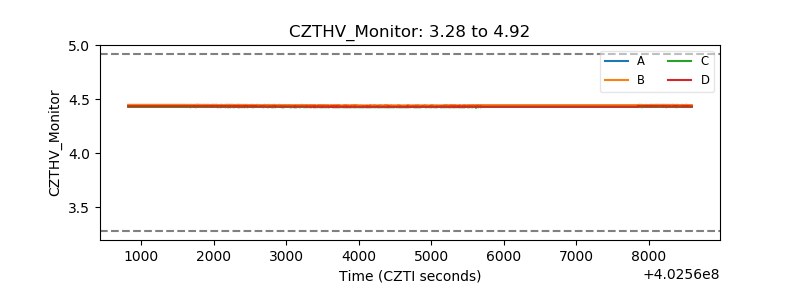 |
| D_VDD | 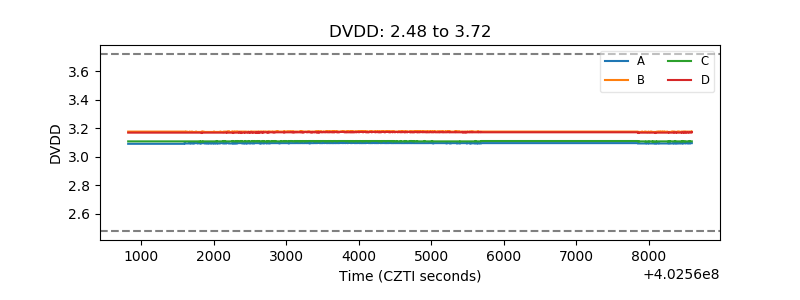 |
| Temperature 1 | 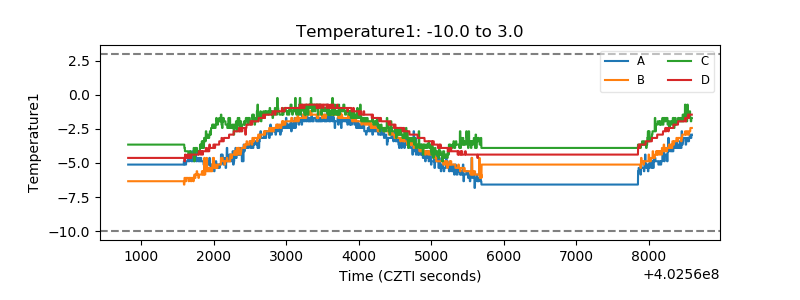 |
| Veto HV Monitor | 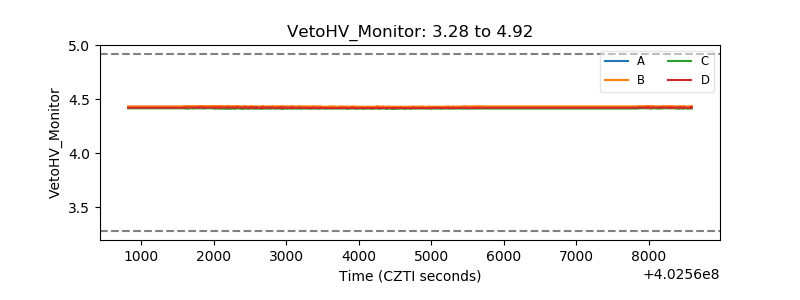 |
| Veto LLD | 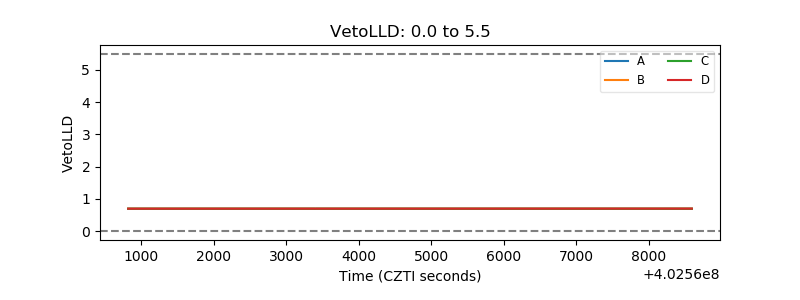 |
| Alpha Counter | 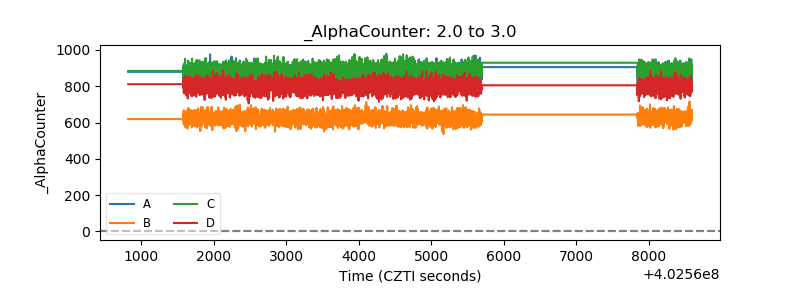 |
| _CPM_Rate | 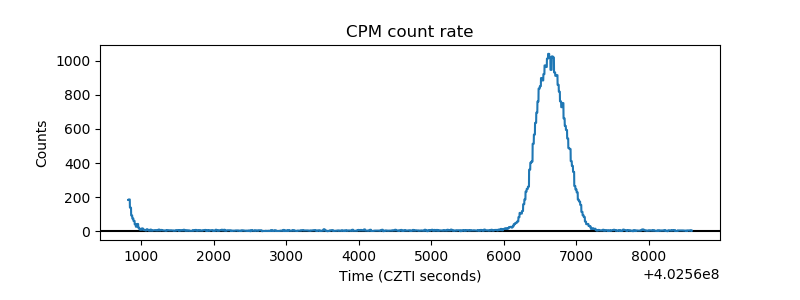 |
| CZT Counter | 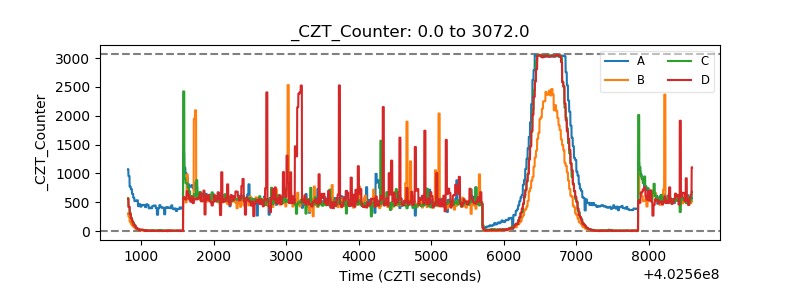 |
| +2.5 Volts monitor | 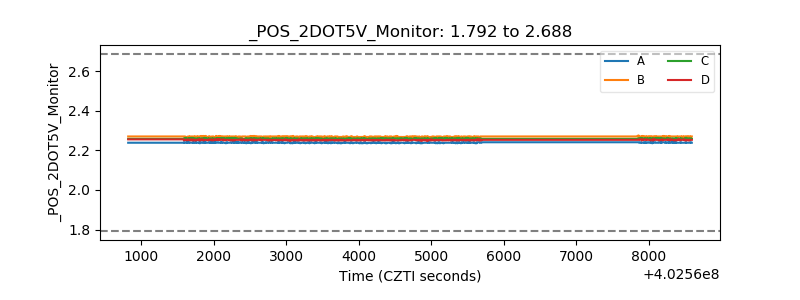 |
| +5 Volts monitor | 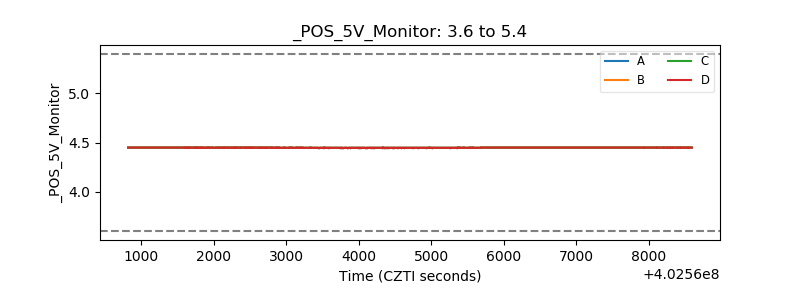 |
| _ROLL_ROT | 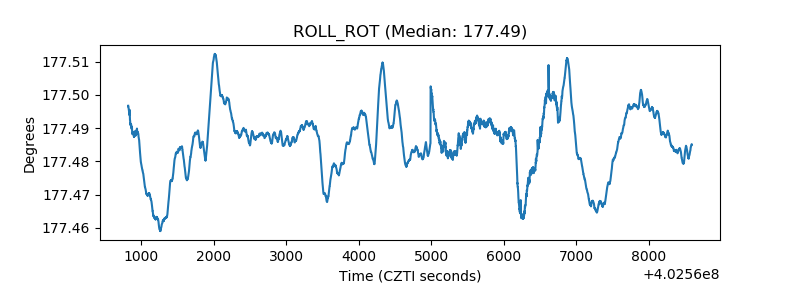 |
| _Roll_DEC | 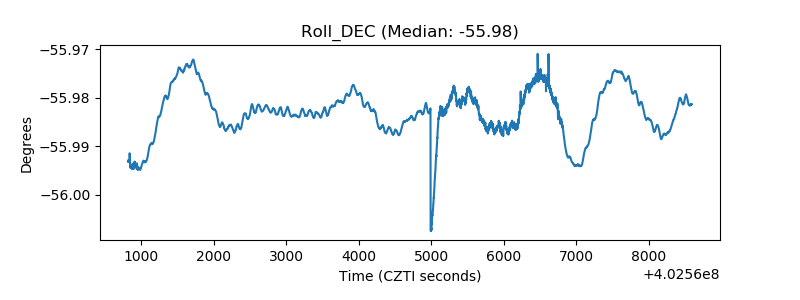 |
| _Roll_RA | 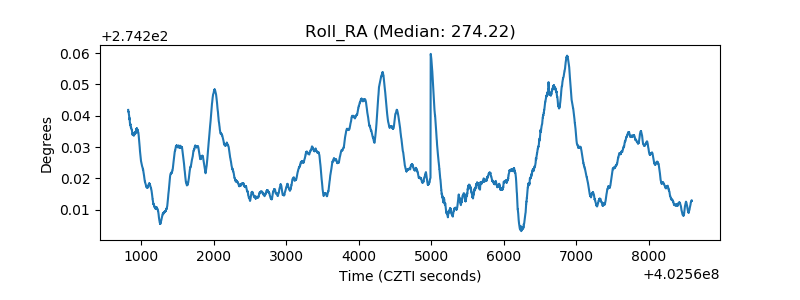 |
| Veto Counter | 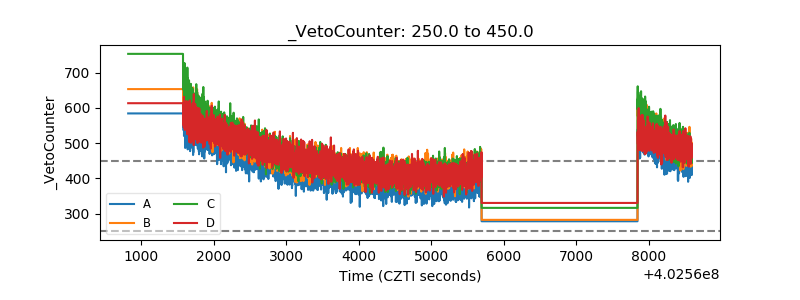 |