| Param | Original file | Final file |
|---|---|---|
| Filename | modeM0/AS1A11_082T01_9000005356_37942cztM0_level2.evt | modeM0/AS1A11_082T01_9000005356_37942cztM0_level2_quad_clean.evt |
| Size (bytes) | 420,298,560 | 97,122,240 |
| Size | 400.8 MB | 92.6 MB |
| Events in quadrant A | 2,607,681 | 655,923 |
| Events in quadrant B | 2,731,180 | 668,071 |
| Events in quadrant C | 2,586,987 | 675,112 |
| Events in quadrant D | 4,473,476 | 601,848 |
| Mode M0 | |||
|---|---|---|---|
| Quadrant | BADHDUFLAG | Total packets | Discarded packets |
| A | 0 | 10601 | 3 |
| B | 0 | 11088 | 2 |
| C | 0 | 10539 | 2 |
| D | 0 | 16500 | 2 |
| Mode SS | |||
|---|---|---|---|
| Quadrant | BADHDUFLAG | Total packets | Discarded packets |
| A | 0 | 100 | 0 |
| B | 0 | 100 | 0 |
| C | 0 | 100 | 0 |
| D | 0 | 100 | 0 |
| Mode M9 | |||
|---|---|---|---|
| Quadrant | BADHDUFLAG | Total packets | Discarded packets |
| A | 0 | 21 | 0 |
| B | 0 | 21 | 0 |
| C | 0 | 21 | 0 |
| D | 0 | 21 | 0 |
| Quadrant | Total seconds | Saturated seconds | Saturation percentage |
|---|---|---|---|
| A | 4847 | 7 | 0.144419% |
| B | 4847 | 88 | 1.815556% |
| C | 4847 | 23 | 0.474520% |
| D | 4848 | 488 | 10.066007% |
Noise dominated data is calculated using 1-second bins in cleaned event files. If a bin has >2000 counts, and if more than 50% of those come from <1% of pixels, then it is considered to be noise-dominated and hence unusable.
| Quadrant | # 1 sec bins | Bins with >0 counts | Bins with >2000 counts | High rate bins dominated by noise | Noise dominated (total time) | Noise dominated (detector-on time) | Marked lightcurve |
|---|---|---|---|---|---|---|---|
| A | 6999 | 4848 | 4 | 4 | 0.06% | 0.08% | 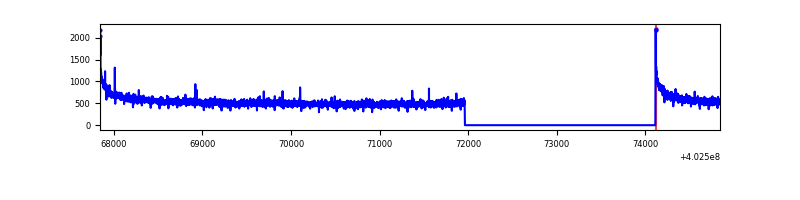 |
| B | 6999 | 4848 | 63 | 63 | 0.90% | 1.30% | 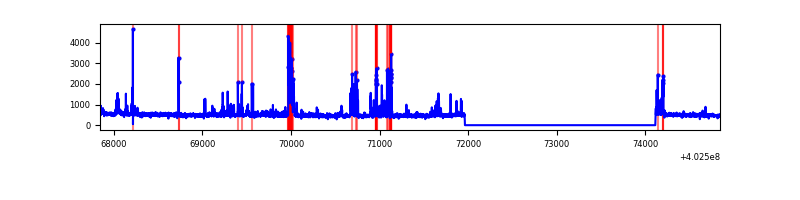 |
| C | 6999 | 4848 | 15 | 15 | 0.21% | 0.31% | 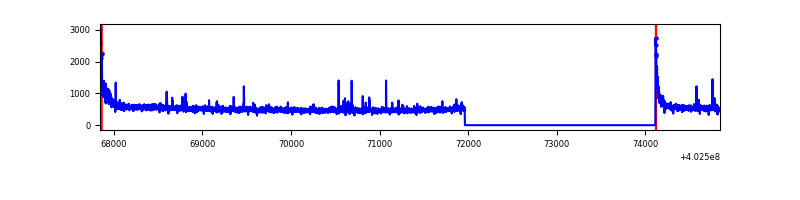 |
| D | 7000 | 4849 | 451 | 451 | 6.44% | 9.30% | 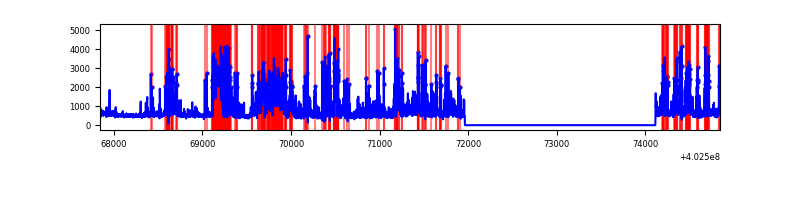 |
Top three noisy pixels from each quadrant. If the there are fewer than three noisy pixels in the level2.evt file, extra rows are filled as -1
| Pixel properties | Quadrant properties | ||||||
|---|---|---|---|---|---|---|---|
| Quadrant | DetID | PixID | Counts | Sigma | Mean | Median | Sigma |
| A | 10 | 83 | 347788 | 3035.07 | 576 | 567 | 114.4 |
| A | 12 | 189 | 13487 | 112.93 | 576 | 567 | 114.4 |
| A | 13 | 6 | 10311 | 85.17 | 576 | 567 | 114.4 |
| B | 5 | 172 | 357350 | 3320.98 | 568 | 554 | 107.4 |
| B | 4 | 81 | 61311 | 565.51 | 568 | 554 | 107.4 |
| B | 0 | 230 | 52654 | 484.94 | 568 | 554 | 107.4 |
| C | 15 | 214 | 210199 | 1638.52 | 560 | 565 | 127.9 |
| C | 0 | 10 | 138389 | 1077.25 | 560 | 565 | 127.9 |
| C | 14 | 254 | 45505 | 351.26 | 560 | 565 | 127.9 |
| D | 1 | 52 | 1078790 | 8163.43 | 541 | 524 | 132.1 |
| D | 12 | 233 | 1042155 | 7886.07 | 541 | 524 | 132.1 |
| D | 10 | 118 | 88579 | 666.65 | 541 | 524 | 132.1 |
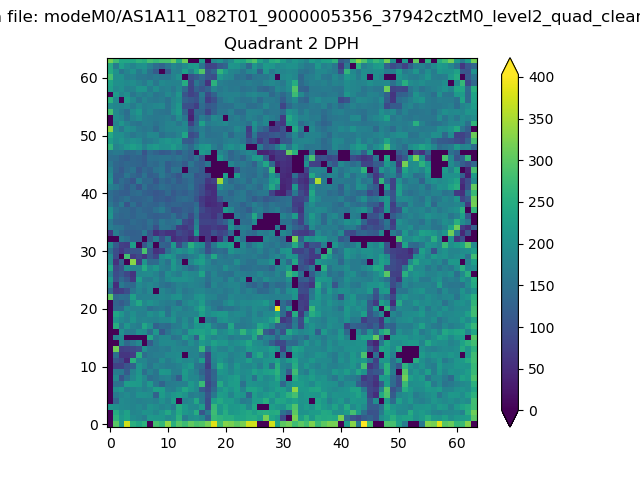
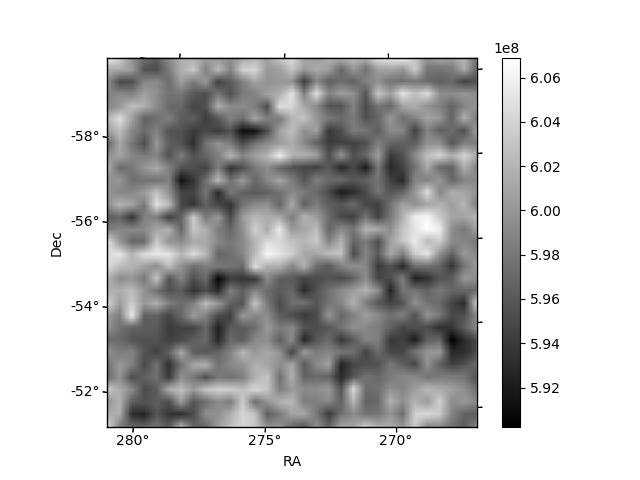
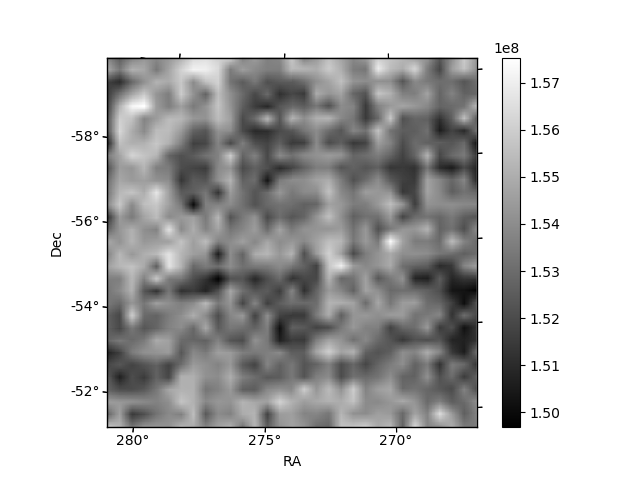
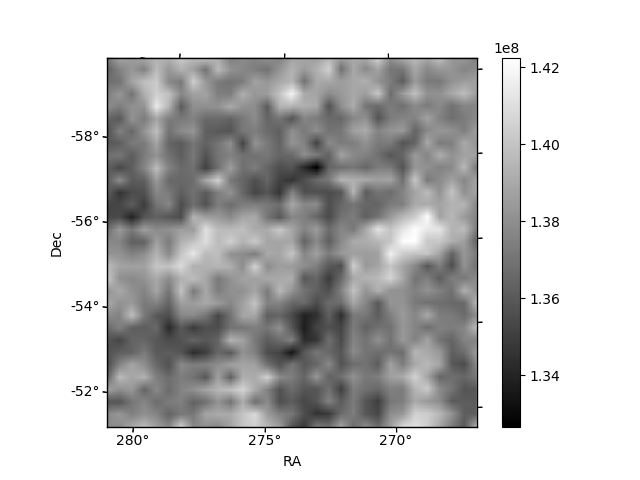
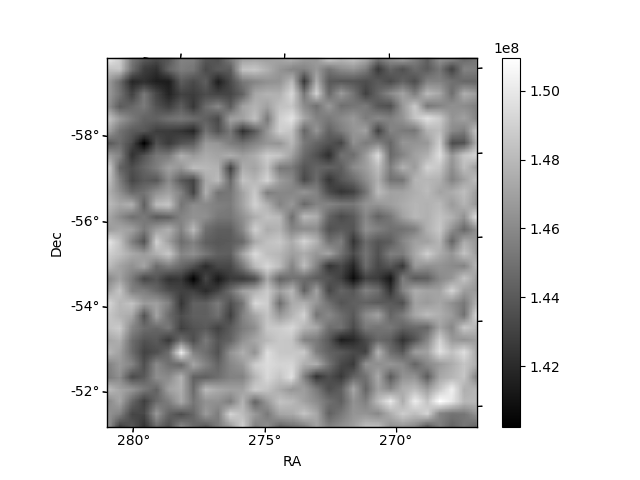
Histogram calculated using DETX and DETY for each event in the final _common_clean file
| Quadrant A | 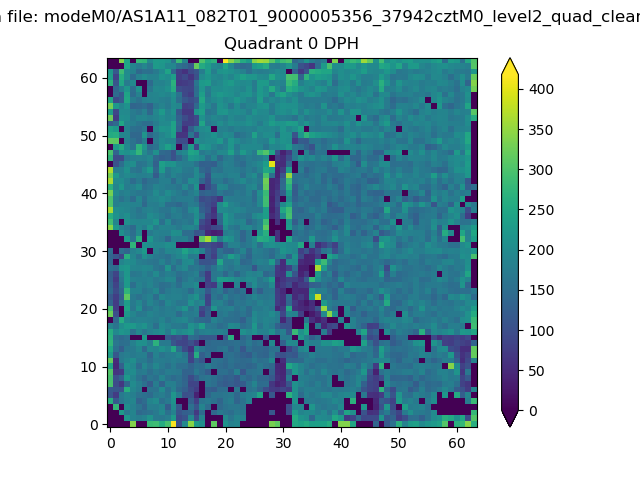 |
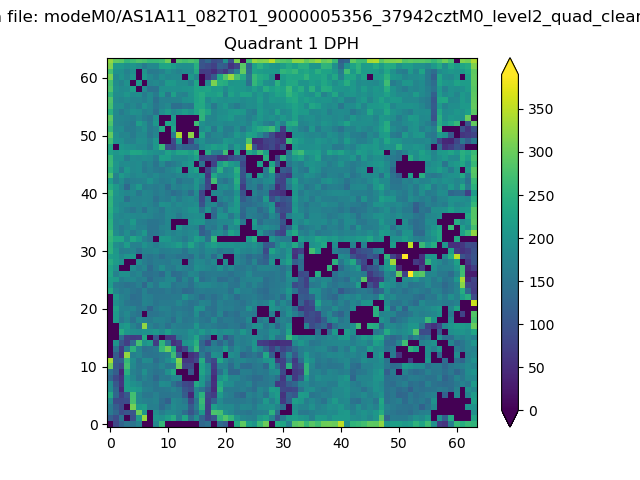 |
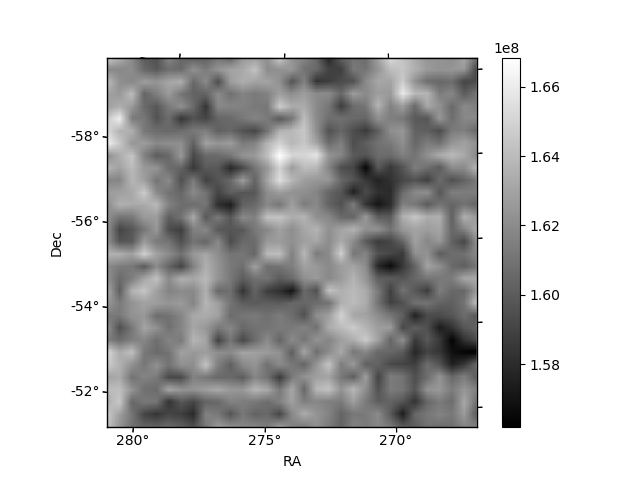
Quadrant B |
|---|---|---|---|
| Quadrant D | 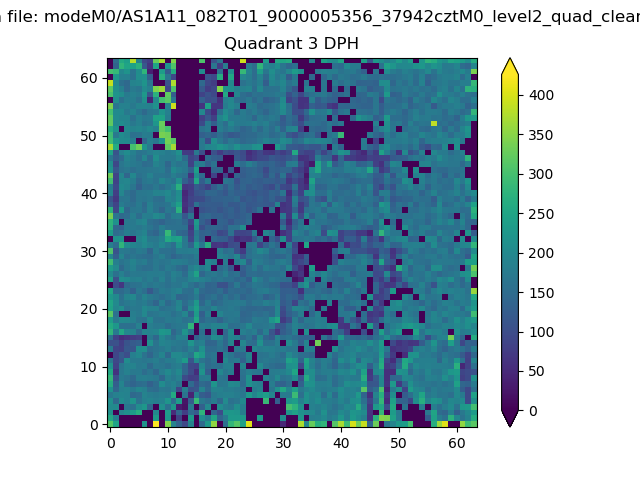 |
 |
Quadrant C |
| Plot type | Count rate plots | Images |
|---|---|---|
| Comparison with Poisson distribution Blue bars denote a histogram of data divided into 1 sec bins. Red curve is a Poisson curve with rate = median count rate of data. |
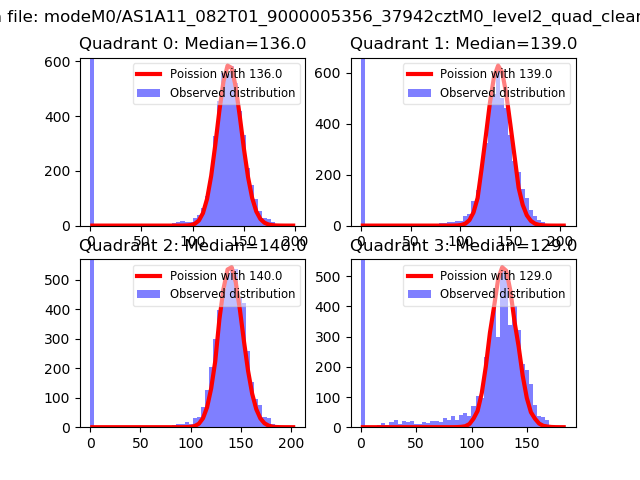 |
 |
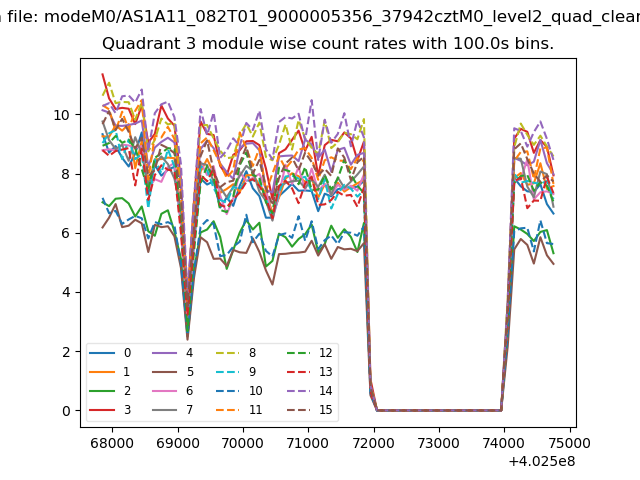
| Quadrant-wise count rates Data is divided into 100 sec bins |
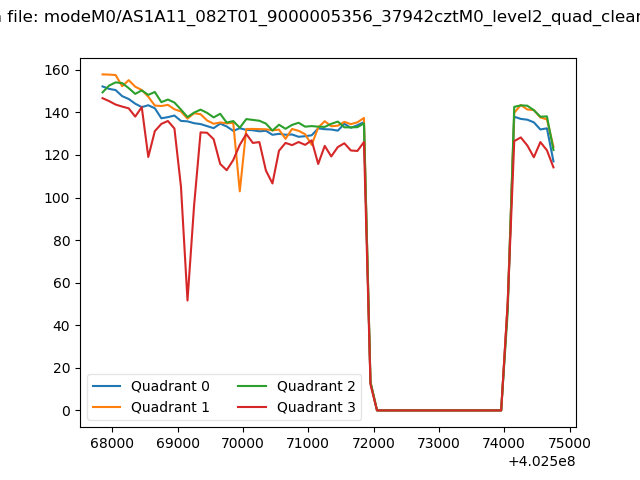 |
|
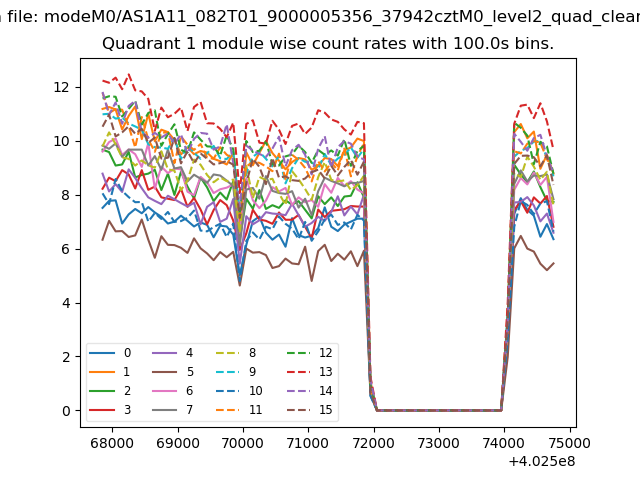
| Module-wise count rates for Quadrant A Data is divided into 100 sec bins |
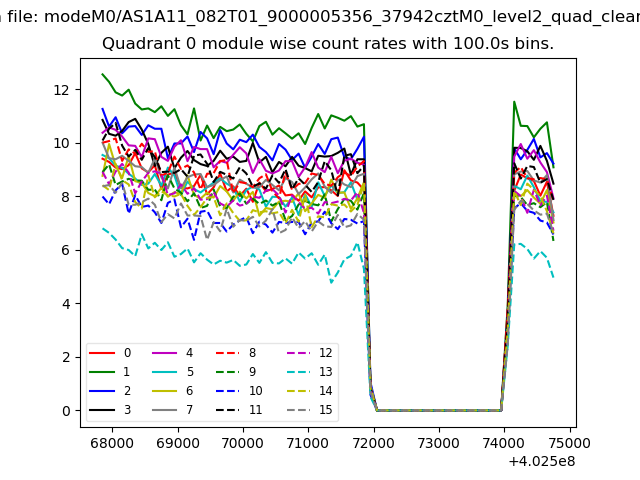 |
 |
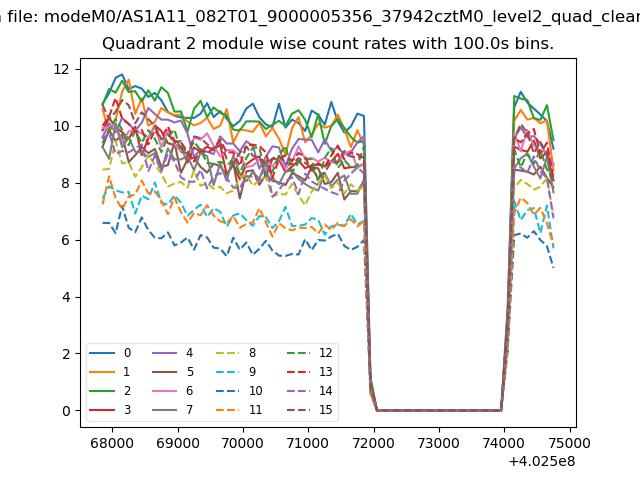
| Module-wise count rates for Quadrant B Data is divided into 100 sec bins |
 |
 |
| Module-wise count rates for Quadrant C Data is divided into 100 sec bins |
 |
 |
| Module-wise count rates for Quadrant D Data is divided into 100 sec bins |
 |
 |
| Parameter | Plot |
|---|---|
| CZT HV Monitor | 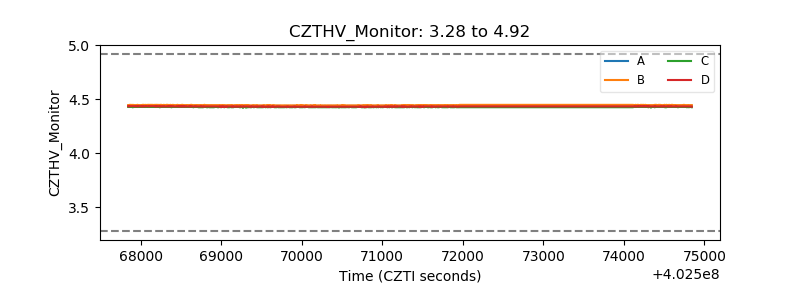 |
| D_VDD | 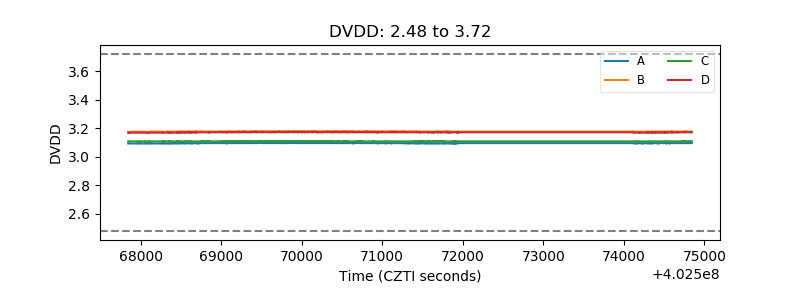 |
| Temperature 1 | 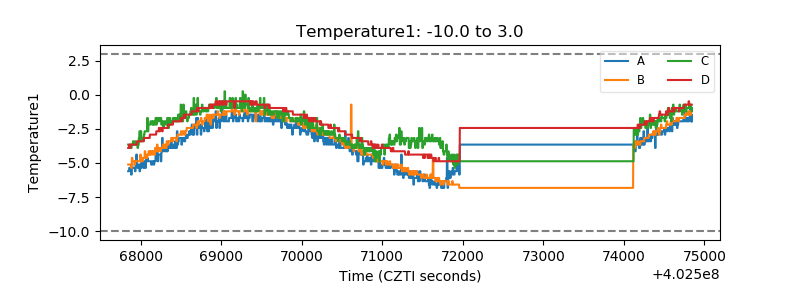 |
| Veto HV Monitor | 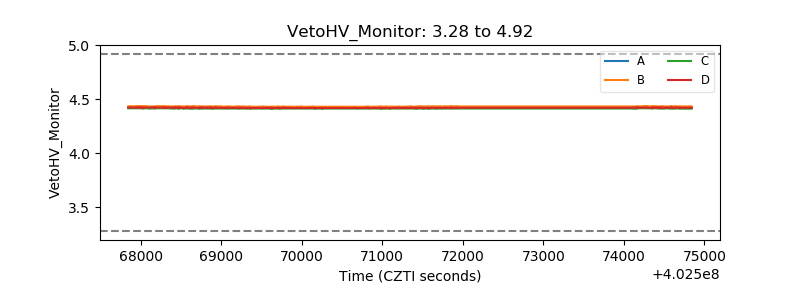 |
| Veto LLD | 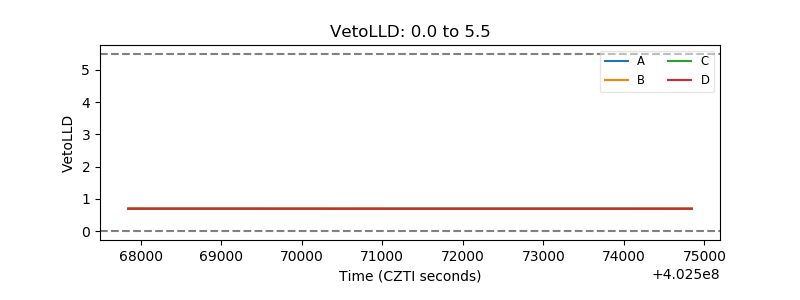 |
| Alpha Counter | 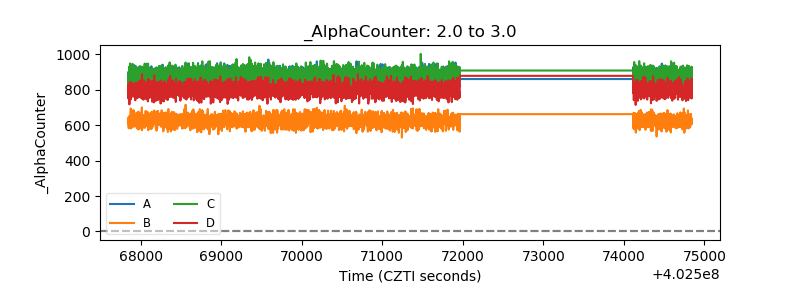 |
| _CPM_Rate | 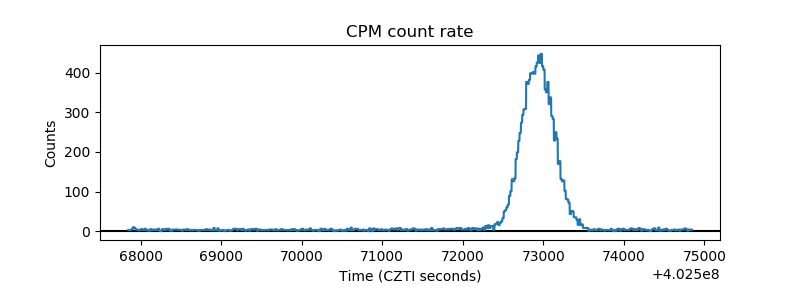 |
| CZT Counter | 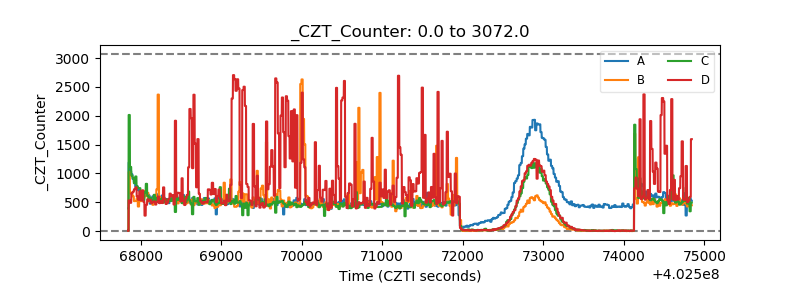 |
| +2.5 Volts monitor | 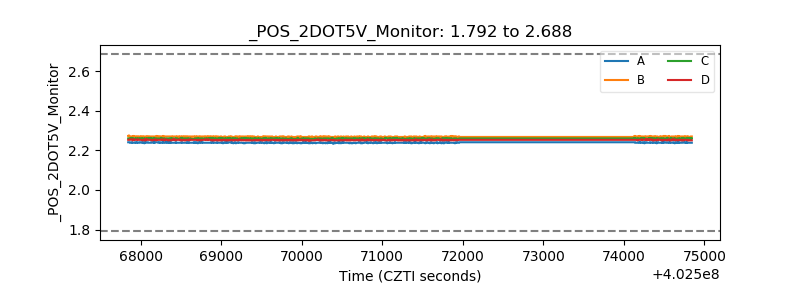 |
| +5 Volts monitor | 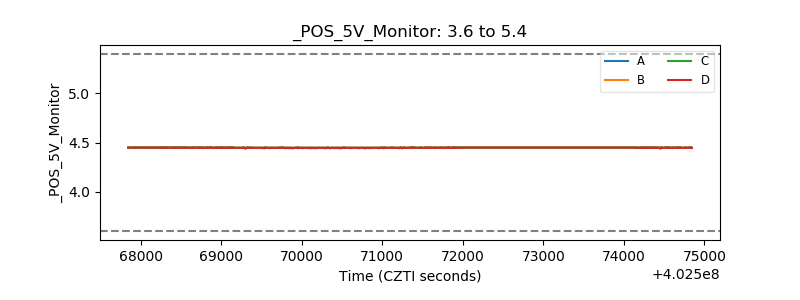 |
| _ROLL_ROT | 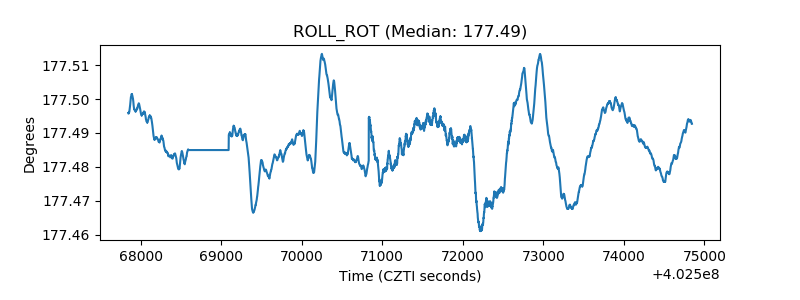 |
| _Roll_DEC | 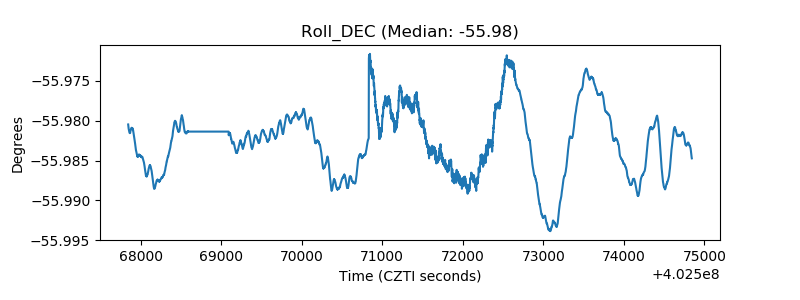 |
| _Roll_RA | 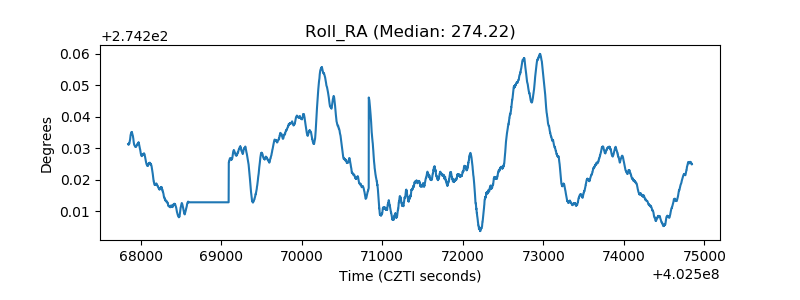 |
| Veto Counter | 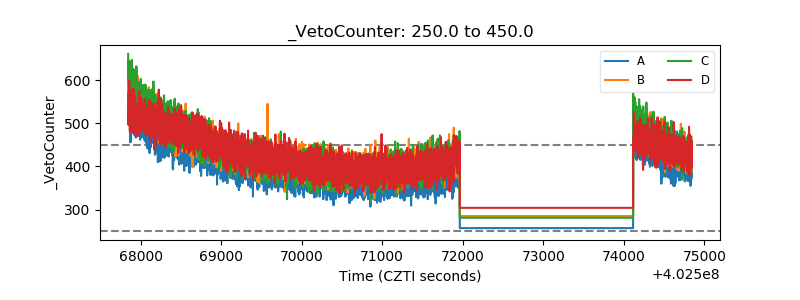 |