| Param | Original file | Final file |
|---|---|---|
| Filename | modeM0/AS1A11_082T01_9000005356_37943cztM0_level2.evt | modeM0/AS1A11_082T01_9000005356_37943cztM0_level2_quad_clean.evt |
| Size (bytes) | 441,311,040 | 93,885,120 |
| Size | 420.9 MB | 89.5 MB |
| Events in quadrant A | 2,839,913 | 621,205 |
| Events in quadrant B | 2,878,348 | 629,161 |
| Events in quadrant C | 2,703,354 | 638,210 |
| Events in quadrant D | 4,579,305 | 579,059 |
| Mode M0 | |||
|---|---|---|---|
| Quadrant | BADHDUFLAG | Total packets | Discarded packets |
| A | 0 | 11601 | 3 |
| B | 0 | 12042 | 2 |
| C | 0 | 11322 | 2 |
| D | 0 | 17231 | 2 |
| Mode SS | |||
|---|---|---|---|
| Quadrant | BADHDUFLAG | Total packets | Discarded packets |
| A | 0 | 110 | 0 |
| B | 0 | 110 | 0 |
| C | 0 | 110 | 0 |
| D | 0 | 110 | 0 |
| Mode M9 | |||
|---|---|---|---|
| Quadrant | BADHDUFLAG | Total packets | Discarded packets |
| A | 0 | 29 | 0 |
| B | 0 | 29 | 0 |
| C | 0 | 29 | 0 |
| D | 0 | 30 | 0 |
| Quadrant | Total seconds | Saturated seconds | Saturation percentage |
|---|---|---|---|
| A | 5361 | 17 | 0.317105% |
| B | 5361 | 53 | 0.988622% |
| C | 5361 | 19 | 0.354411% |
| D | 5361 | 404 | 7.535907% |
Noise dominated data is calculated using 1-second bins in cleaned event files. If a bin has >2000 counts, and if more than 50% of those come from <1% of pixels, then it is considered to be noise-dominated and hence unusable.
| Quadrant | # 1 sec bins | Bins with >0 counts | Bins with >2000 counts | High rate bins dominated by noise | Noise dominated (total time) | Noise dominated (detector-on time) | Marked lightcurve |
|---|---|---|---|---|---|---|---|
| A | 7364 | 5362 | 8 | 8 | 0.11% | 0.15% | 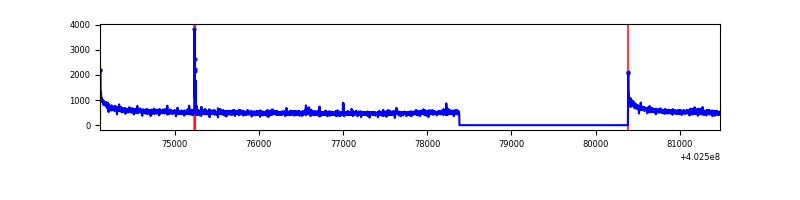 |
| B | 7364 | 5362 | 42 | 42 | 0.57% | 0.78% | 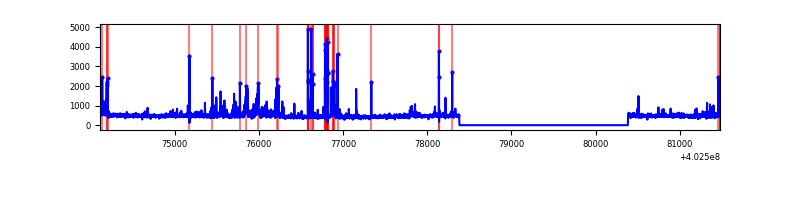 |
| C | 7364 | 5362 | 10 | 10 | 0.14% | 0.19% | 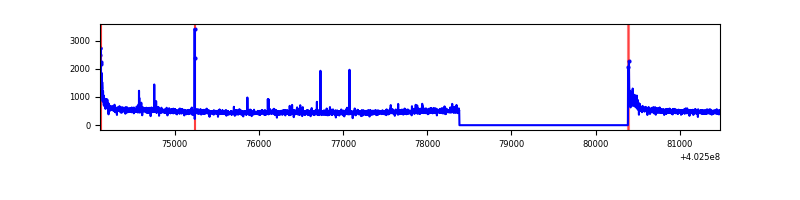 |
| D | 7364 | 5362 | 380 | 380 | 5.16% | 7.09% | 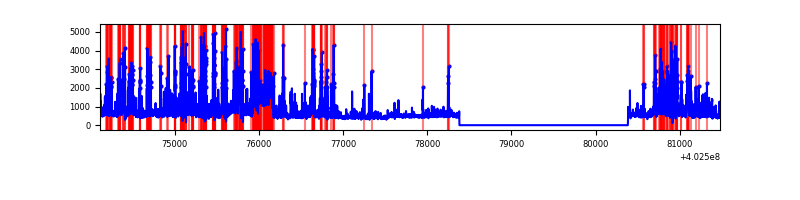 |
Top three noisy pixels from each quadrant. If the there are fewer than three noisy pixels in the level2.evt file, extra rows are filled as -1
| Pixel properties | Quadrant properties | ||||||
|---|---|---|---|---|---|---|---|
| Quadrant | DetID | PixID | Counts | Sigma | Mean | Median | Sigma |
| A | 10 | 83 | 387999 | 3173.02 | 610 | 599 | 122.1 |
| A | 15 | 222 | 31691 | 254.66 | 610 | 599 | 122.1 |
| A | 13 | 248 | 27866 | 223.33 | 610 | 599 | 122.1 |
| B | 5 | 172 | 310521 | 2695.3 | 602 | 587 | 115.0 |
| B | 0 | 230 | 65928 | 568.23 | 602 | 587 | 115.0 |
| B | 0 | 197 | 64337 | 554.39 | 602 | 587 | 115.0 |
| C | 15 | 214 | 228527 | 1660.52 | 590 | 594 | 137.3 |
| C | 0 | 10 | 131805 | 955.89 | 590 | 594 | 137.3 |
| C | 14 | 254 | 32729 | 234.11 | 590 | 594 | 137.3 |
| D | 1 | 52 | 1442068 | 10198.64 | 578 | 561 | 141.3 |
| D | 9 | 49 | 421181 | 2975.88 | 578 | 561 | 141.3 |
| D | 12 | 233 | 114004 | 802.61 | 578 | 561 | 141.3 |
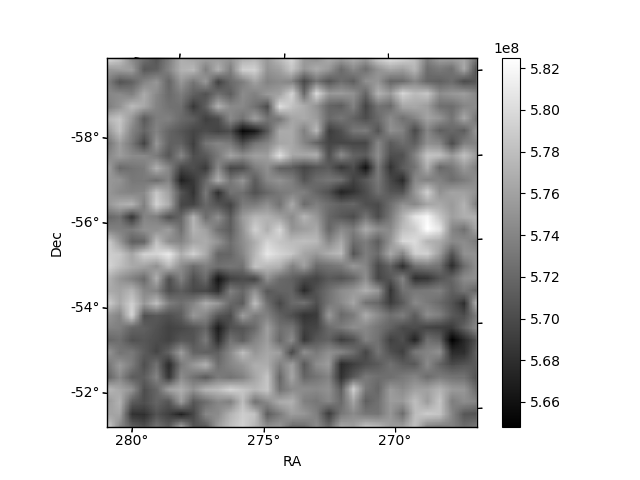
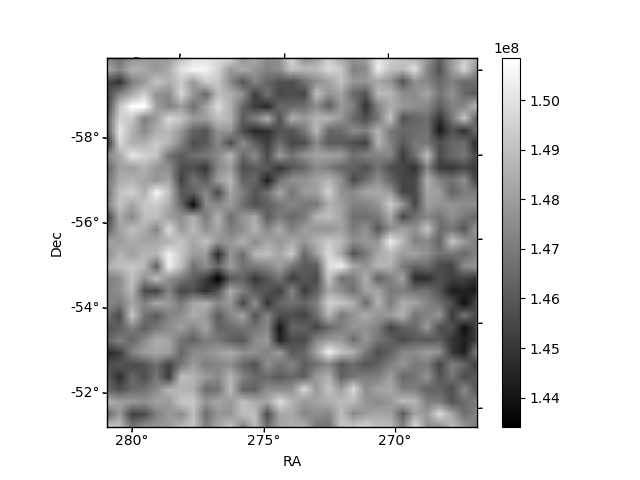
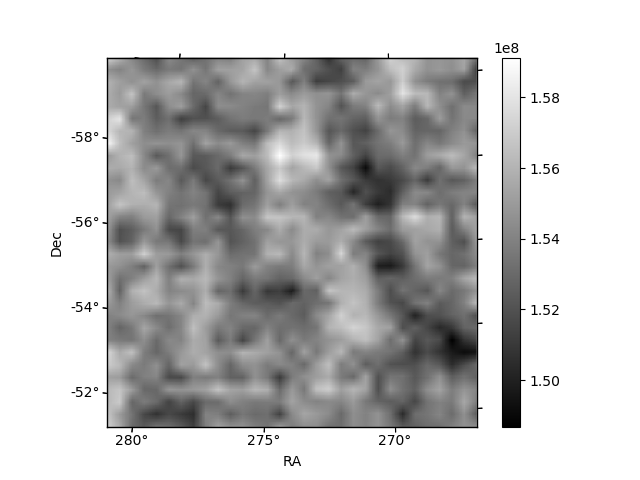
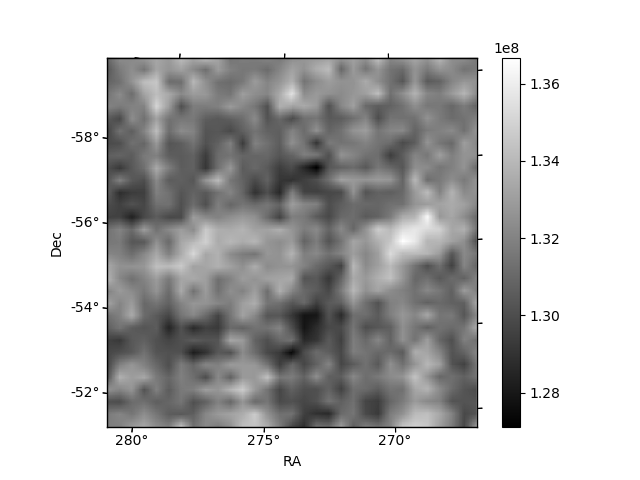
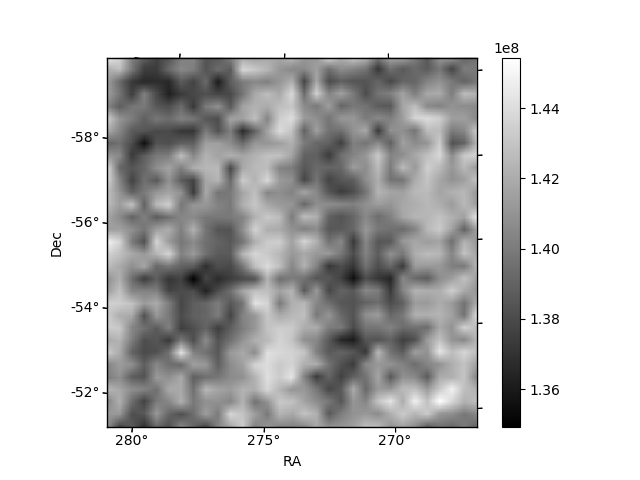
Histogram calculated using DETX and DETY for each event in the final _common_clean file
| Quadrant A | 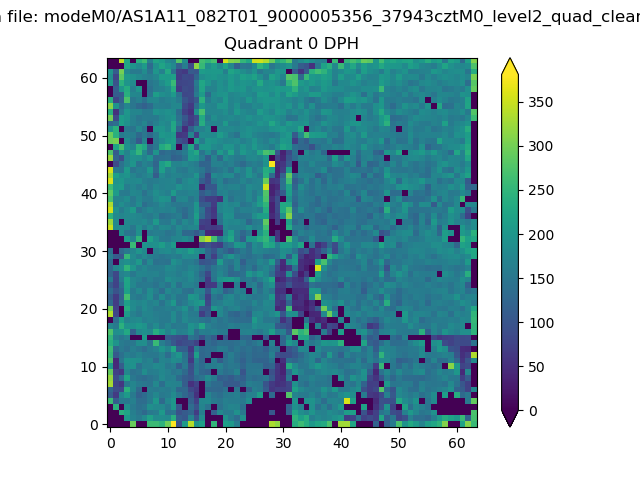 |
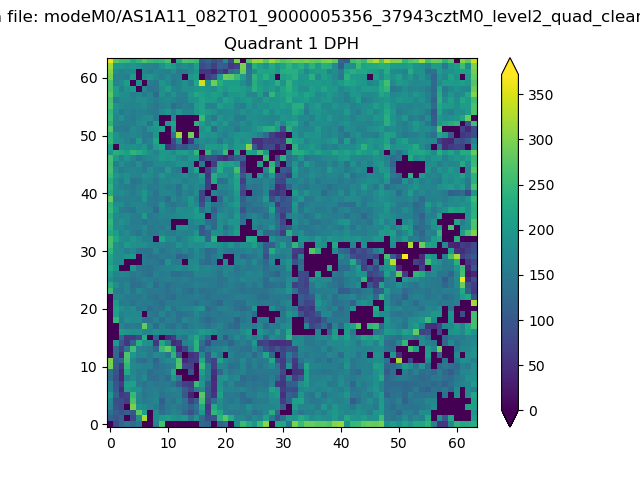 |
Quadrant B |
|---|---|---|---|
| Quadrant D | 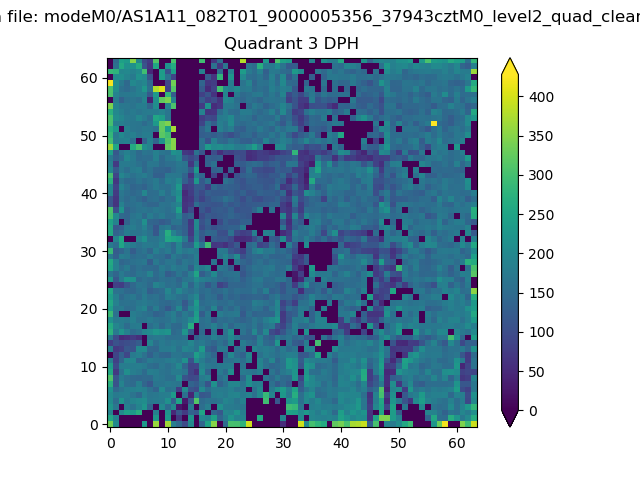 |
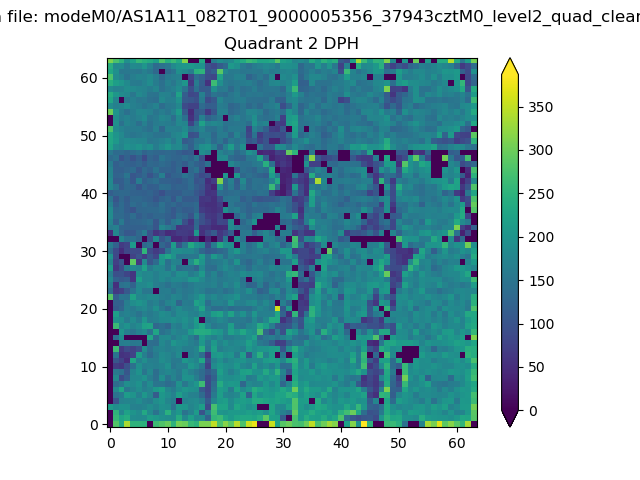 |
Quadrant C |
| Plot type | Count rate plots | Images |
|---|---|---|
| Comparison with Poisson distribution Blue bars denote a histogram of data divided into 1 sec bins. Red curve is a Poisson curve with rate = median count rate of data. |
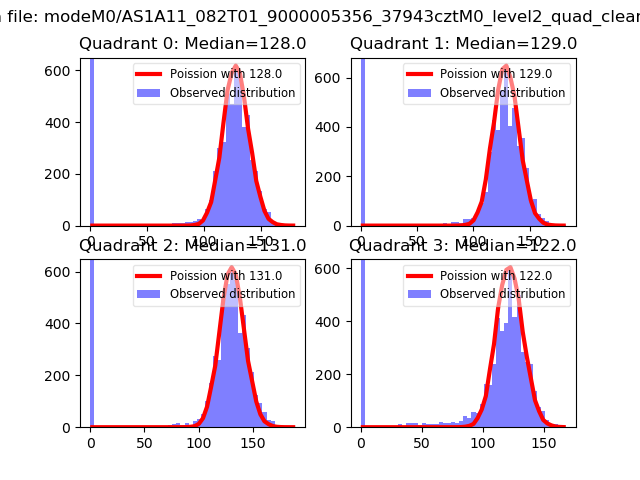 |
 |
| Quadrant-wise count rates Data is divided into 100 sec bins |
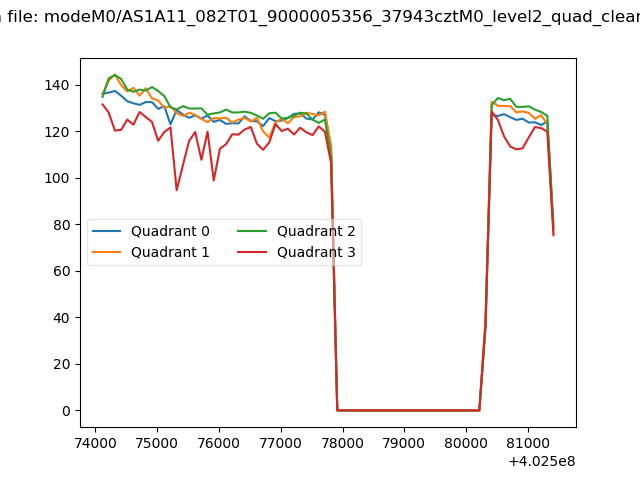 |
|
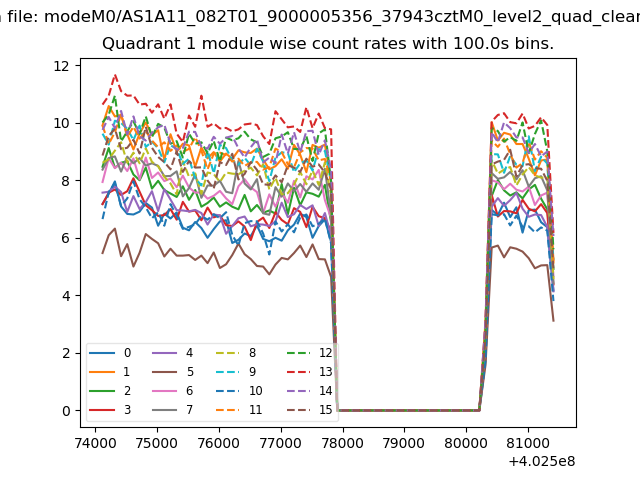
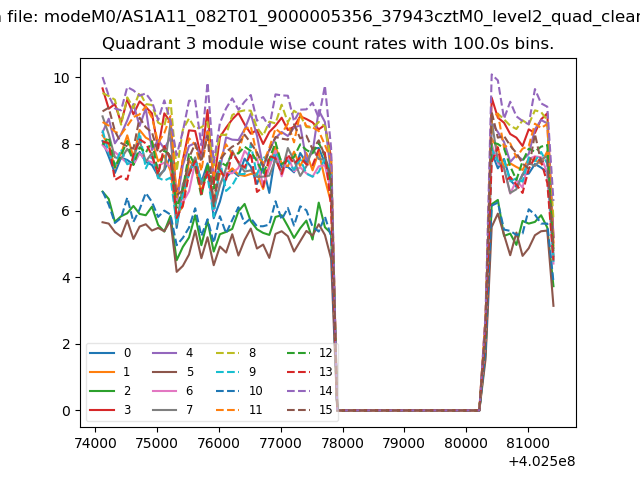
| Module-wise count rates for Quadrant A Data is divided into 100 sec bins |
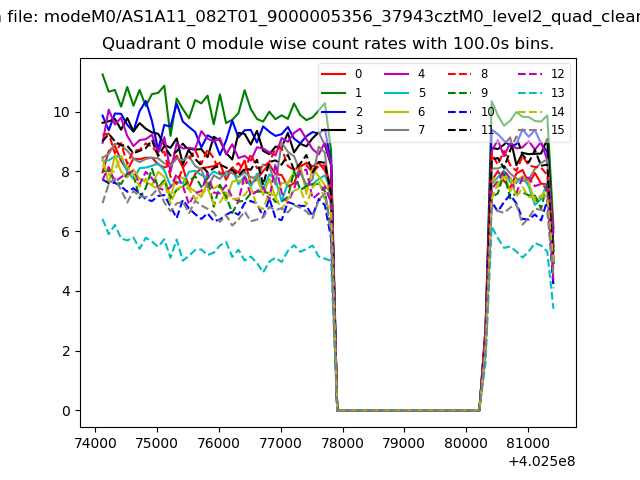 |
 |
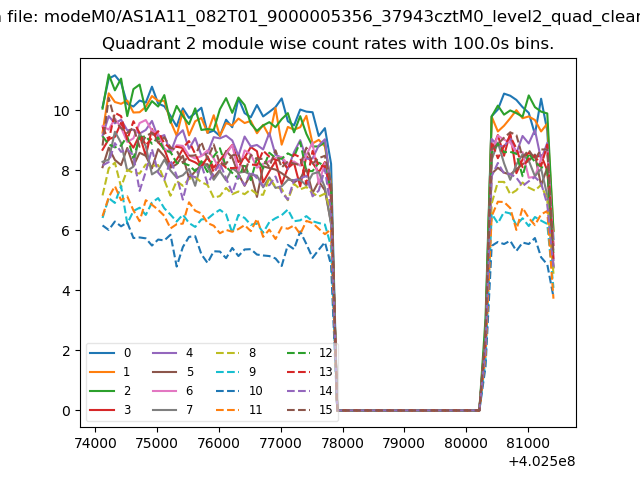
| Module-wise count rates for Quadrant B Data is divided into 100 sec bins |
 |
 |
| Module-wise count rates for Quadrant C Data is divided into 100 sec bins |
 |
 |
| Module-wise count rates for Quadrant D Data is divided into 100 sec bins |
 |
 |
| Parameter | Plot |
|---|---|
| CZT HV Monitor |  |
| D_VDD | 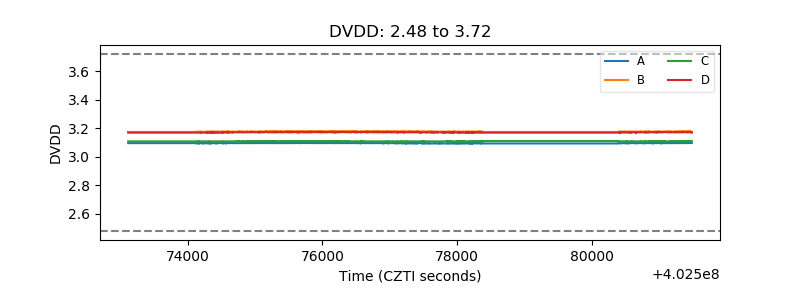 |
| Temperature 1 | 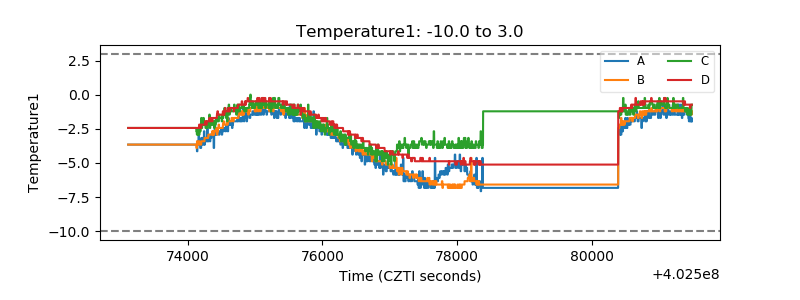 |
| Veto HV Monitor | 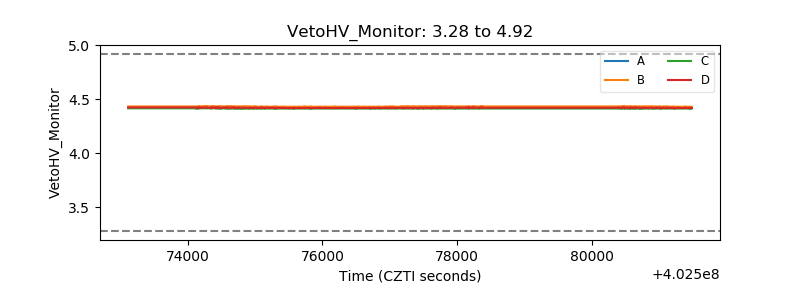 |
| Veto LLD | 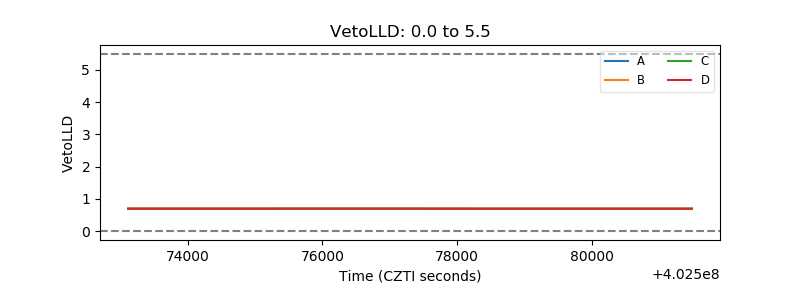 |
| Alpha Counter | 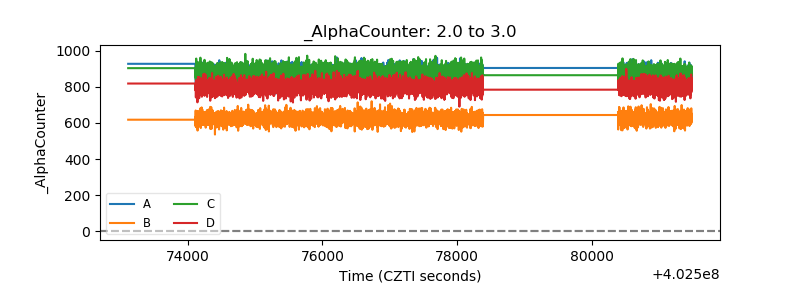 |
| _CPM_Rate | 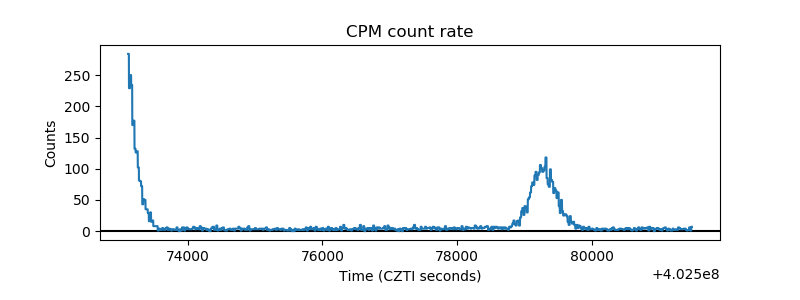 |
| CZT Counter | 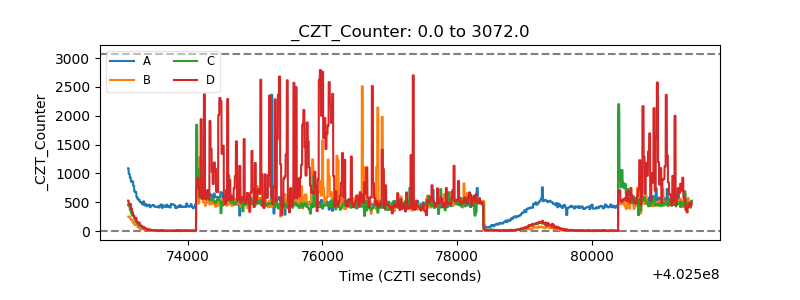 |
| +2.5 Volts monitor | 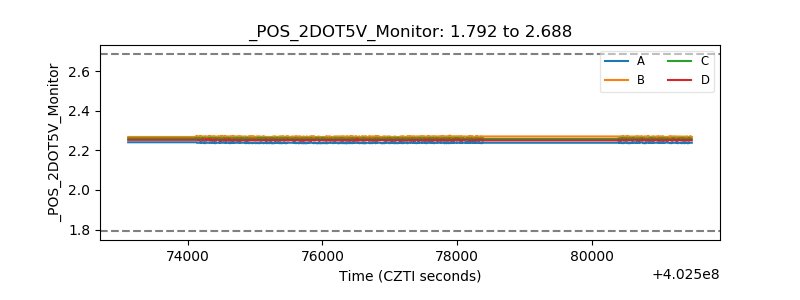 |
| +5 Volts monitor | 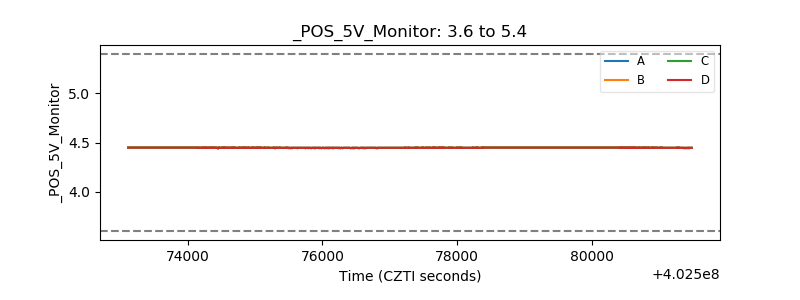 |
| _ROLL_ROT | 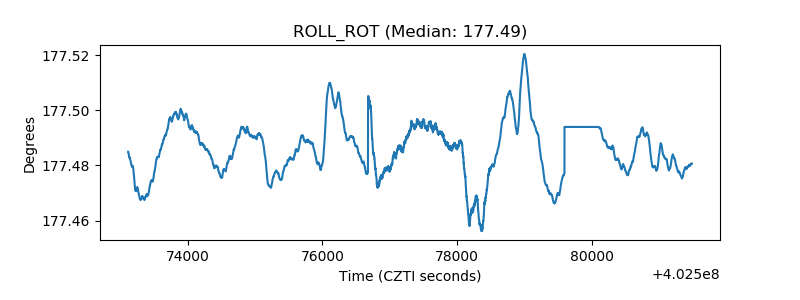 |
| _Roll_DEC | 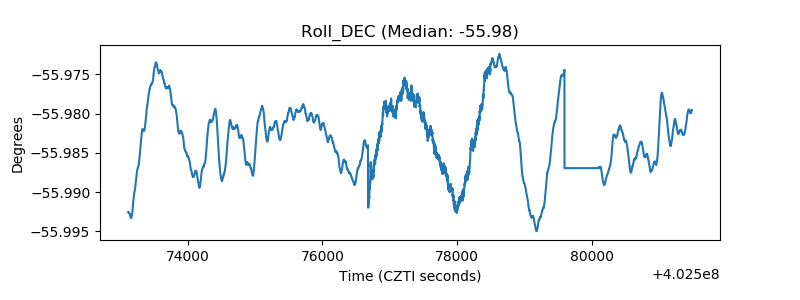 |
| _Roll_RA | 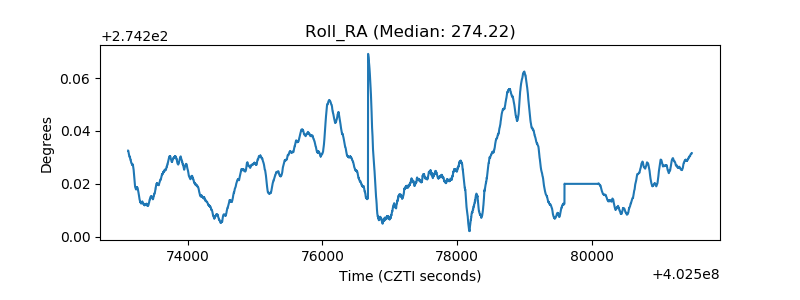 |
| Veto Counter | 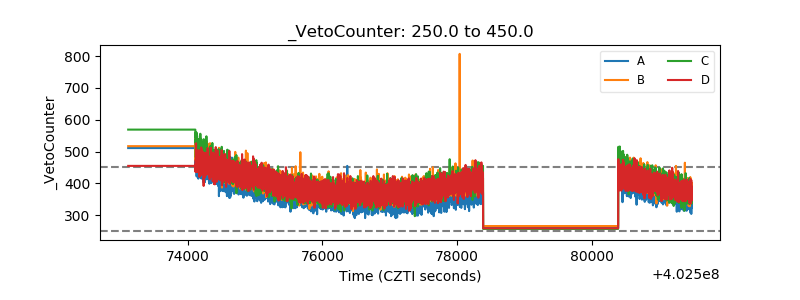 |