| Param | Original file | Final file |
|---|---|---|
| Filename | modeM0/AS1A11_082T01_9000005356_37945cztM0_level2.evt | modeM0/AS1A11_082T01_9000005356_37945cztM0_level2_quad_clean.evt |
| Size (bytes) | 451,376,640 | 79,211,520 |
| Size | 430.5 MB | 75.5 MB |
| Events in quadrant A | 3,051,255 | 499,195 |
| Events in quadrant B | 3,076,494 | 505,152 |
| Events in quadrant C | 2,907,557 | 512,453 |
| Events in quadrant D | 4,239,046 | 474,672 |
| Mode M0 | |||
|---|---|---|---|
| Quadrant | BADHDUFLAG | Total packets | Discarded packets |
| A | 0 | 12575 | 3 |
| B | 0 | 13097 | 2 |
| C | 0 | 12350 | 2 |
| D | 0 | 16508 | 2 |
| Mode SS | |||
|---|---|---|---|
| Quadrant | BADHDUFLAG | Total packets | Discarded packets |
| A | 0 | 120 | 0 |
| B | 0 | 120 | 0 |
| C | 0 | 120 | 0 |
| D | 0 | 120 | 0 |
| Mode M9 | |||
|---|---|---|---|
| Quadrant | BADHDUFLAG | Total packets | Discarded packets |
| A | 0 | 13 | 0 |
| B | 0 | 13 | 0 |
| C | 0 | 13 | 0 |
| D | 0 | 14 | 0 |
| Quadrant | Total seconds | Saturated seconds | Saturation percentage |
|---|---|---|---|
| A | 5820 | 20 | 0.343643% |
| B | 5820 | 83 | 1.426117% |
| C | 5820 | 16 | 0.274914% |
| D | 5820 | 257 | 4.415808% |
Noise dominated data is calculated using 1-second bins in cleaned event files. If a bin has >2000 counts, and if more than 50% of those come from <1% of pixels, then it is considered to be noise-dominated and hence unusable.
| Quadrant | # 1 sec bins | Bins with >0 counts | Bins with >2000 counts | High rate bins dominated by noise | Noise dominated (total time) | Noise dominated (detector-on time) | Marked lightcurve |
|---|---|---|---|---|---|---|---|
| A | 7192 | 5821 | 7 | 7 | 0.10% | 0.12% | 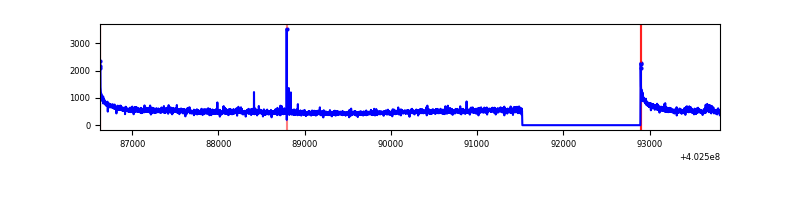 |
| B | 7192 | 5821 | 47 | 47 | 0.65% | 0.81% | 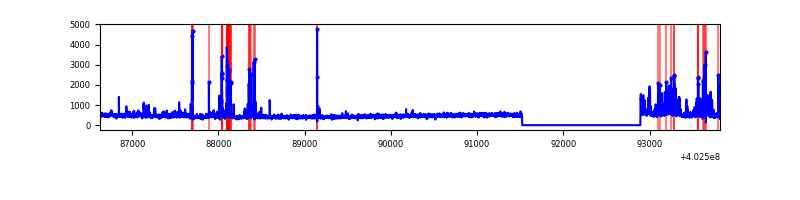 |
| C | 7192 | 5821 | 15 | 15 | 0.21% | 0.26% | 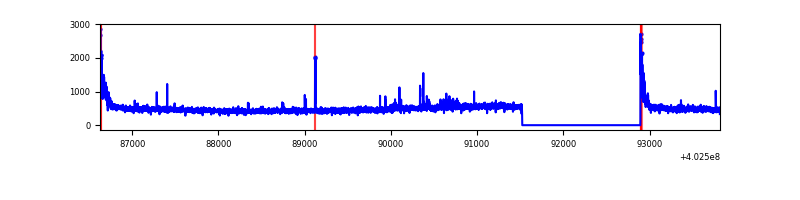 |
| D | 7192 | 5821 | 217 | 217 | 3.02% | 3.73% | 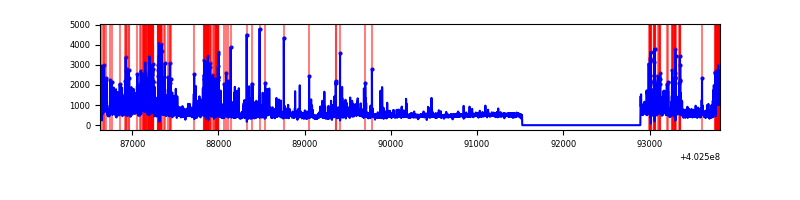 |
Top three noisy pixels from each quadrant. If the there are fewer than three noisy pixels in the level2.evt file, extra rows are filled as -1
| Pixel properties | Quadrant properties | ||||||
|---|---|---|---|---|---|---|---|
| Quadrant | DetID | PixID | Counts | Sigma | Mean | Median | Sigma |
| A | 10 | 83 | 401328 | 3070.73 | 642 | 630 | 130.5 |
| A | 15 | 222 | 112469 | 857.07 | 642 | 630 | 130.5 |
| A | 13 | 6 | 19783 | 146.78 | 642 | 630 | 130.5 |
| B | 5 | 172 | 204672 | 1661.87 | 641 | 625 | 122.8 |
| B | 4 | 171 | 118205 | 957.64 | 641 | 625 | 122.8 |
| B | 4 | 81 | 115865 | 938.58 | 641 | 625 | 122.8 |
| C | 15 | 214 | 249224 | 1708.82 | 625 | 628 | 145.5 |
| C | 0 | 10 | 156041 | 1068.29 | 625 | 628 | 145.5 |
| C | 14 | 254 | 27993 | 188.1 | 625 | 628 | 145.5 |
| D | 1 | 52 | 1390458 | 9212.24 | 616 | 597 | 150.9 |
| D | 5 | 32 | 191803 | 1267.35 | 616 | 597 | 150.9 |
| D | 2 | 250 | 126395 | 833.81 | 616 | 597 | 150.9 |
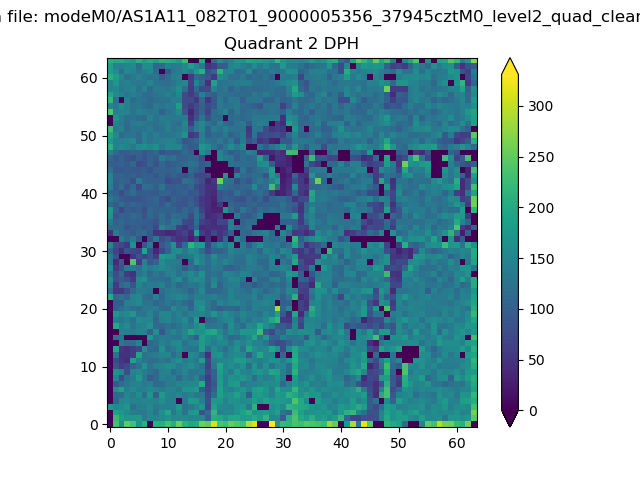
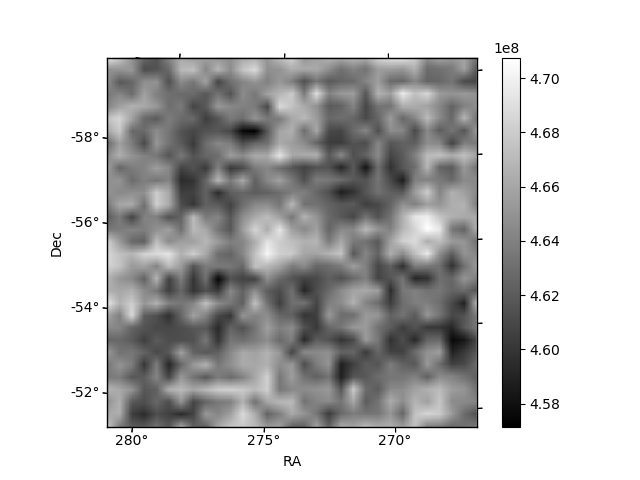
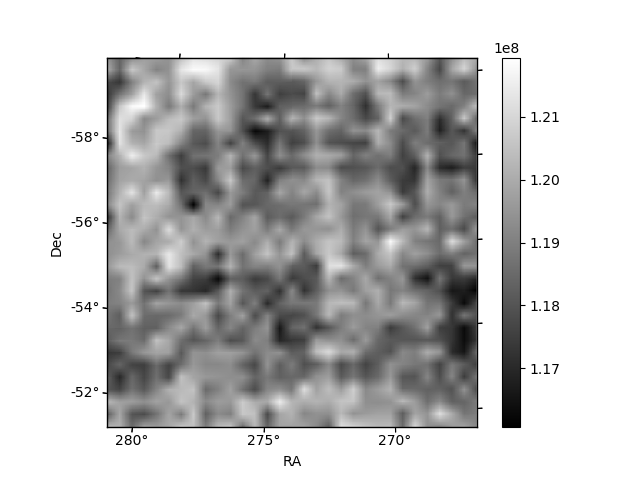
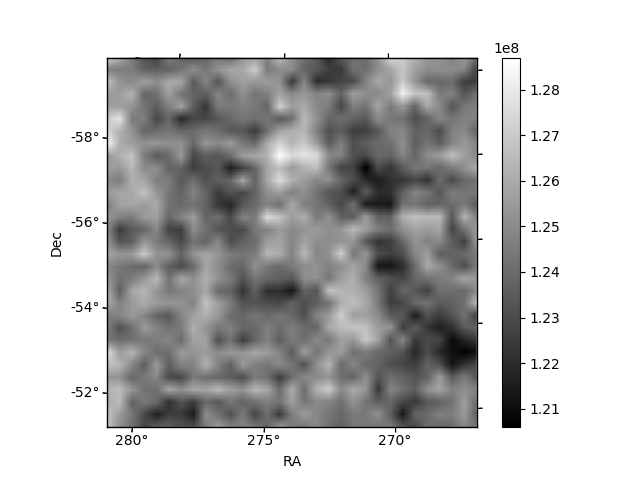
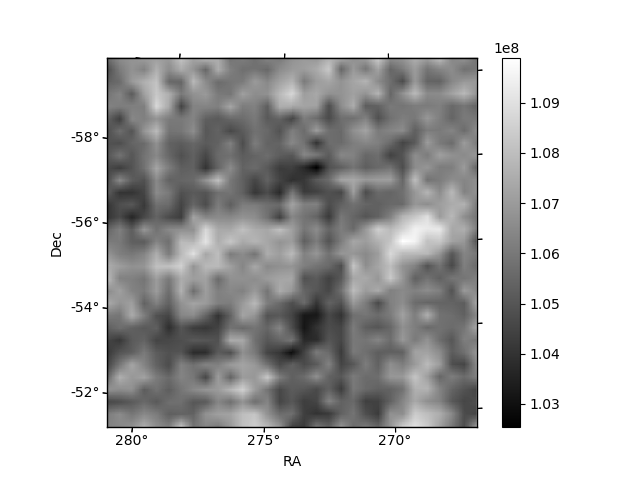
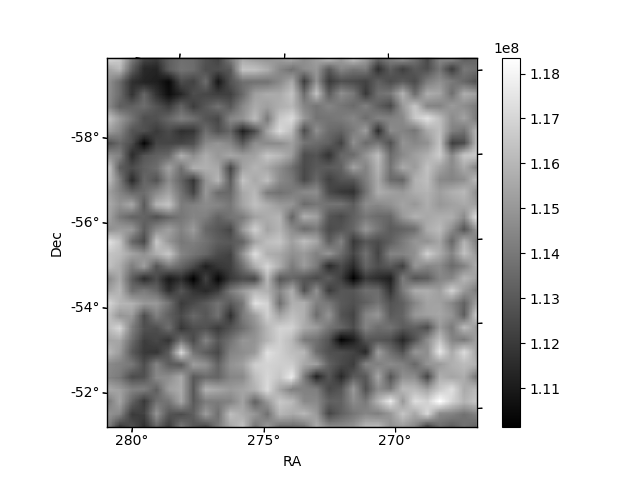
Histogram calculated using DETX and DETY for each event in the final _common_clean file
| Quadrant A | 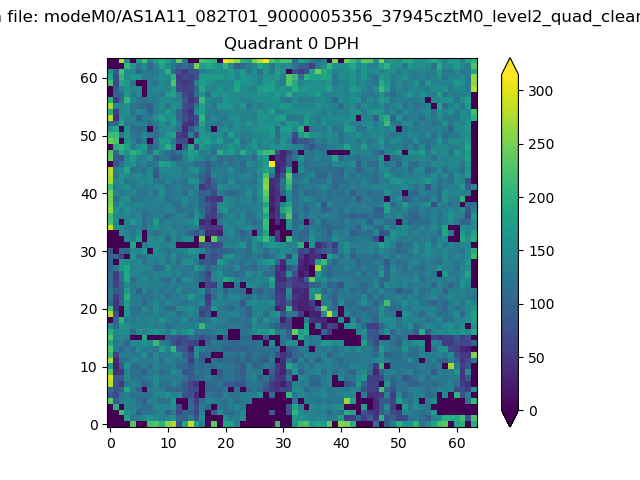 |
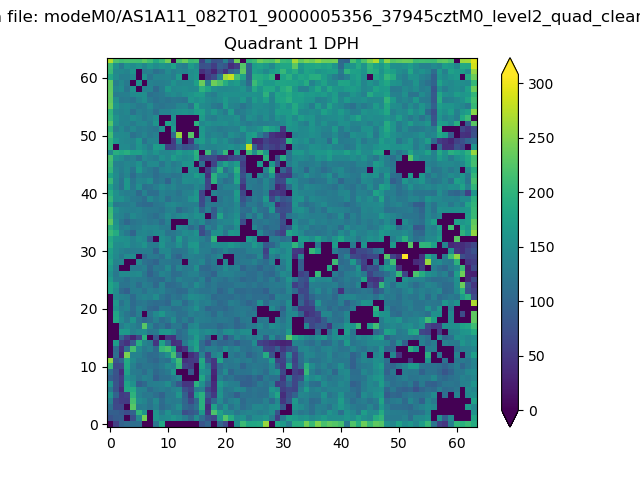 |
Quadrant B |
|---|---|---|---|
| Quadrant D | 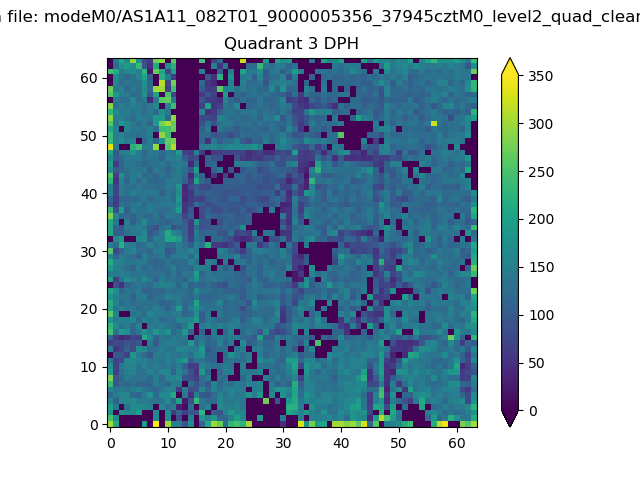 |
 |
Quadrant C |
| Plot type | Count rate plots | Images |
|---|---|---|
| Comparison with Poisson distribution Blue bars denote a histogram of data divided into 1 sec bins. Red curve is a Poisson curve with rate = median count rate of data. |
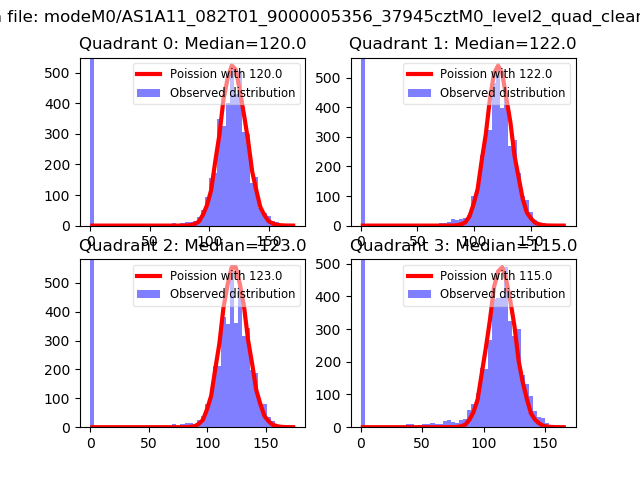 |
 |
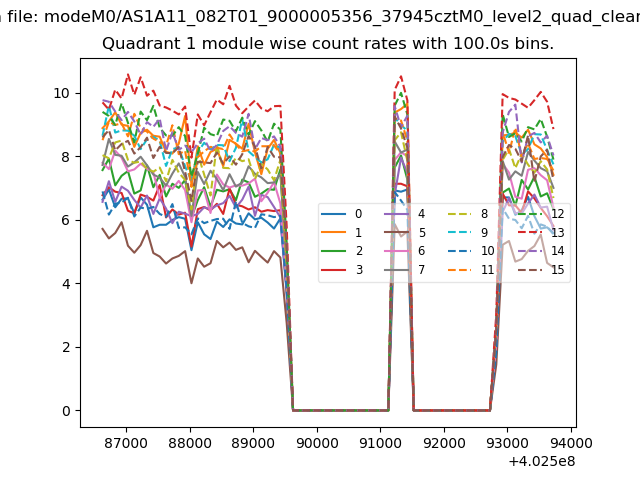
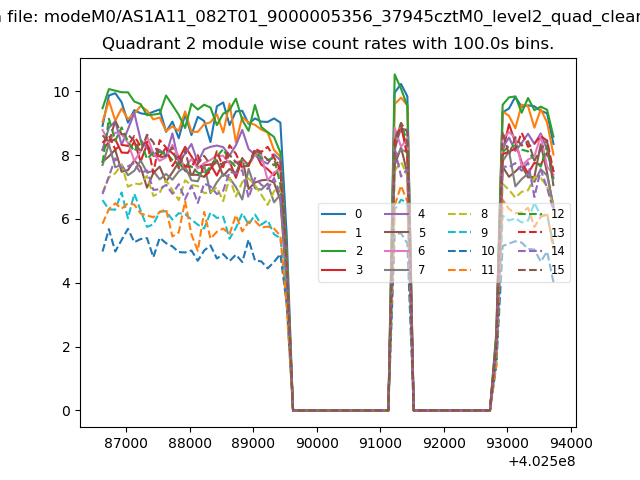
| Quadrant-wise count rates Data is divided into 100 sec bins |
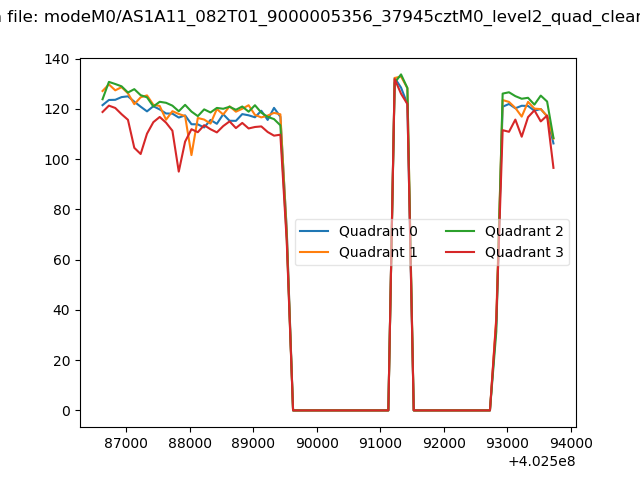 |
|
| Module-wise count rates for Quadrant A Data is divided into 100 sec bins |
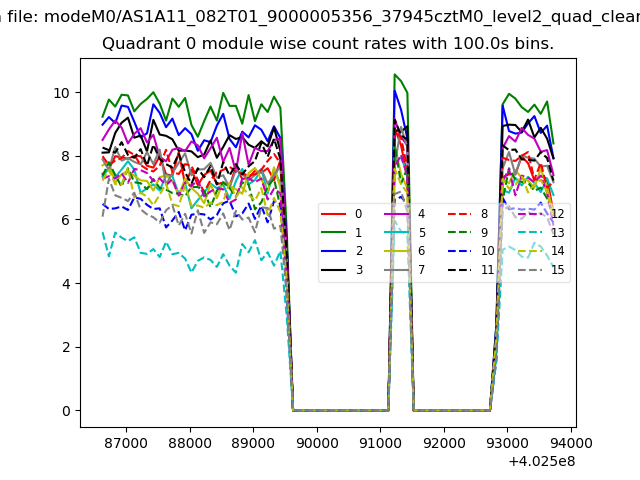 |
 |
| Module-wise count rates for Quadrant B Data is divided into 100 sec bins |
 |
 |
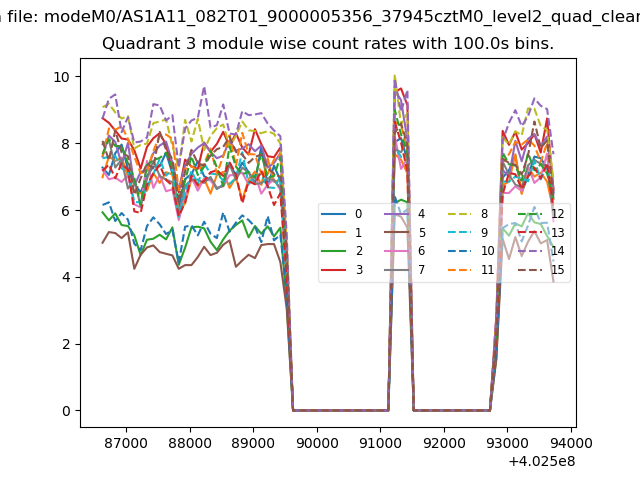
| Module-wise count rates for Quadrant C Data is divided into 100 sec bins |
 |
 |
| Module-wise count rates for Quadrant D Data is divided into 100 sec bins |
 |
 |
| Parameter | Plot |
|---|---|
| CZT HV Monitor | 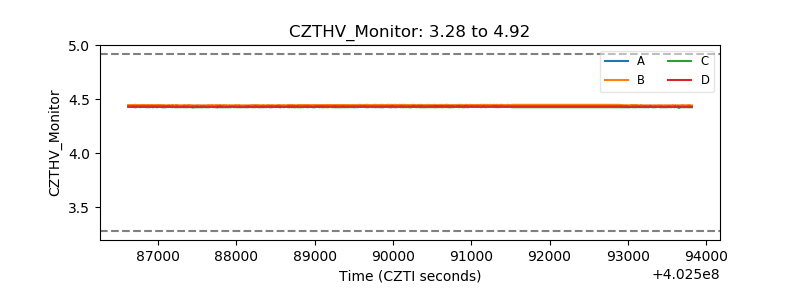 |
| D_VDD | 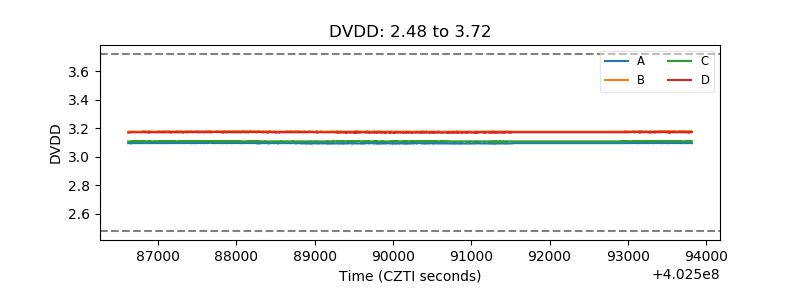 |
| Temperature 1 | 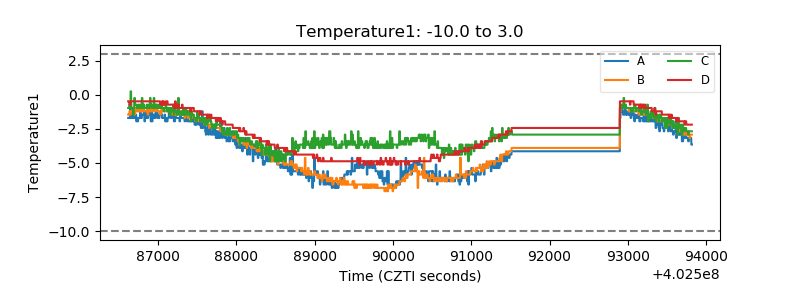 |
| Veto HV Monitor | 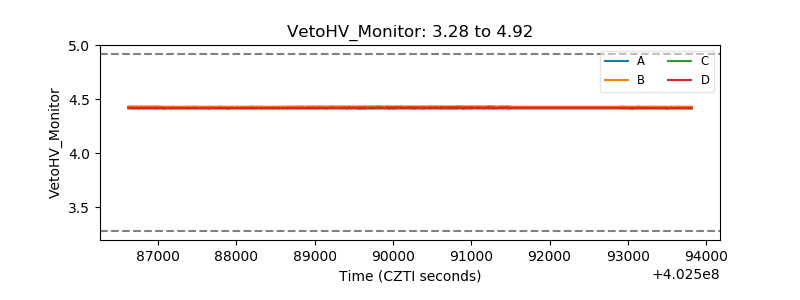 |
| Veto LLD | 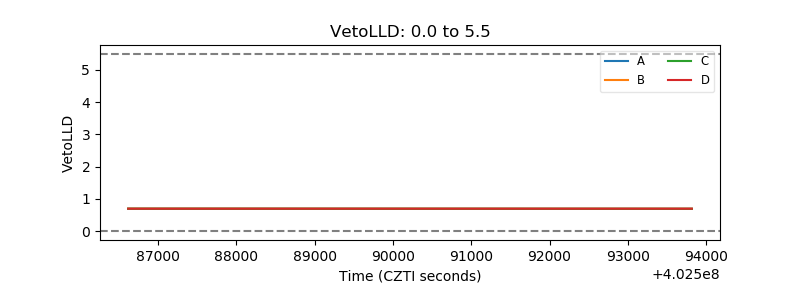 |
| Alpha Counter | 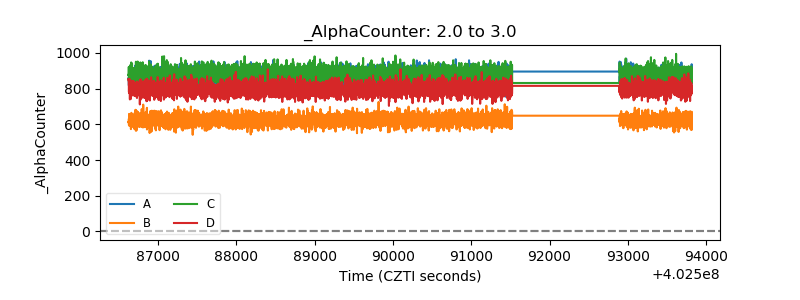 |
| _CPM_Rate | 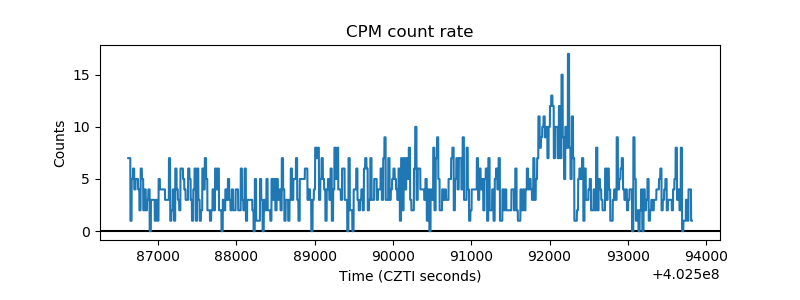 |
| CZT Counter | 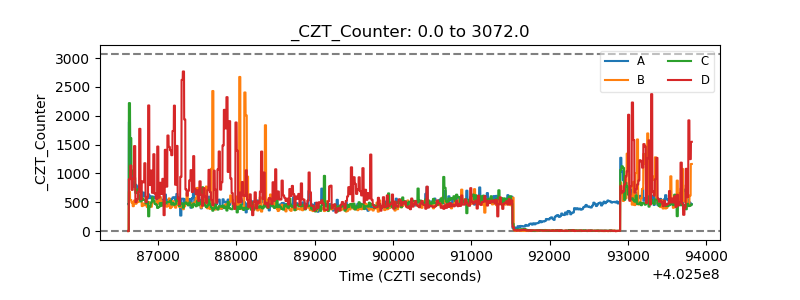 |
| +2.5 Volts monitor | 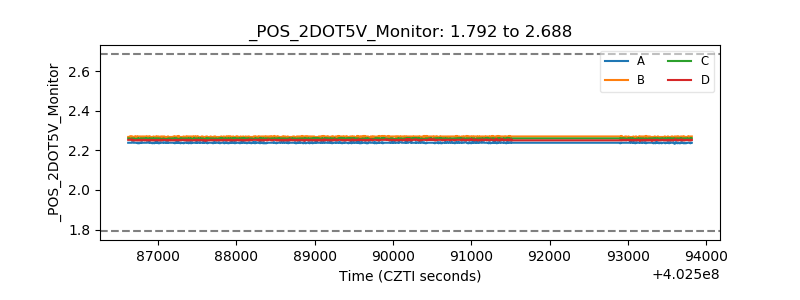 |
| +5 Volts monitor | 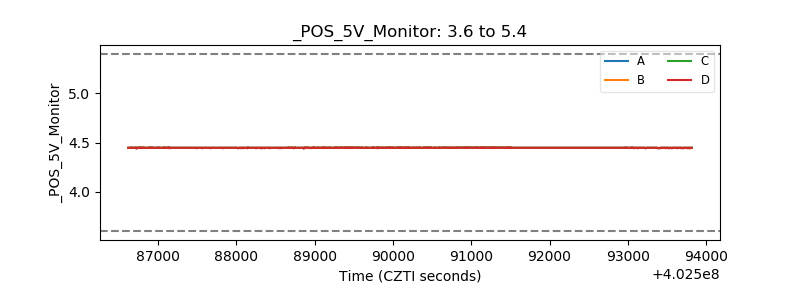 |
| _ROLL_ROT | 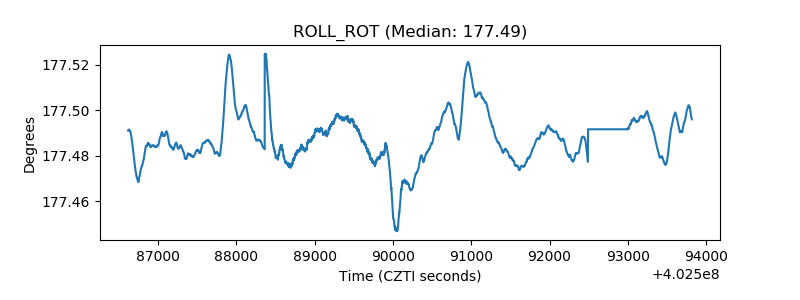 |
| _Roll_DEC | 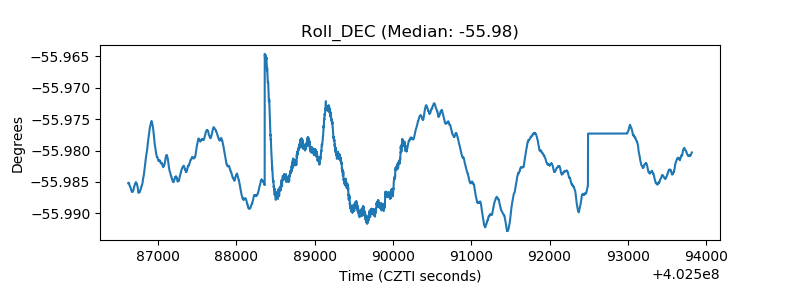 |
| _Roll_RA | 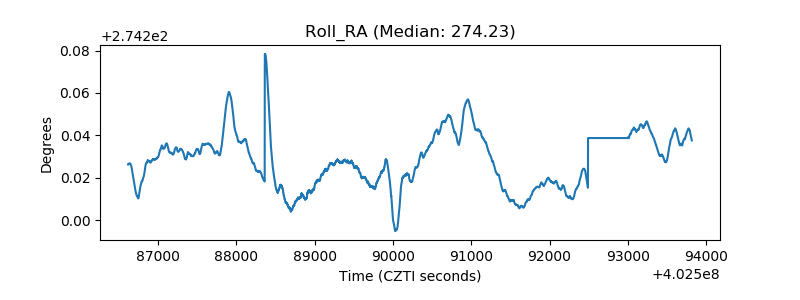 |
| Veto Counter | 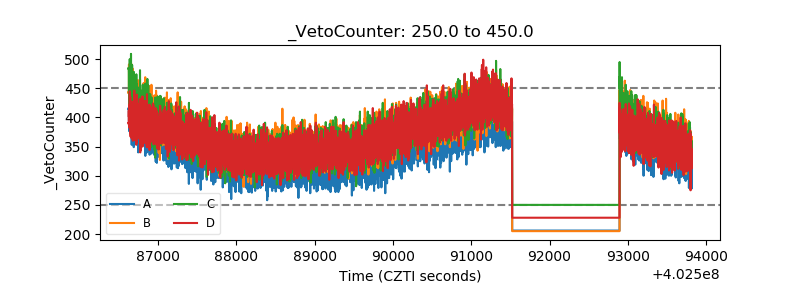 |