| Param | Original file | Final file |
|---|---|---|
| Filename | modeM0/AS1A11_082T01_9000005356_37946cztM0_level2.evt | modeM0/AS1A11_082T01_9000005356_37946cztM0_level2_quad_clean.evt |
| Size (bytes) | 470,891,520 | 78,955,200 |
| Size | 449.1 MB | 75.3 MB |
| Events in quadrant A | 3,013,955 | 501,841 |
| Events in quadrant B | 3,439,537 | 502,240 |
| Events in quadrant C | 2,823,995 | 512,538 |
| Events in quadrant D | 4,588,045 | 466,931 |
| Mode M0 | |||
|---|---|---|---|
| Quadrant | BADHDUFLAG | Total packets | Discarded packets |
| A | 0 | 12556 | 2 |
| B | 0 | 14260 | 1 |
| C | 0 | 12085 | 1 |
| D | 0 | 17663 | 1 |
| Mode SS | |||
|---|---|---|---|
| Quadrant | BADHDUFLAG | Total packets | Discarded packets |
| A | 0 | 118 | 0 |
| B | 0 | 118 | 0 |
| C | 0 | 118 | 0 |
| D | 0 | 118 | 0 |
| Mode M9 | |||
|---|---|---|---|
| Quadrant | BADHDUFLAG | Total packets | Discarded packets |
| A | 0 | 13 | 0 |
| B | 0 | 13 | 0 |
| C | 0 | 13 | 0 |
| D | 0 | 13 | 0 |
| Quadrant | Total seconds | Saturated seconds | Saturation percentage |
|---|---|---|---|
| A | 5826 | 14 | 0.240302% |
| B | 5826 | 152 | 2.608994% |
| C | 5826 | 15 | 0.257467% |
| D | 5826 | 415 | 7.123241% |
Noise dominated data is calculated using 1-second bins in cleaned event files. If a bin has >2000 counts, and if more than 50% of those come from <1% of pixels, then it is considered to be noise-dominated and hence unusable.
| Quadrant | # 1 sec bins | Bins with >0 counts | Bins with >2000 counts | High rate bins dominated by noise | Noise dominated (total time) | Noise dominated (detector-on time) | Marked lightcurve |
|---|---|---|---|---|---|---|---|
| A | 7108 | 5827 | 5 | 5 | 0.07% | 0.09% | 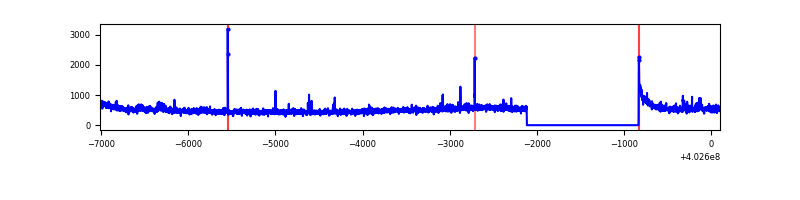 |
| B | 7108 | 5827 | 81 | 81 | 1.14% | 1.39% | 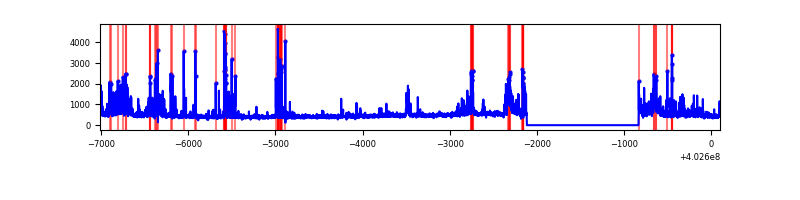 |
| C | 7108 | 5827 | 6 | 6 | 0.08% | 0.10% | 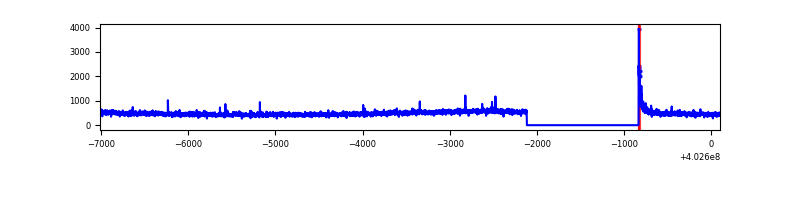 |
| D | 7108 | 5827 | 423 | 423 | 5.95% | 7.26% | 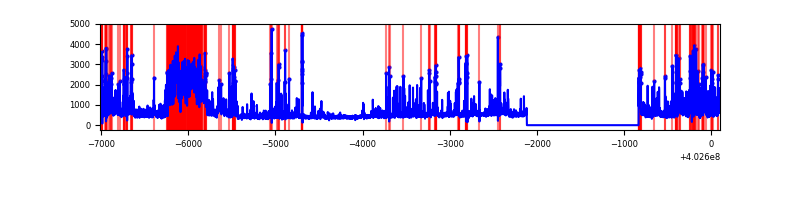 |
Top three noisy pixels from each quadrant. If the there are fewer than three noisy pixels in the level2.evt file, extra rows are filled as -1
| Pixel properties | Quadrant properties | ||||||
|---|---|---|---|---|---|---|---|
| Quadrant | DetID | PixID | Counts | Sigma | Mean | Median | Sigma |
| A | 10 | 83 | 367156 | 2781.74 | 644 | 632 | 131.8 |
| A | 15 | 222 | 104723 | 790.0 | 644 | 632 | 131.8 |
| A | 7 | 3 | 24840 | 183.73 | 644 | 632 | 131.8 |
| B | 5 | 172 | 310012 | 2506.75 | 640 | 622 | 123.4 |
| B | 5 | 184 | 191992 | 1550.53 | 640 | 622 | 123.4 |
| B | 4 | 171 | 135149 | 1089.97 | 640 | 622 | 123.4 |
| C | 15 | 214 | 245660 | 1669.19 | 628 | 632 | 146.8 |
| C | 0 | 10 | 91795 | 621.02 | 628 | 632 | 146.8 |
| C | 14 | 254 | 17021 | 111.65 | 628 | 632 | 146.8 |
| D | 1 | 52 | 939182 | 6255.82 | 611 | 594 | 150.0 |
| D | 5 | 32 | 839384 | 5590.65 | 611 | 594 | 150.0 |
| D | 12 | 233 | 114348 | 758.19 | 611 | 594 | 150.0 |
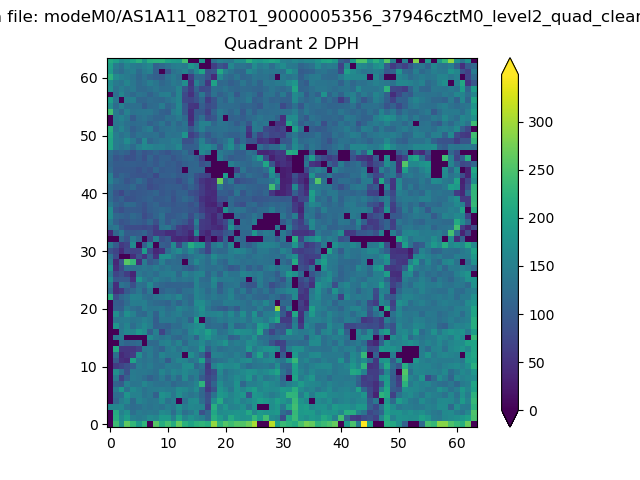
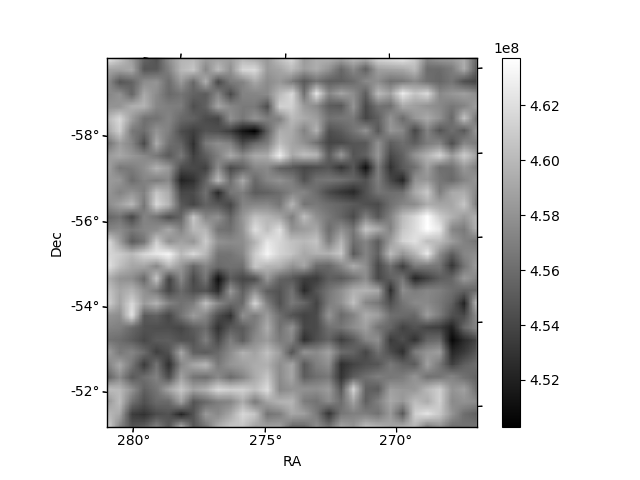
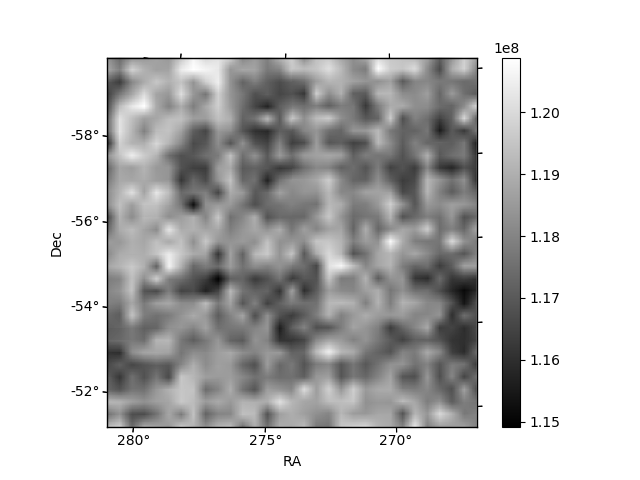
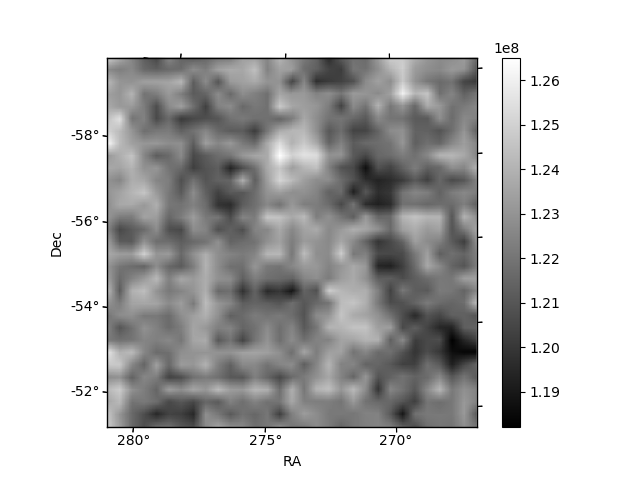
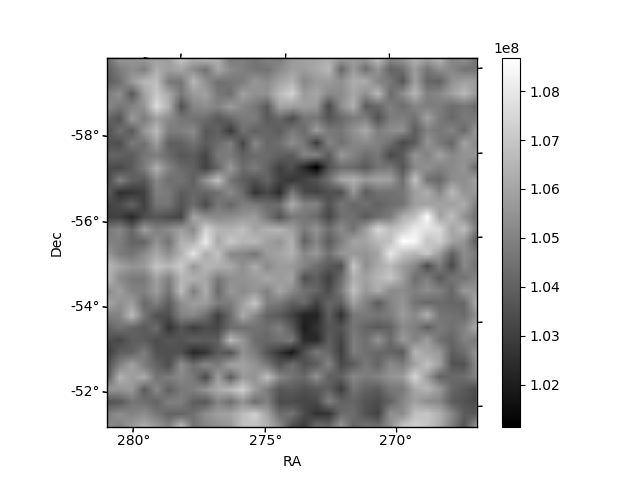
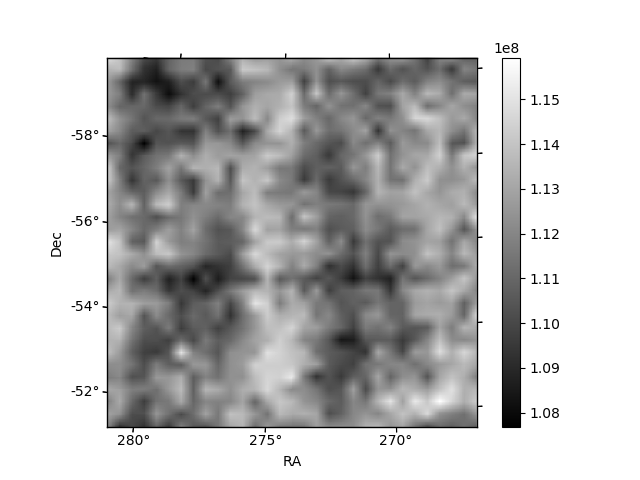
Histogram calculated using DETX and DETY for each event in the final _common_clean file
| Quadrant A | 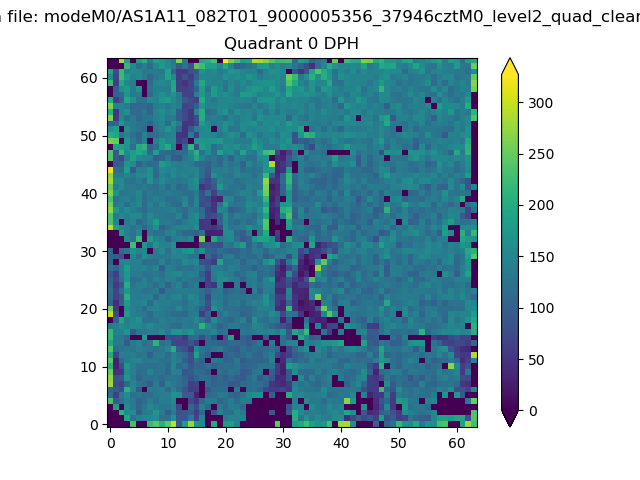 |
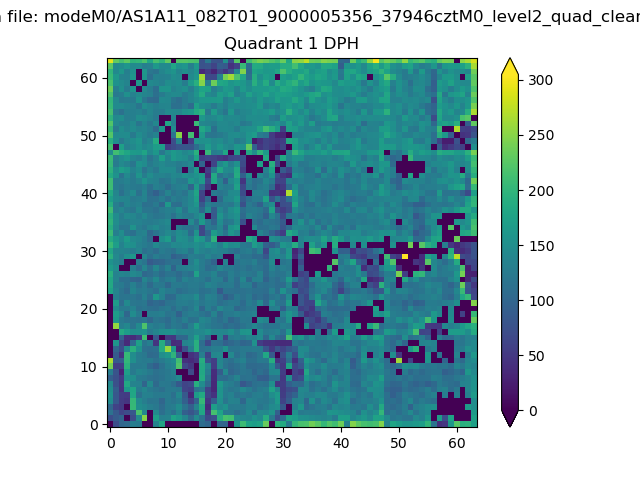 |
Quadrant B |
|---|---|---|---|
| Quadrant D | 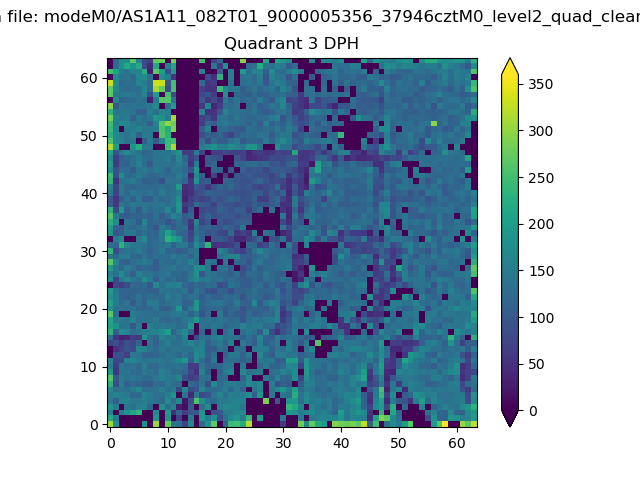 |
 |
Quadrant C |
| Plot type | Count rate plots | Images |
|---|---|---|
| Comparison with Poisson distribution Blue bars denote a histogram of data divided into 1 sec bins. Red curve is a Poisson curve with rate = median count rate of data. |
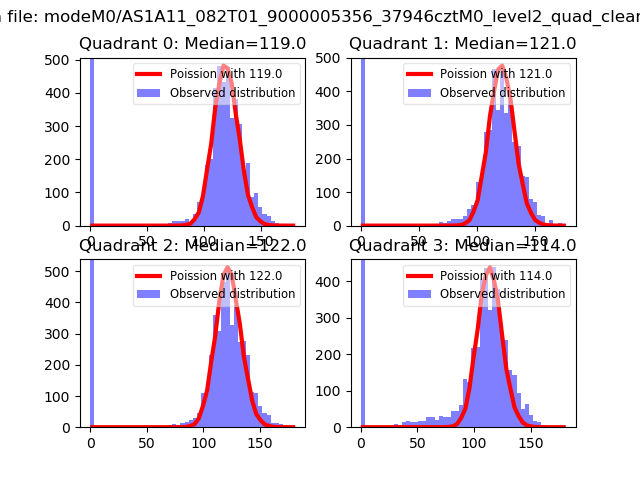 |
 |
| Quadrant-wise count rates Data is divided into 100 sec bins |
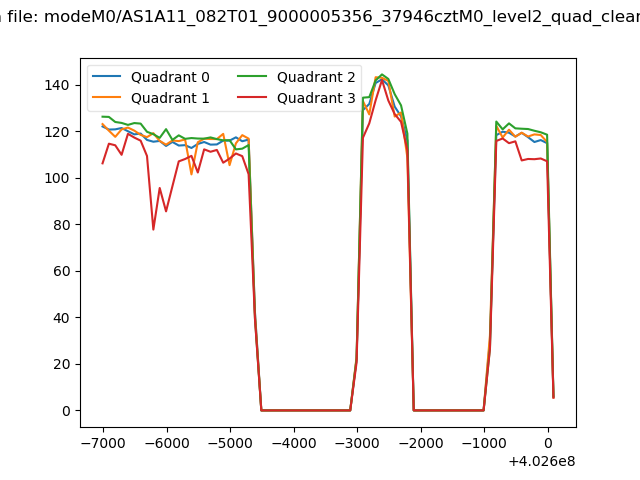 |
|
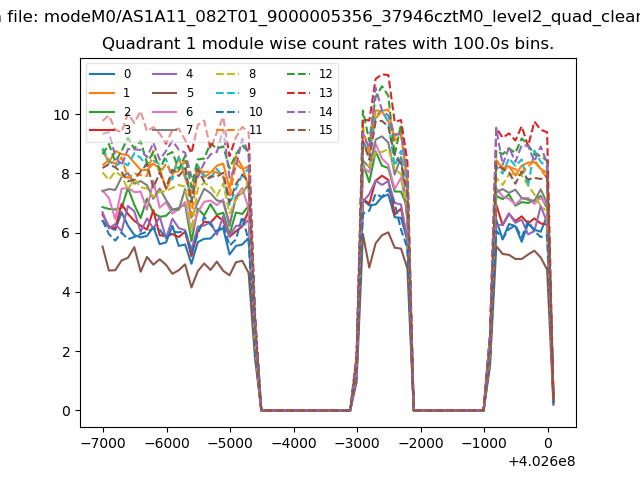
| Module-wise count rates for Quadrant A Data is divided into 100 sec bins |
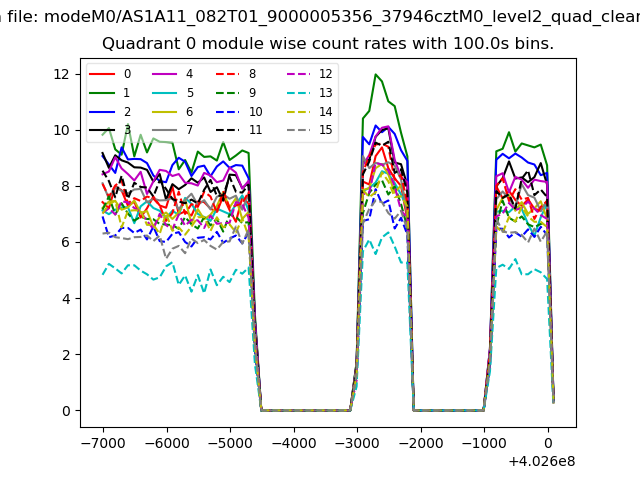 |
 |
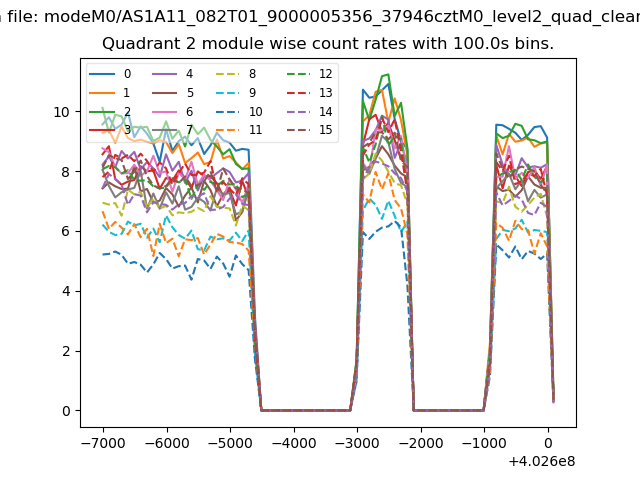
| Module-wise count rates for Quadrant B Data is divided into 100 sec bins |
 |
 |
| Module-wise count rates for Quadrant C Data is divided into 100 sec bins |
 |
 |
| Module-wise count rates for Quadrant D Data is divided into 100 sec bins |
 |
 |
| Parameter | Plot |
|---|---|
| CZT HV Monitor | 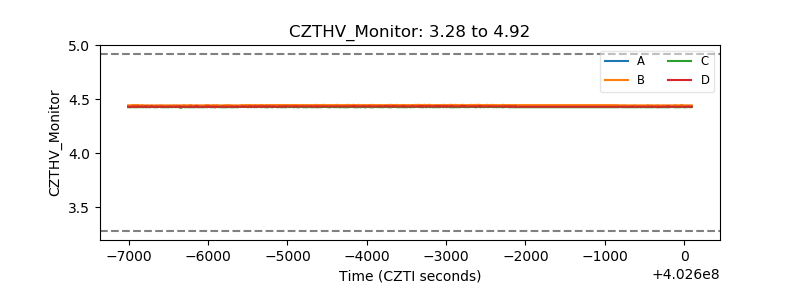 |
| D_VDD | 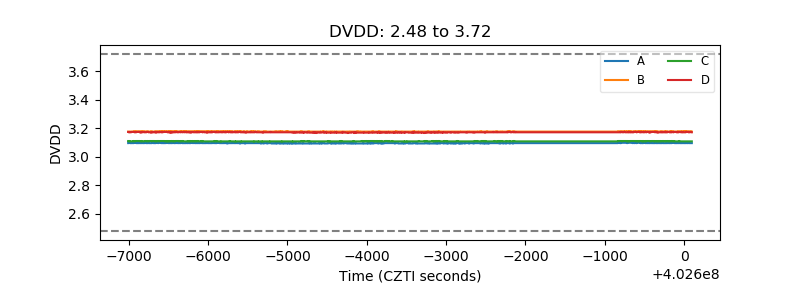 |
| Temperature 1 | 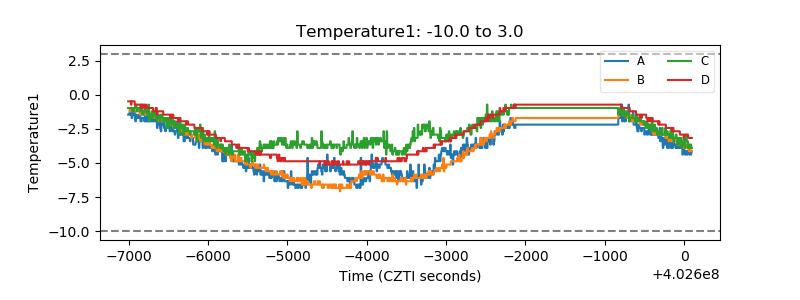 |
| Veto HV Monitor | 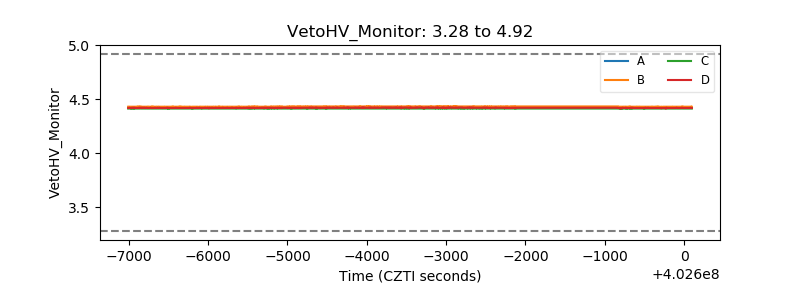 |
| Veto LLD | 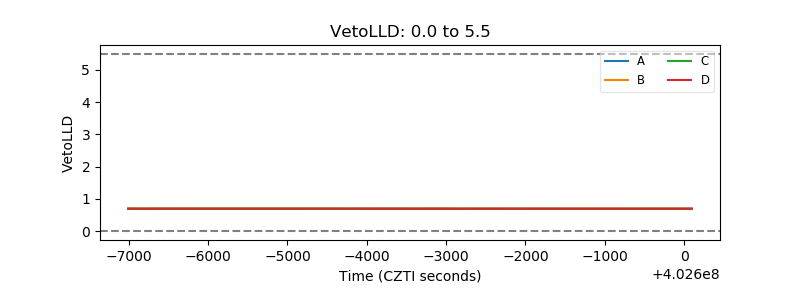 |
| Alpha Counter | 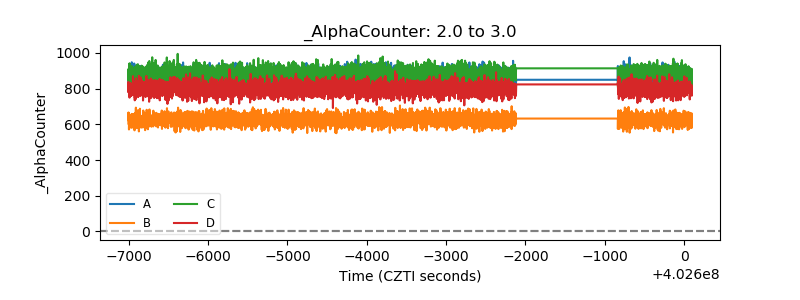 |
| _CPM_Rate | 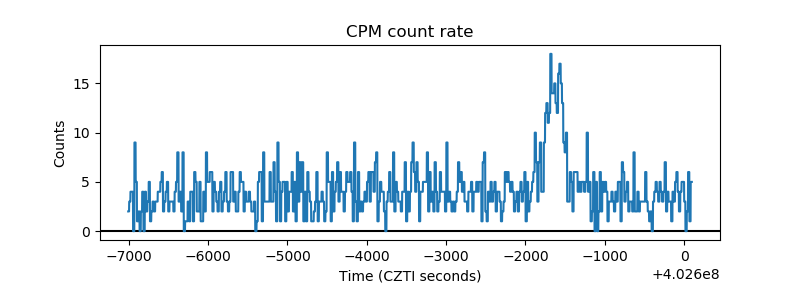 |
| CZT Counter | 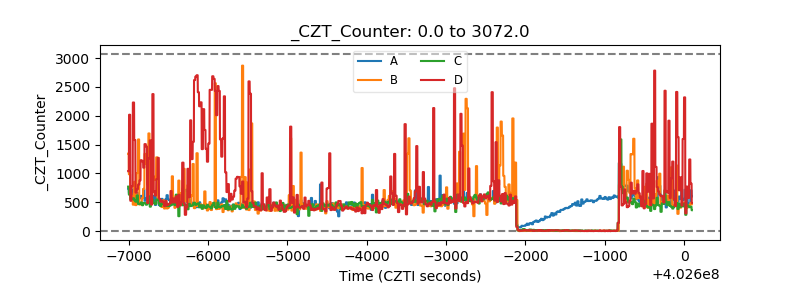 |
| +2.5 Volts monitor | 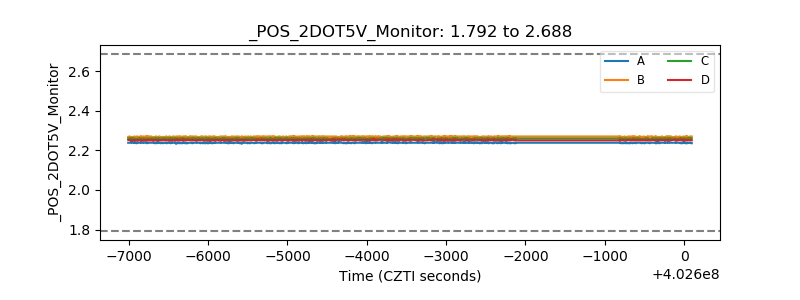 |
| +5 Volts monitor | 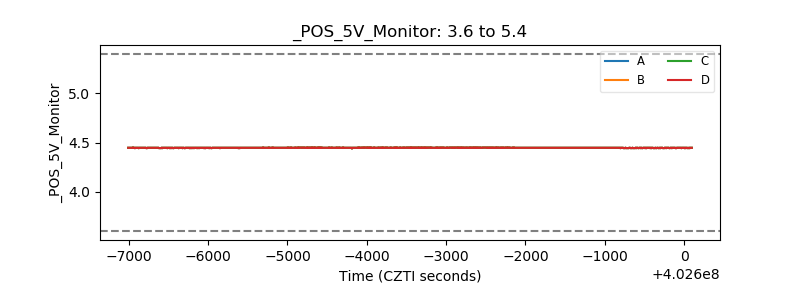 |
| _ROLL_ROT | 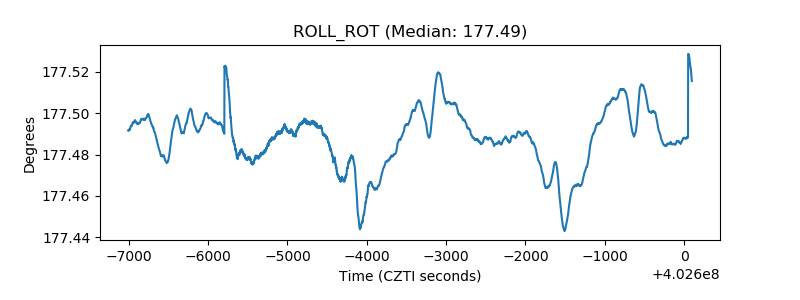 |
| _Roll_DEC | 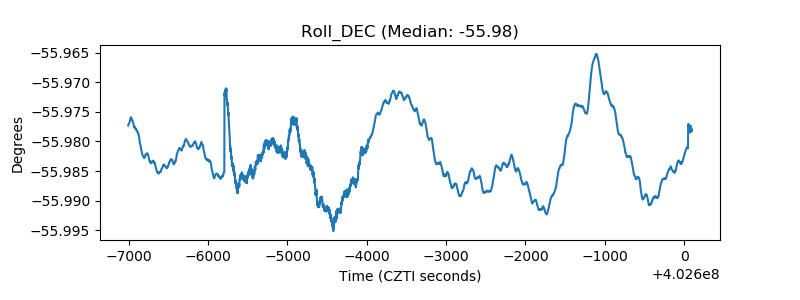 |
| _Roll_RA | 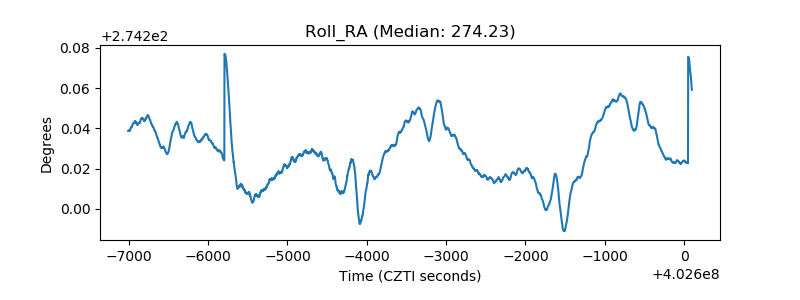 |
| Veto Counter | 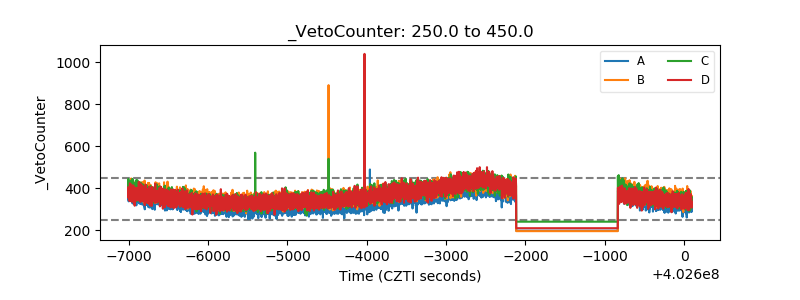 |