| Param | Original file | Final file |
|---|---|---|
| Filename | modeM0/AS1A11_082T01_9000005356_37949cztM0_level2.evt | modeM0/AS1A11_082T01_9000005356_37949cztM0_level2_quad_clean.evt |
| Size (bytes) | 1,215,550,080 | 202,331,520 |
| Size | 1.1 GB | 193.0 MB |
| Events in quadrant A | 8,550,059 | 1,268,617 |
| Events in quadrant B | 9,139,106 | 1,271,111 |
| Events in quadrant C | 7,745,607 | 1,304,463 |
| Events in quadrant D | 10,329,739 | 1,212,005 |
| Mode M0 | |||
|---|---|---|---|
| Quadrant | BADHDUFLAG | Total packets | Discarded packets |
| A | 0 | 35509 | 5 |
| B | 0 | 37445 | 4 |
| C | 0 | 32745 | 4 |
| D | 0 | 41599 | 4 |
| Mode SS | |||
|---|---|---|---|
| Quadrant | BADHDUFLAG | Total packets | Discarded packets |
| A | 0 | 316 | 0 |
| B | 0 | 316 | 0 |
| C | 0 | 316 | 0 |
| D | 0 | 316 | 0 |
| Mode M9 | |||
|---|---|---|---|
| Quadrant | BADHDUFLAG | Total packets | Discarded packets |
| A | 0 | 49 | 0 |
| B | 0 | 49 | 0 |
| C | 0 | 49 | 0 |
| D | 0 | 50 | 0 |
| Quadrant | Total seconds | Saturated seconds | Saturation percentage |
|---|---|---|---|
| A | 15532 | 118 | 0.759722% |
| B | 15532 | 526 | 3.386557% |
| C | 15532 | 83 | 0.534381% |
| D | 15532 | 589 | 3.792171% |
Noise dominated data is calculated using 1-second bins in cleaned event files. If a bin has >2000 counts, and if more than 50% of those come from <1% of pixels, then it is considered to be noise-dominated and hence unusable.
| Quadrant | # 1 sec bins | Bins with >0 counts | Bins with >2000 counts | High rate bins dominated by noise | Noise dominated (total time) | Noise dominated (detector-on time) | Marked lightcurve |
|---|---|---|---|---|---|---|---|
| A | 19739 | 15535 | 50 | 50 | 0.25% | 0.32% | 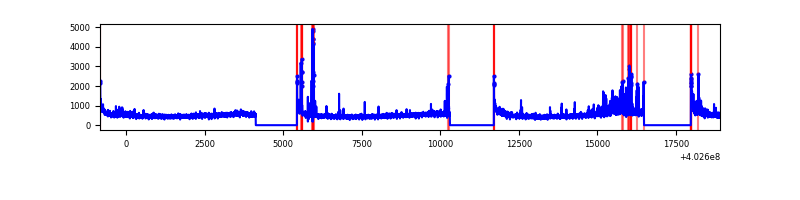 |
| B | 19739 | 15535 | 344 | 344 | 1.74% | 2.21% | 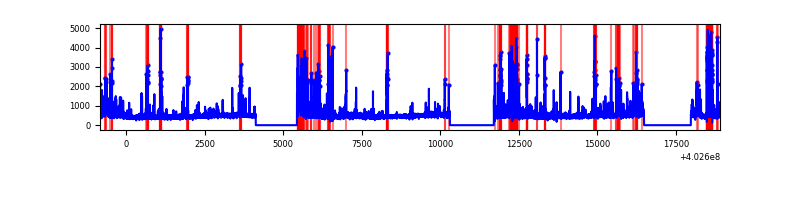 |
| C | 19739 | 15535 | 54 | 54 | 0.27% | 0.35% | 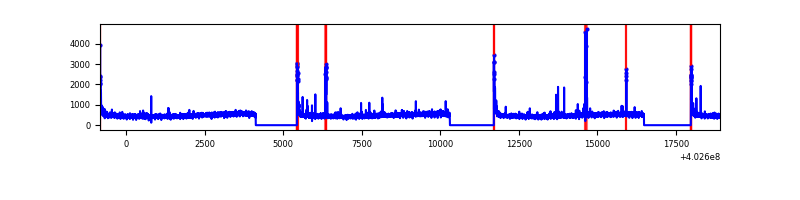 |
| D | 19739 | 15535 | 470 | 470 | 2.38% | 3.03% | 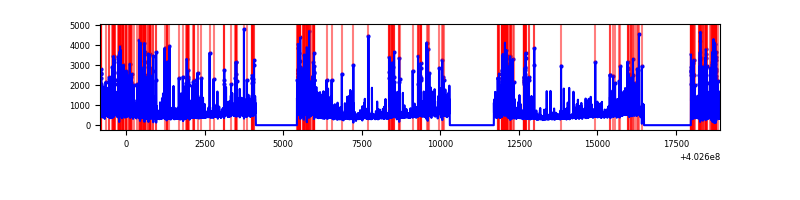 |
Top three noisy pixels from each quadrant. If the there are fewer than three noisy pixels in the level2.evt file, extra rows are filled as -1
| Pixel properties | Quadrant properties | ||||||
|---|---|---|---|---|---|---|---|
| Quadrant | DetID | PixID | Counts | Sigma | Mean | Median | Sigma |
| A | 10 | 83 | 936175 | 2686.55 | 1723 | 1688 | 347.8 |
| A | 15 | 222 | 716924 | 2056.23 | 1723 | 1688 | 347.8 |
| A | 13 | 248 | 150718 | 428.45 | 1723 | 1688 | 347.8 |
| B | 5 | 172 | 666017 | 2061.71 | 1705 | 1659 | 322.2 |
| B | 5 | 184 | 493878 | 1527.51 | 1705 | 1659 | 322.2 |
| B | 0 | 229 | 405159 | 1252.18 | 1705 | 1659 | 322.2 |
| C | 15 | 214 | 649722 | 1657.44 | 1690 | 1707 | 391.0 |
| C | 0 | 10 | 316735 | 805.75 | 1690 | 1707 | 391.0 |
| C | 14 | 254 | 140014 | 353.75 | 1690 | 1707 | 391.0 |
| D | 1 | 52 | 2439729 | 6039.19 | 1660 | 1616 | 403.7 |
| D | 2 | 249 | 589049 | 1455.07 | 1660 | 1616 | 403.7 |
| D | 13 | 249 | 200763 | 493.29 | 1660 | 1616 | 403.7 |
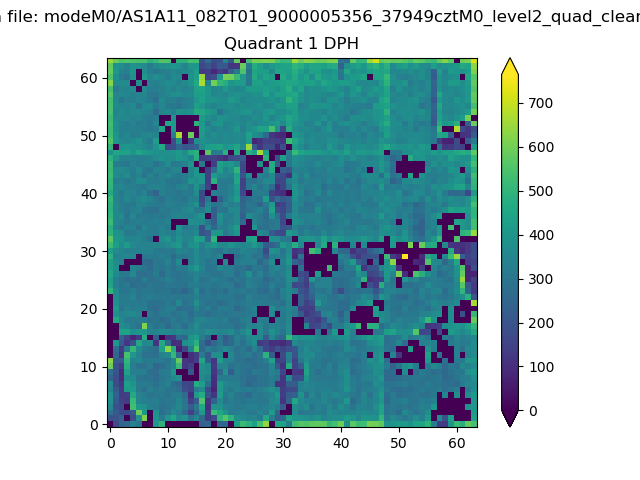
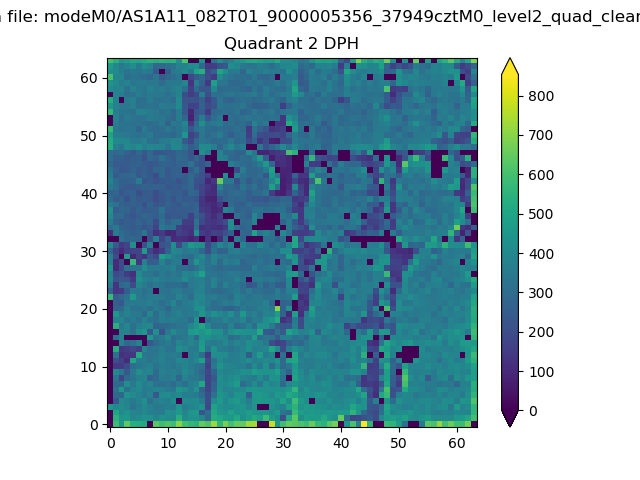
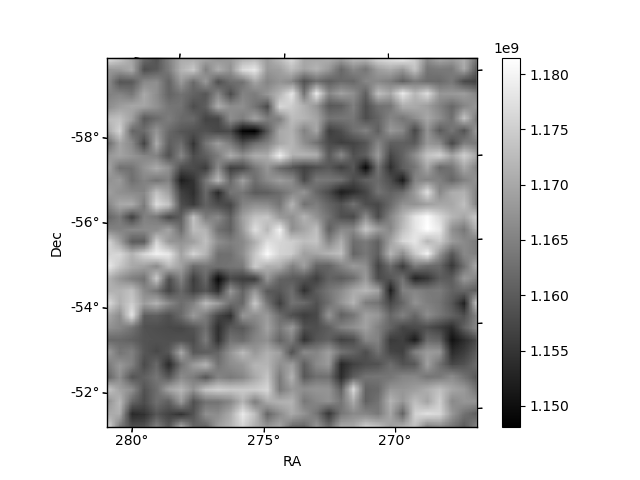
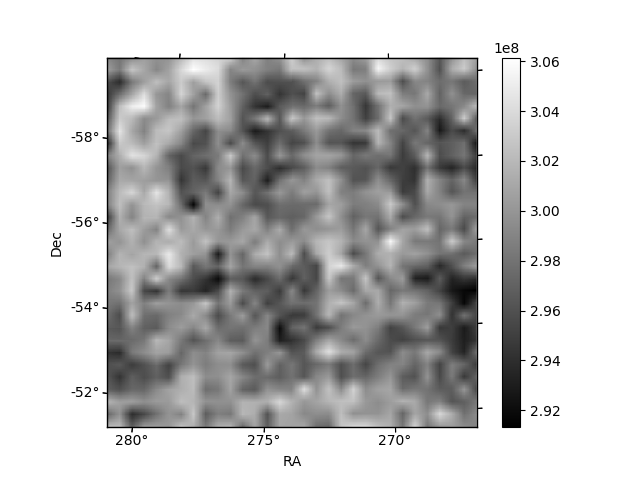
Histogram calculated using DETX and DETY for each event in the final _common_clean file
| Quadrant A |  |
 |
Quadrant B |
|---|---|---|---|
| Quadrant D | 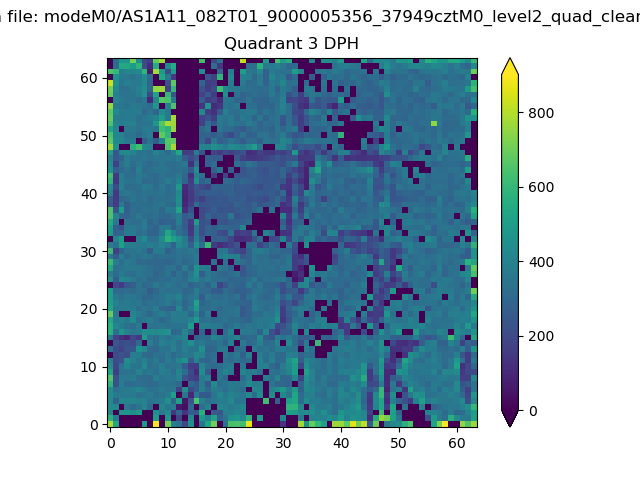 |
 |
Quadrant C |
| Plot type | Count rate plots | Images |
|---|---|---|
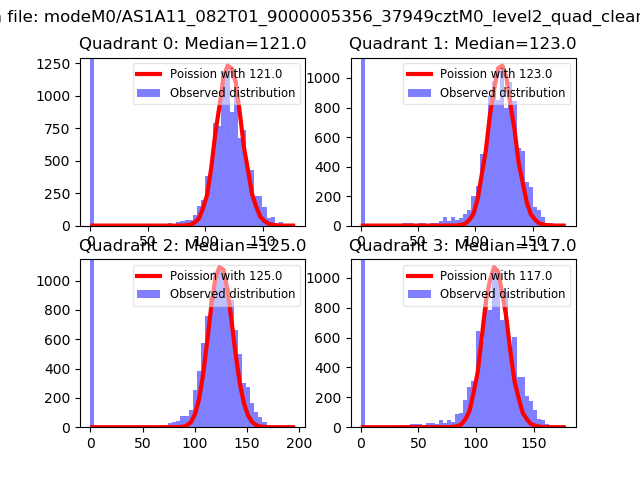
| Comparison with Poisson distribution Blue bars denote a histogram of data divided into 1 sec bins. Red curve is a Poisson curve with rate = median count rate of data. |
 |
 |
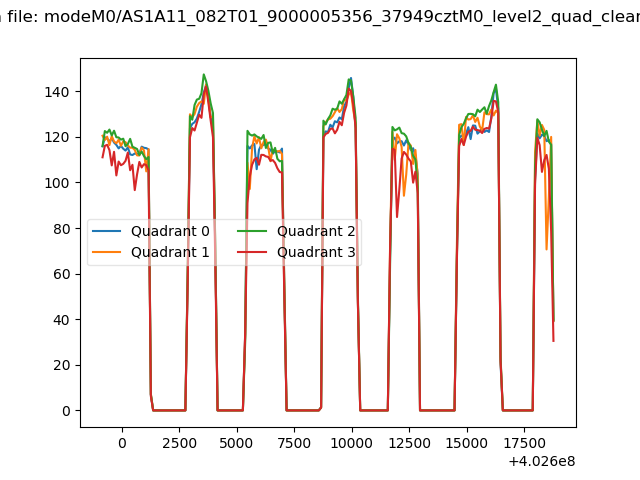
| Quadrant-wise count rates Data is divided into 100 sec bins |
 |
|
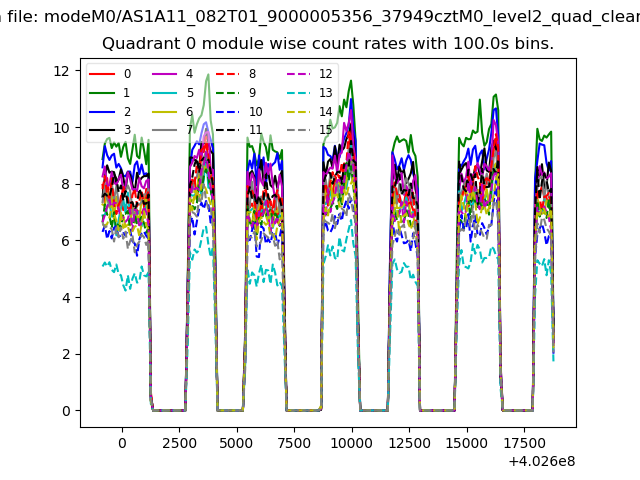
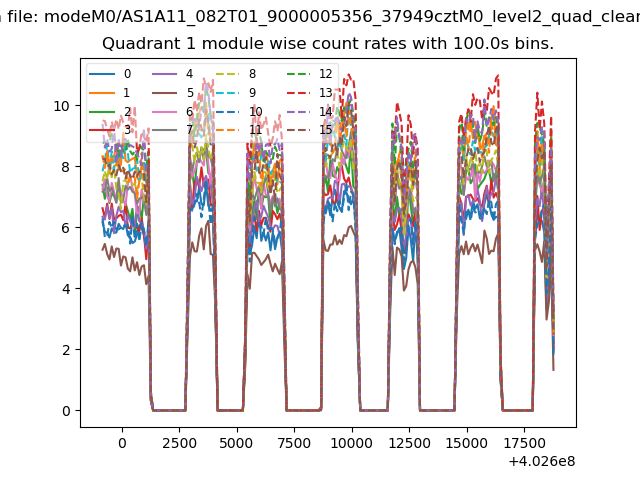
| Module-wise count rates for Quadrant A Data is divided into 100 sec bins |
 |
 |
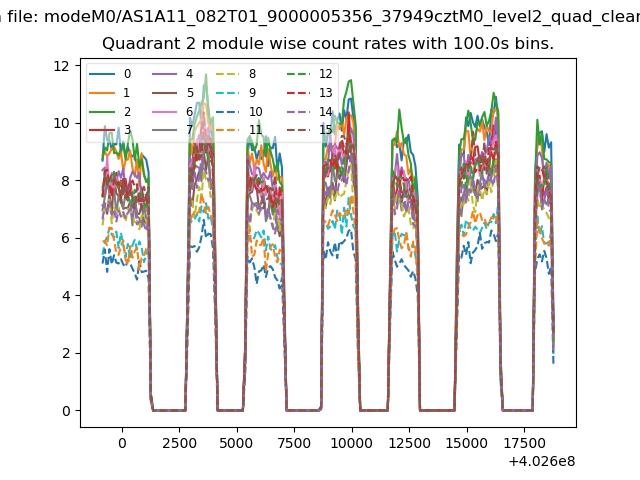
| Module-wise count rates for Quadrant B Data is divided into 100 sec bins |
 |
 |
| Module-wise count rates for Quadrant C Data is divided into 100 sec bins |
 |
 |
| Module-wise count rates for Quadrant D Data is divided into 100 sec bins |
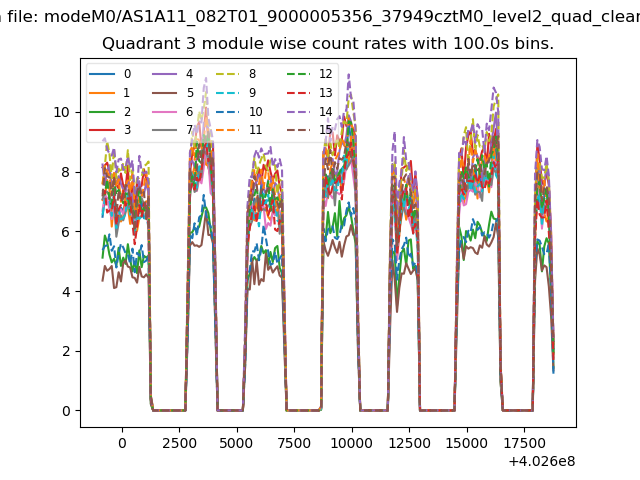 |
 |
| Parameter | Plot |
|---|---|
| CZT HV Monitor | 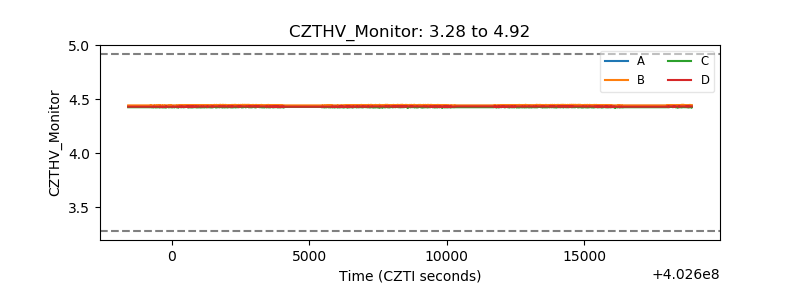 |
| D_VDD | 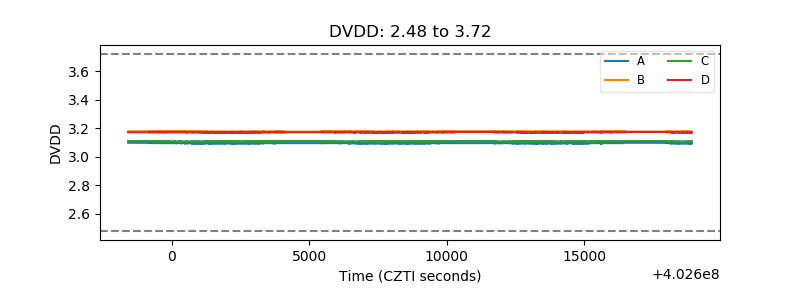 |
| Temperature 1 | 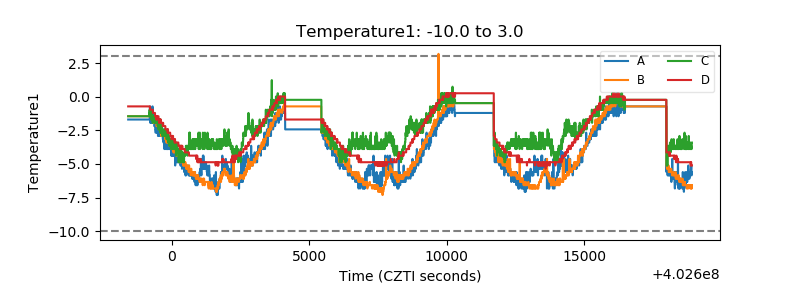 |
| Veto HV Monitor |  |
| Veto LLD | 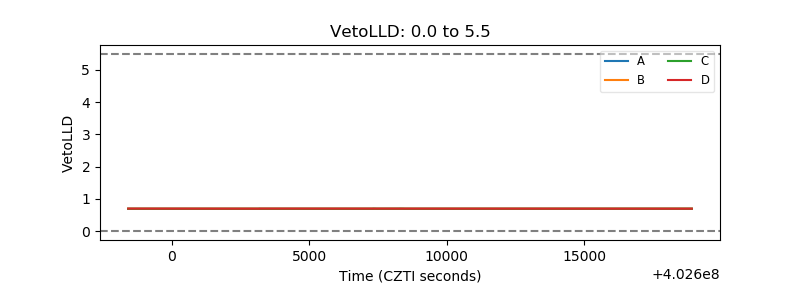 |
| Alpha Counter | 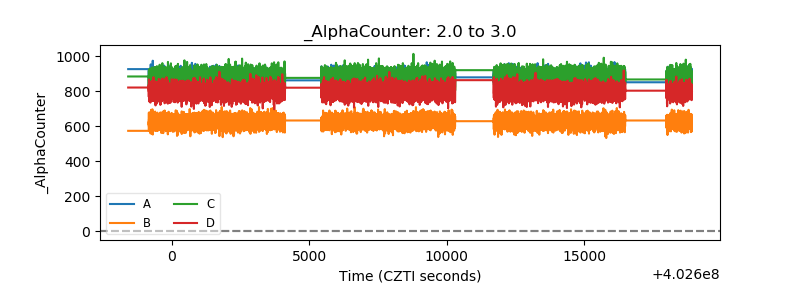 |
| _CPM_Rate | 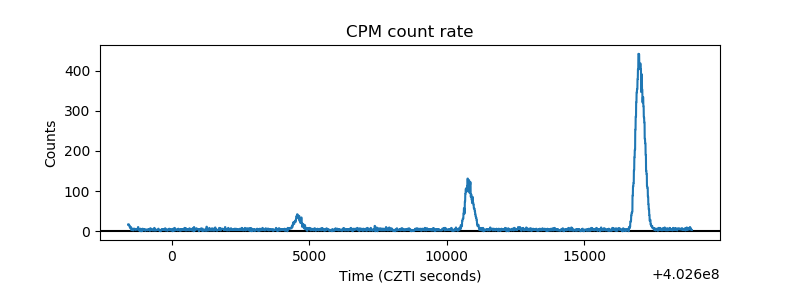 |
| CZT Counter | 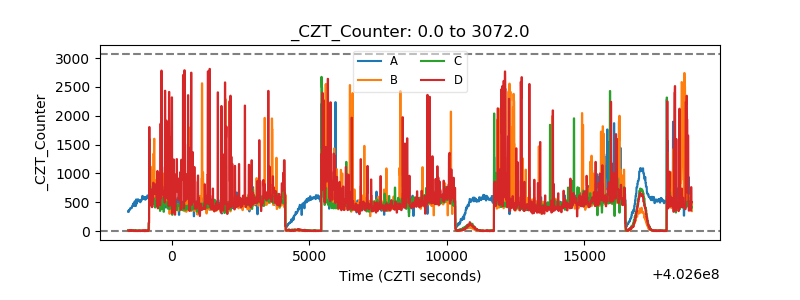 |
| +2.5 Volts monitor | 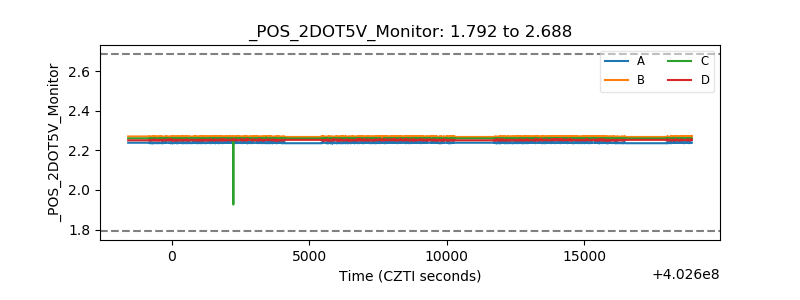 |
| +5 Volts monitor | 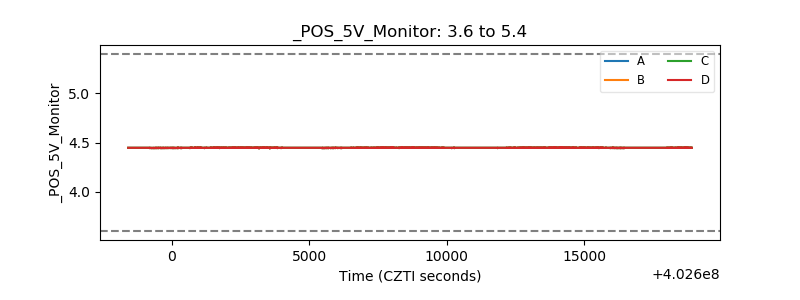 |
| _ROLL_ROT | 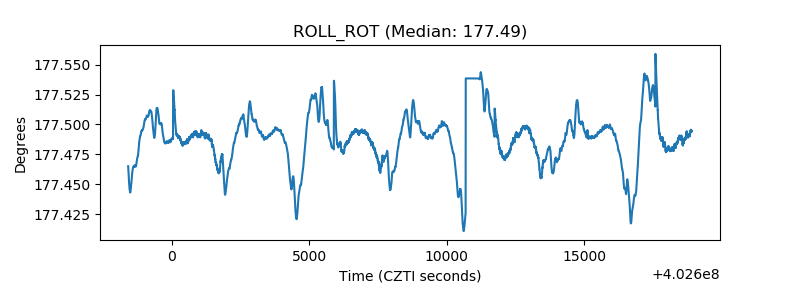 |
| _Roll_DEC | 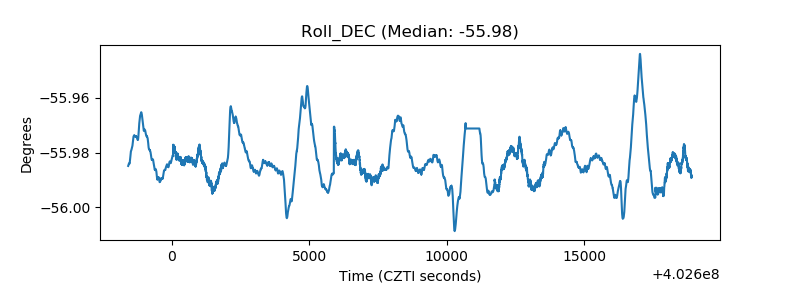 |
| _Roll_RA | 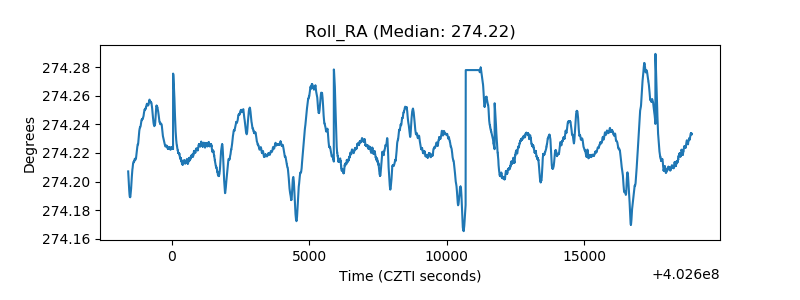 |
| Veto Counter | 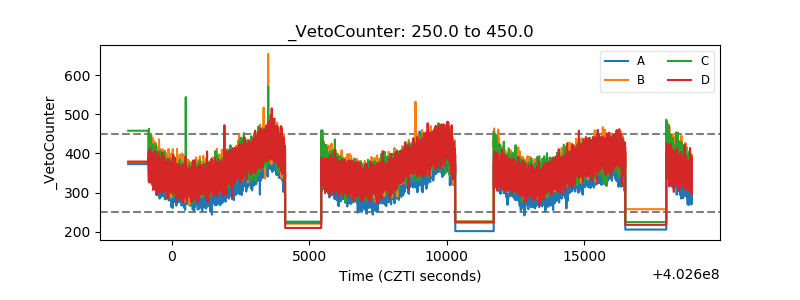 |