| Param | Original file | Final file |
|---|---|---|
| Filename | modeM0/AS1A11_082T01_9000005356_37950cztM0_level2.evt | modeM0/AS1A11_082T01_9000005356_37950cztM0_level2_quad_clean.evt |
| Size (bytes) | 454,478,400 | 67,461,120 |
| Size | 433.4 MB | 64.3 MB |
| Events in quadrant A | 3,343,871 | 413,735 |
| Events in quadrant B | 3,353,405 | 411,521 |
| Events in quadrant C | 2,879,617 | 428,381 |
| Events in quadrant D | 3,797,022 | 387,403 |
| Mode M0 | |||
|---|---|---|---|
| Quadrant | BADHDUFLAG | Total packets | Discarded packets |
| A | 0 | 13672 | 3 |
| B | 0 | 13797 | 2 |
| C | 0 | 12065 | 2 |
| D | 0 | 15324 | 2 |
| Mode SS | |||
|---|---|---|---|
| Quadrant | BADHDUFLAG | Total packets | Discarded packets |
| A | 0 | 116 | 0 |
| B | 0 | 116 | 0 |
| C | 0 | 116 | 0 |
| D | 0 | 116 | 0 |
| Mode M9 | |||
|---|---|---|---|
| Quadrant | BADHDUFLAG | Total packets | Discarded packets |
| A | 0 | 29 | 0 |
| B | 0 | 29 | 0 |
| C | 0 | 29 | 0 |
| D | 0 | 30 | 0 |
| Quadrant | Total seconds | Saturated seconds | Saturation percentage |
|---|---|---|---|
| A | 5745 | 35 | 0.609225% |
| B | 5745 | 236 | 4.107920% |
| C | 5745 | 36 | 0.626632% |
| D | 5745 | 284 | 4.943429% |
Noise dominated data is calculated using 1-second bins in cleaned event files. If a bin has >2000 counts, and if more than 50% of those come from <1% of pixels, then it is considered to be noise-dominated and hence unusable.
| Quadrant | # 1 sec bins | Bins with >0 counts | Bins with >2000 counts | High rate bins dominated by noise | Noise dominated (total time) | Noise dominated (detector-on time) | Marked lightcurve |
|---|---|---|---|---|---|---|---|
| A | 7388 | 5746 | 20 | 20 | 0.27% | 0.35% | 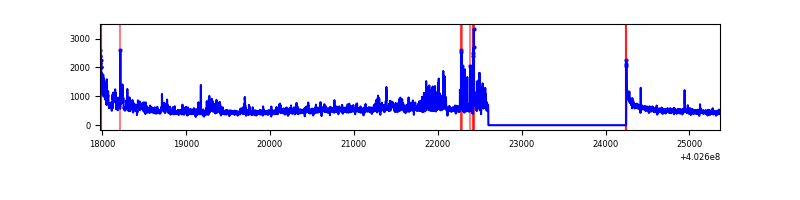 |
| B | 7388 | 5746 | 140 | 140 | 1.89% | 2.44% | 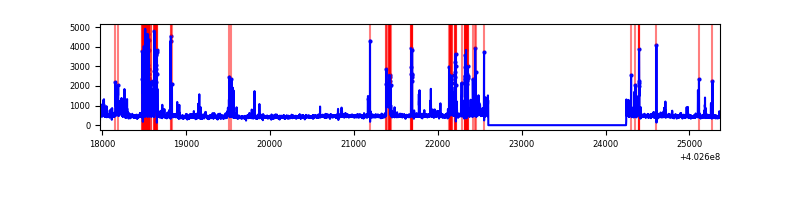 |
| C | 7388 | 5746 | 23 | 23 | 0.31% | 0.40% | 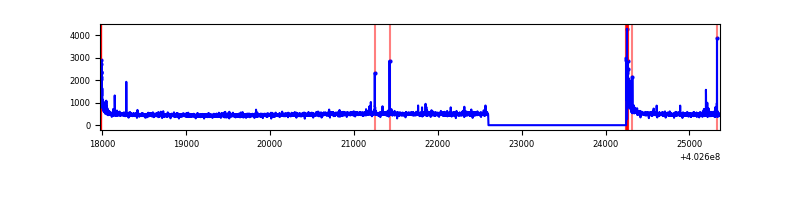 |
| D | 7388 | 5746 | 219 | 219 | 2.96% | 3.81% | 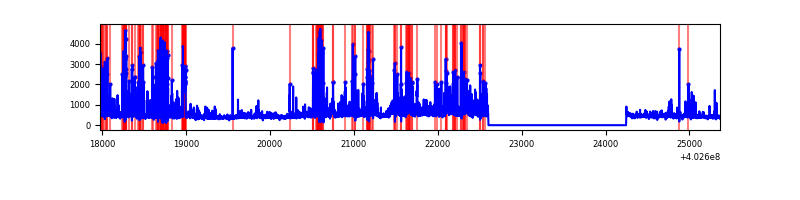 |
Top three noisy pixels from each quadrant. If the there are fewer than three noisy pixels in the level2.evt file, extra rows are filled as -1
| Pixel properties | Quadrant properties | ||||||
|---|---|---|---|---|---|---|---|
| Quadrant | DetID | PixID | Counts | Sigma | Mean | Median | Sigma |
| A | 15 | 222 | 459376 | 3552.79 | 638 | 623 | 129.1 |
| A | 10 | 83 | 377849 | 2921.41 | 638 | 623 | 129.1 |
| A | 13 | 6 | 13969 | 103.36 | 638 | 623 | 129.1 |
| B | 5 | 172 | 312557 | 2601.61 | 628 | 612 | 119.9 |
| B | 0 | 229 | 281790 | 2345.01 | 628 | 612 | 119.9 |
| B | 5 | 184 | 145985 | 1212.4 | 628 | 612 | 119.9 |
| C | 15 | 214 | 242648 | 1658.41 | 628 | 630 | 145.9 |
| C | 0 | 10 | 140045 | 955.33 | 628 | 630 | 145.9 |
| C | 14 | 254 | 42180 | 284.72 | 628 | 630 | 145.9 |
| D | 1 | 52 | 1146939 | 7695.85 | 610 | 591 | 149.0 |
| D | 7 | 55 | 82960 | 552.97 | 610 | 591 | 149.0 |
| D | 10 | 199 | 42655 | 282.39 | 610 | 591 | 149.0 |
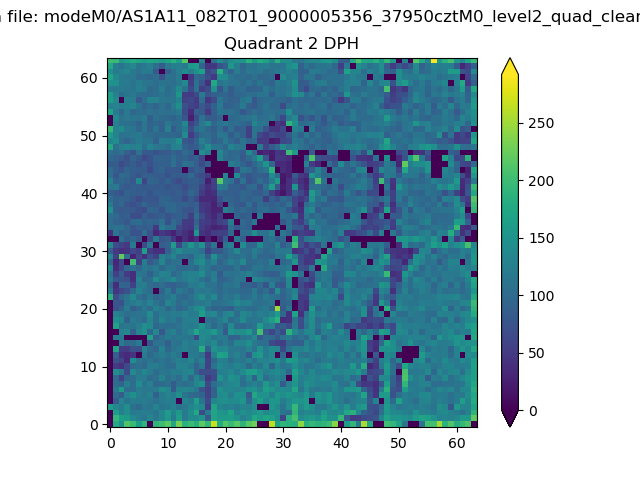
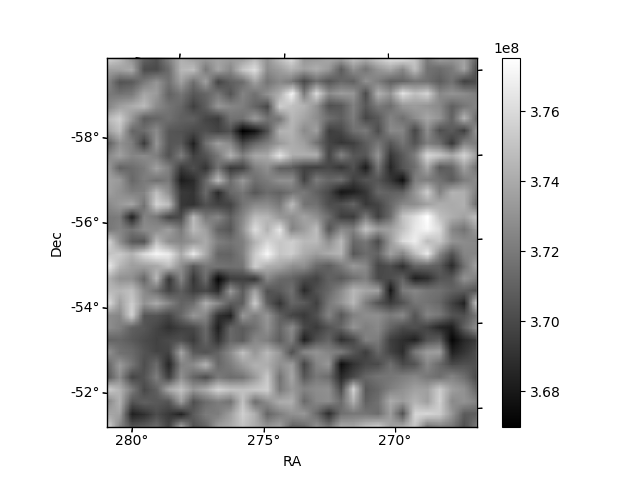
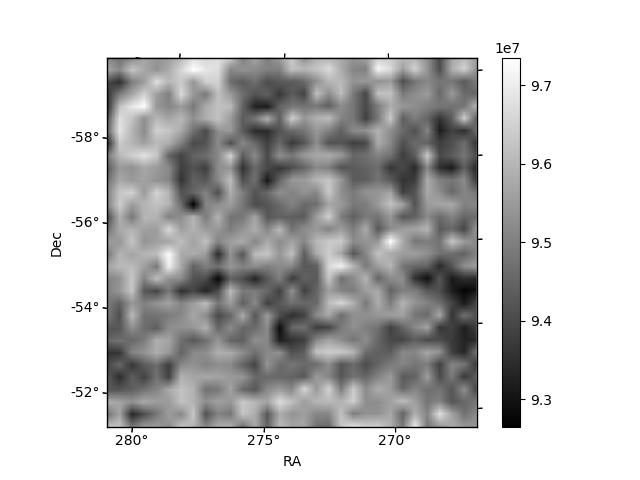
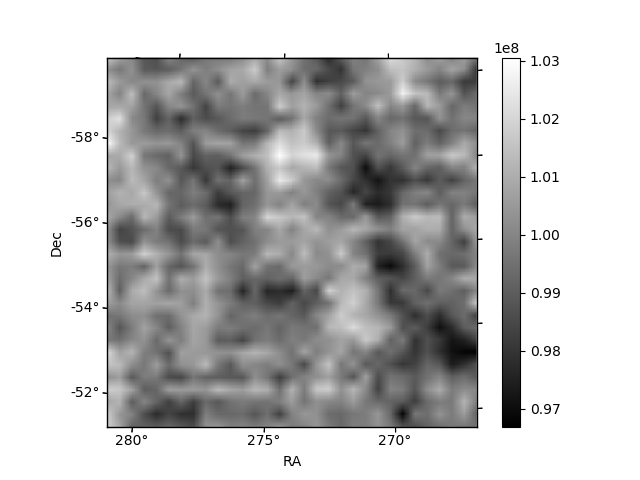
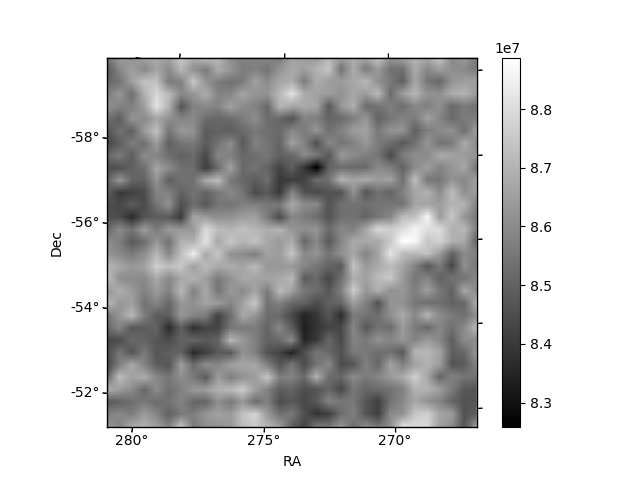
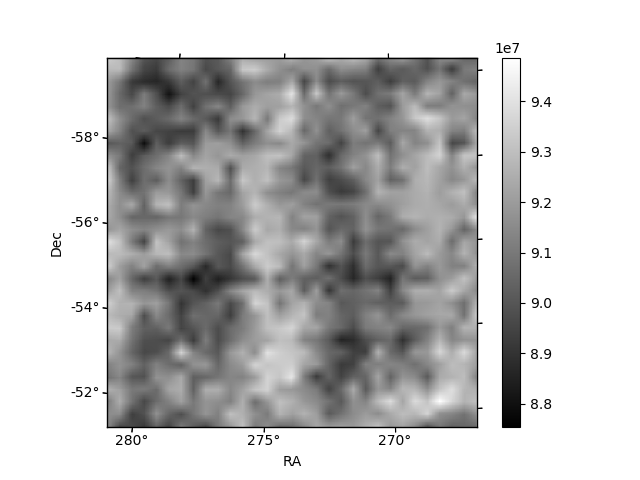
Histogram calculated using DETX and DETY for each event in the final _common_clean file
| Quadrant A | 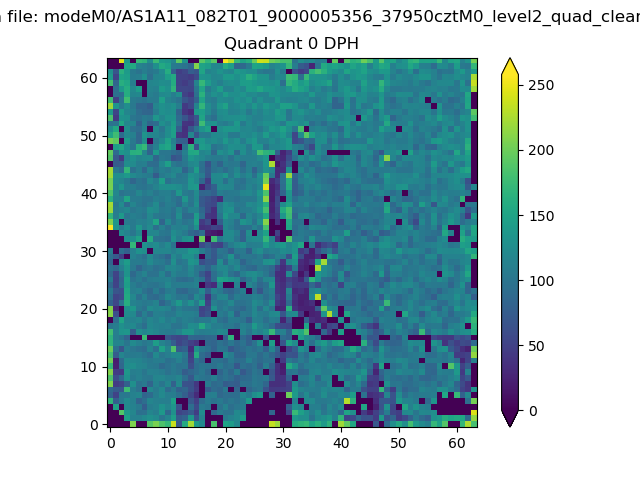 |
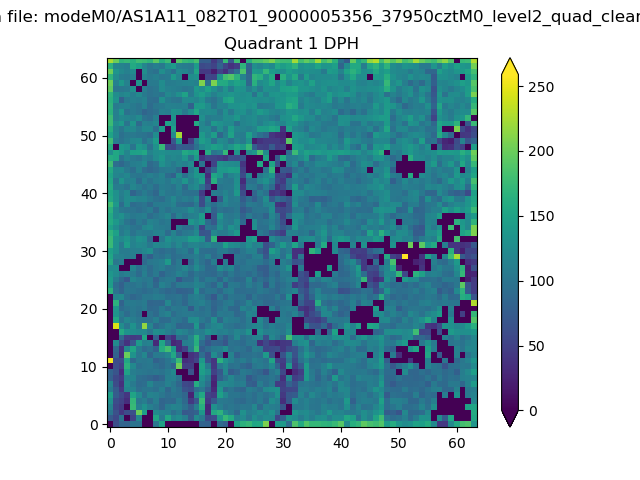 |
Quadrant B |
|---|---|---|---|
| Quadrant D | 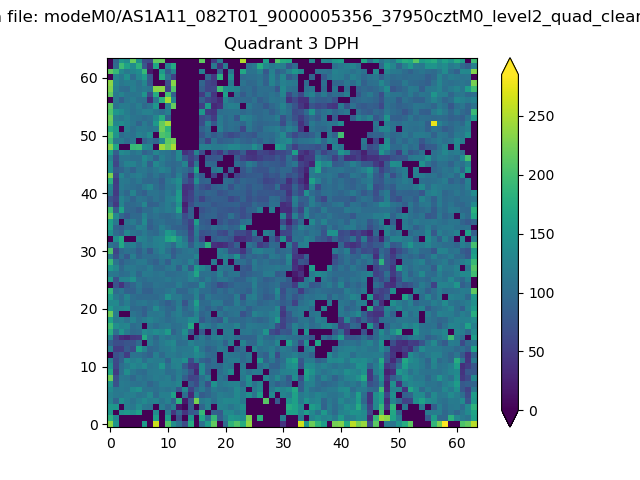 |
 |
Quadrant C |
| Plot type | Count rate plots | Images |
|---|---|---|
| Comparison with Poisson distribution Blue bars denote a histogram of data divided into 1 sec bins. Red curve is a Poisson curve with rate = median count rate of data. |
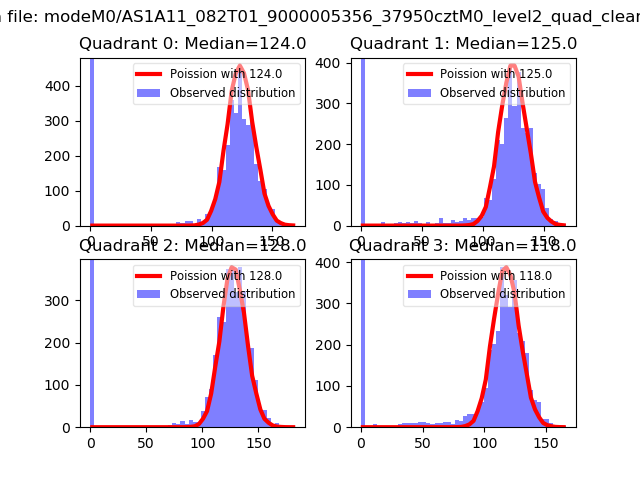 |
 |
| Quadrant-wise count rates Data is divided into 100 sec bins |
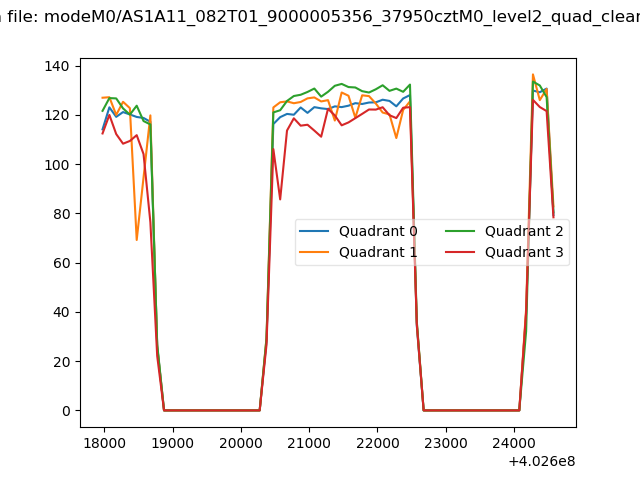 |
|
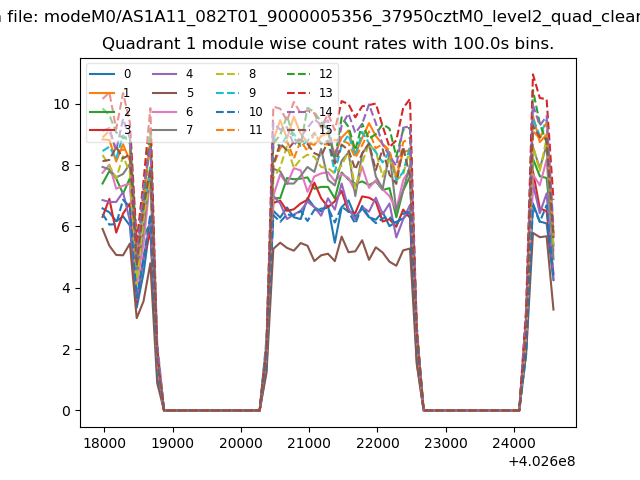
| Module-wise count rates for Quadrant A Data is divided into 100 sec bins |
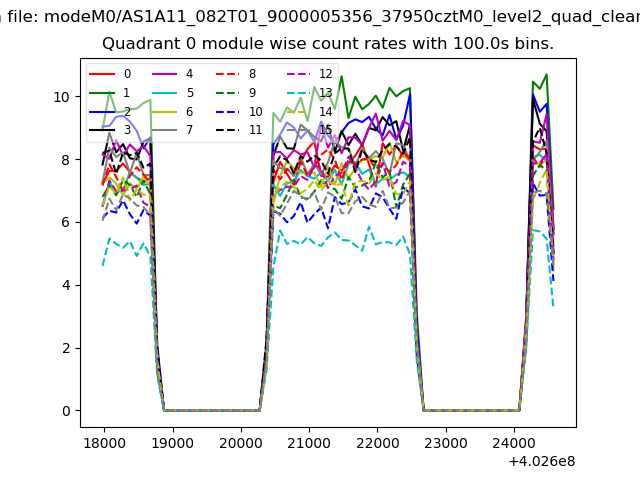 |
 |
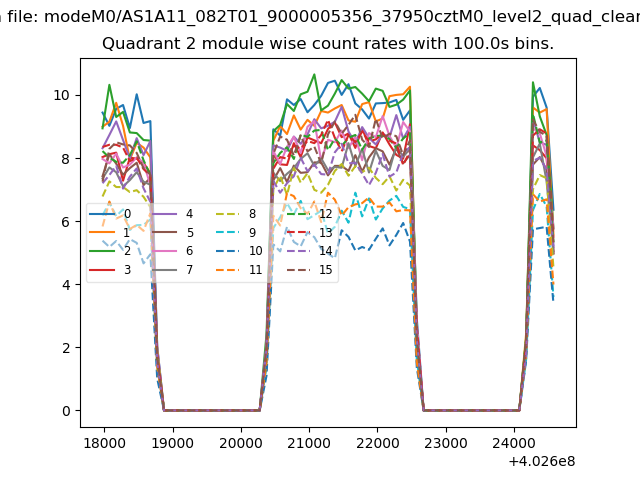
| Module-wise count rates for Quadrant B Data is divided into 100 sec bins |
 |
 |
| Module-wise count rates for Quadrant C Data is divided into 100 sec bins |
 |
 |
| Module-wise count rates for Quadrant D Data is divided into 100 sec bins |
 |
 |
| Parameter | Plot |
|---|---|
| CZT HV Monitor | 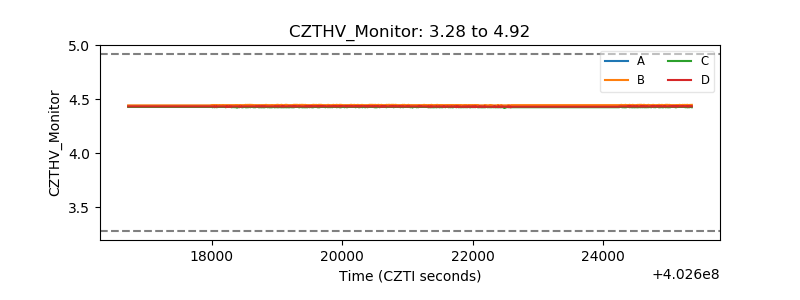 |
| D_VDD | 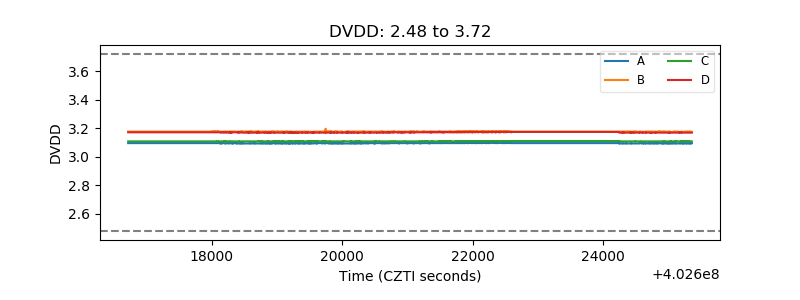 |
| Temperature 1 | 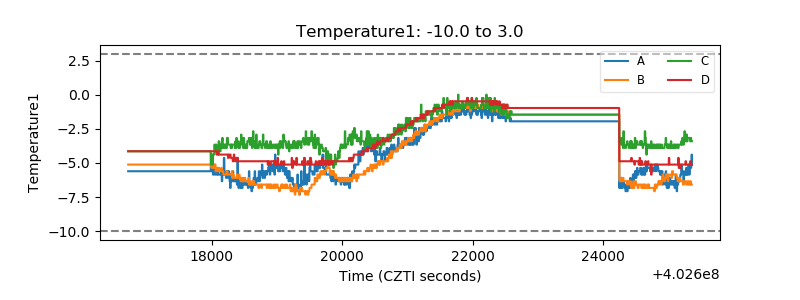 |
| Veto HV Monitor | 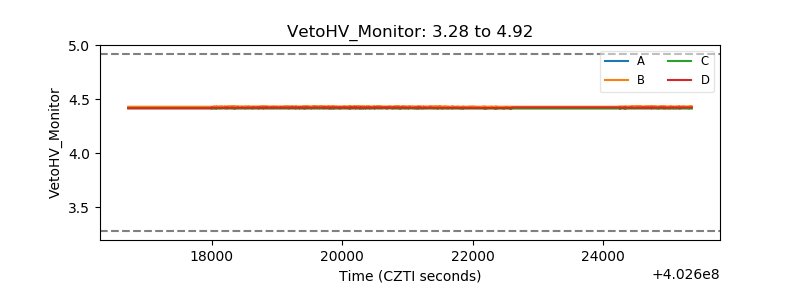 |
| Veto LLD | 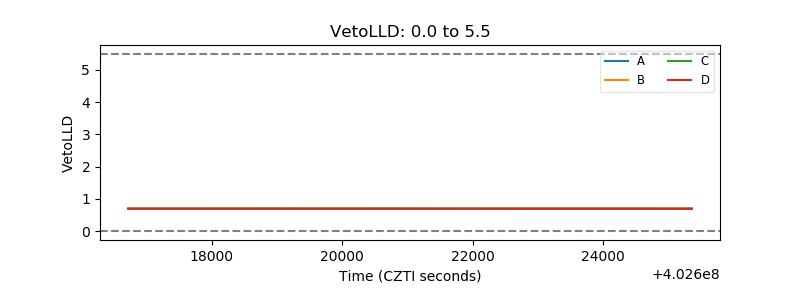 |
| Alpha Counter | 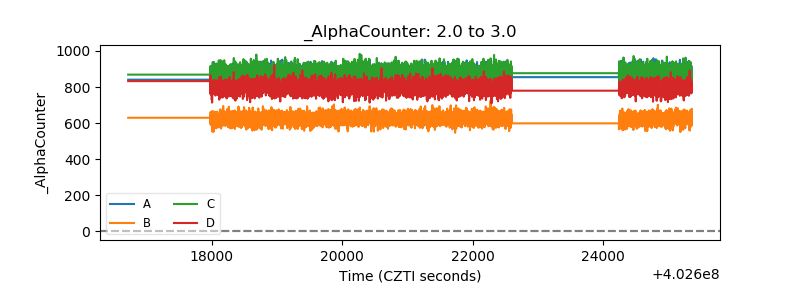 |
| _CPM_Rate | 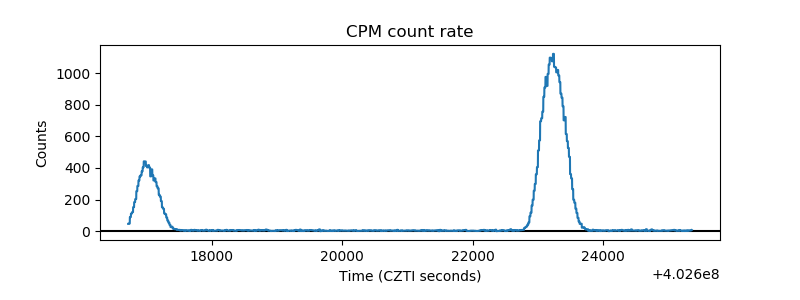 |
| CZT Counter | 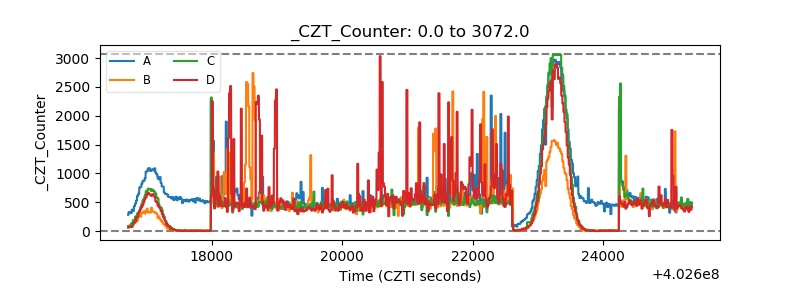 |
| +2.5 Volts monitor | 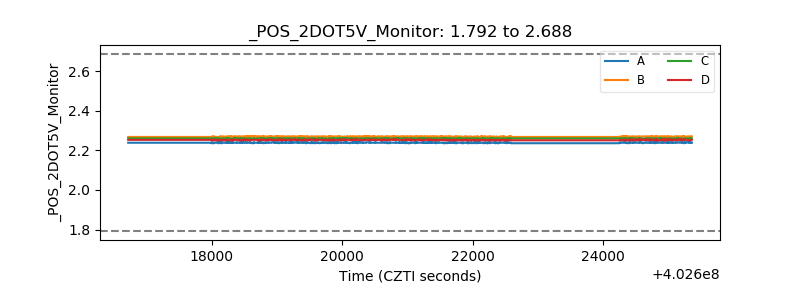 |
| +5 Volts monitor | 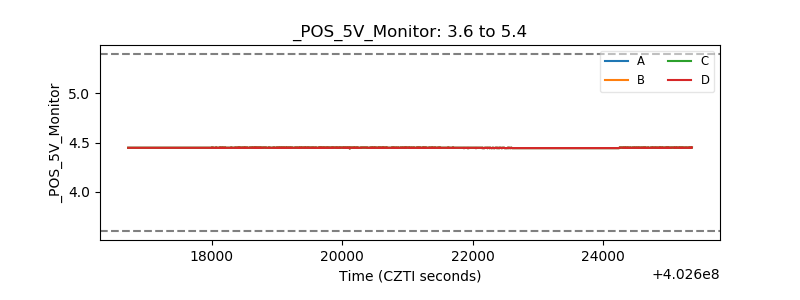 |
| _ROLL_ROT | 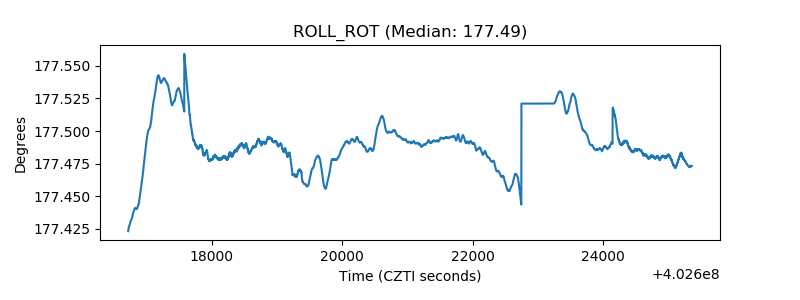 |
| _Roll_DEC | 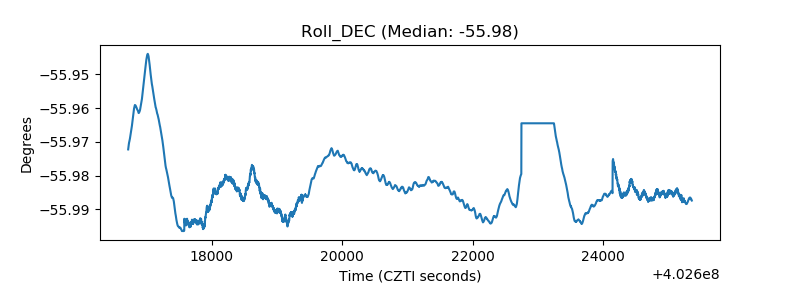 |
| _Roll_RA | 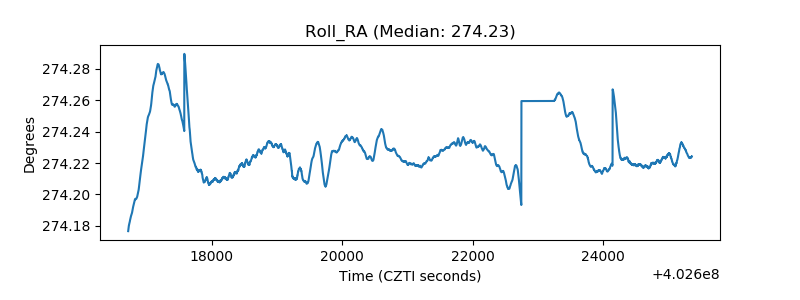 |
| Veto Counter | 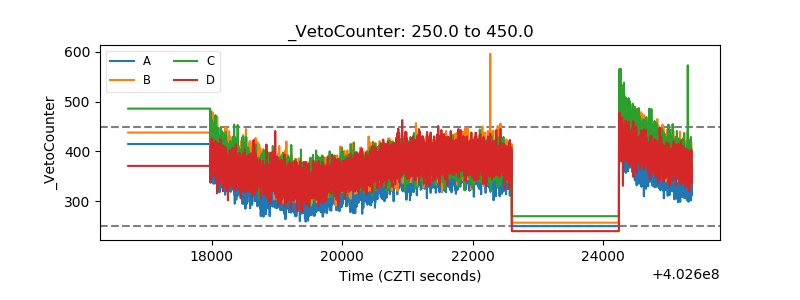 |