| Param | Original file | Final file |
|---|---|---|
| Filename | modeM0/AS1A11_082T01_9000005356_37952cztM0_level2.evt | modeM0/AS1A11_082T01_9000005356_37952cztM0_level2_quad_clean.evt |
| Size (bytes) | 453,672,000 | 59,541,120 |
| Size | 432.7 MB | 56.8 MB |
| Events in quadrant A | 3,111,002 | 354,225 |
| Events in quadrant B | 3,880,812 | 352,103 |
| Events in quadrant C | 2,915,464 | 367,452 |
| Events in quadrant D | 3,452,967 | 338,060 |
| Mode M0 | |||
|---|---|---|---|
| Quadrant | BADHDUFLAG | Total packets | Discarded packets |
| A | 0 | 12790 | 3 |
| B | 0 | 15305 | 2 |
| C | 0 | 11910 | 2 |
| D | 0 | 14061 | 2 |
| Mode SS | |||
|---|---|---|---|
| Quadrant | BADHDUFLAG | Total packets | Discarded packets |
| A | 0 | 114 | 0 |
| B | 0 | 114 | 0 |
| C | 0 | 114 | 0 |
| D | 0 | 114 | 0 |
| Mode M9 | |||
|---|---|---|---|
| Quadrant | BADHDUFLAG | Total packets | Discarded packets |
| A | 0 | 26 | 0 |
| B | 0 | 26 | 0 |
| C | 0 | 26 | 0 |
| D | 0 | 27 | 0 |
| Quadrant | Total seconds | Saturated seconds | Saturation percentage |
|---|---|---|---|
| A | 5582 | 23 | 0.412039% |
| B | 5582 | 353 | 6.323898% |
| C | 5582 | 42 | 0.752418% |
| D | 5582 | 165 | 2.955930% |
Noise dominated data is calculated using 1-second bins in cleaned event files. If a bin has >2000 counts, and if more than 50% of those come from <1% of pixels, then it is considered to be noise-dominated and hence unusable.
| Quadrant | # 1 sec bins | Bins with >0 counts | Bins with >2000 counts | High rate bins dominated by noise | Noise dominated (total time) | Noise dominated (detector-on time) | Marked lightcurve |
|---|---|---|---|---|---|---|---|
| A | 7345 | 5583 | 13 | 13 | 0.18% | 0.23% | 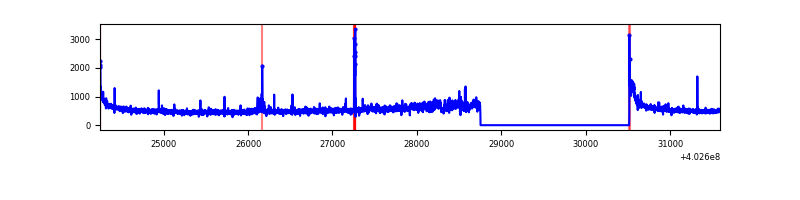 |
| B | 7345 | 5583 | 243 | 243 | 3.31% | 4.35% | 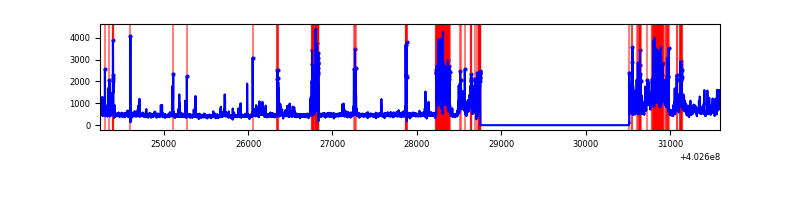 |
| C | 7345 | 5583 | 23 | 23 | 0.31% | 0.41% | 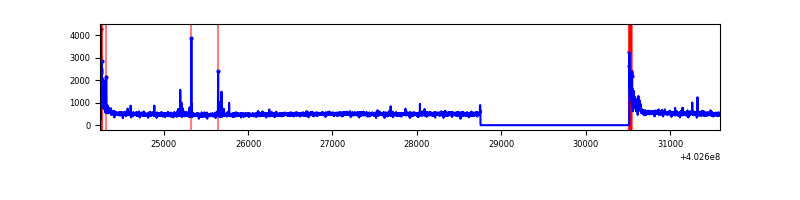 |
| D | 7345 | 5583 | 139 | 139 | 1.89% | 2.49% | 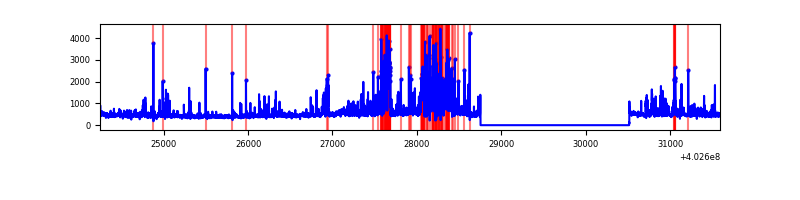 |
Top three noisy pixels from each quadrant. If the there are fewer than three noisy pixels in the level2.evt file, extra rows are filled as -1
| Pixel properties | Quadrant properties | ||||||
|---|---|---|---|---|---|---|---|
| Quadrant | DetID | PixID | Counts | Sigma | Mean | Median | Sigma |
| A | 10 | 83 | 364429 | 2859.42 | 634 | 622 | 127.2 |
| A | 15 | 222 | 204622 | 1603.38 | 634 | 622 | 127.2 |
| A | 5 | 98 | 31941 | 246.16 | 634 | 622 | 127.2 |
| B | 5 | 172 | 883925 | 7399.25 | 624 | 606 | 119.4 |
| B | 5 | 184 | 479509 | 4011.6 | 624 | 606 | 119.4 |
| B | 5 | 200 | 42641 | 352.11 | 624 | 606 | 119.4 |
| C | 15 | 214 | 237553 | 1608.16 | 629 | 632 | 147.3 |
| C | 0 | 10 | 179950 | 1217.17 | 629 | 632 | 147.3 |
| C | 14 | 254 | 40481 | 270.49 | 629 | 632 | 147.3 |
| D | 1 | 52 | 712572 | 4742.46 | 618 | 601 | 150.1 |
| D | 13 | 249 | 89426 | 591.67 | 618 | 601 | 150.1 |
| D | 2 | 250 | 76087 | 502.81 | 618 | 601 | 150.1 |
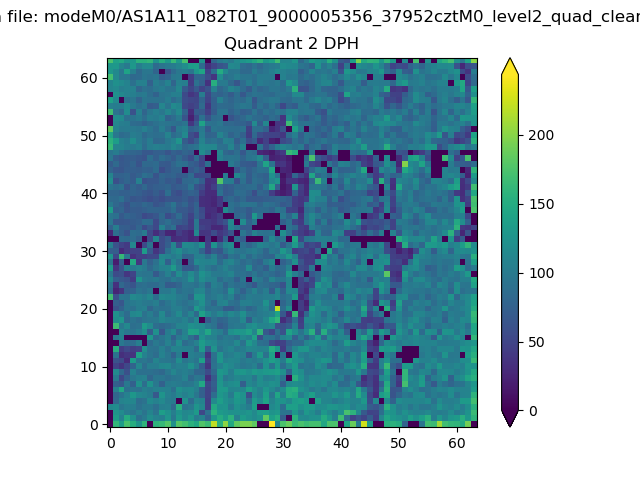
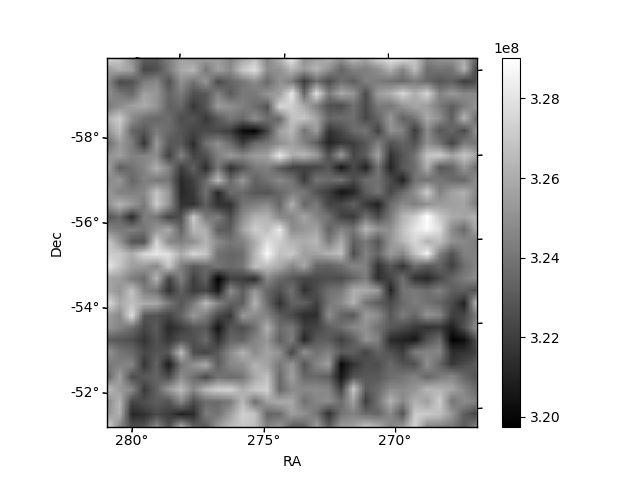
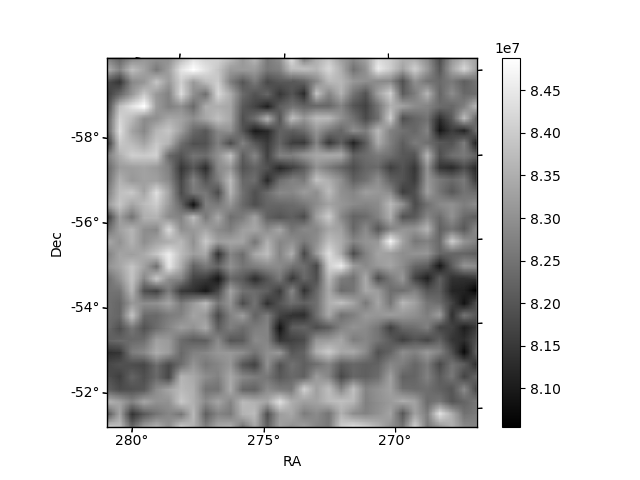
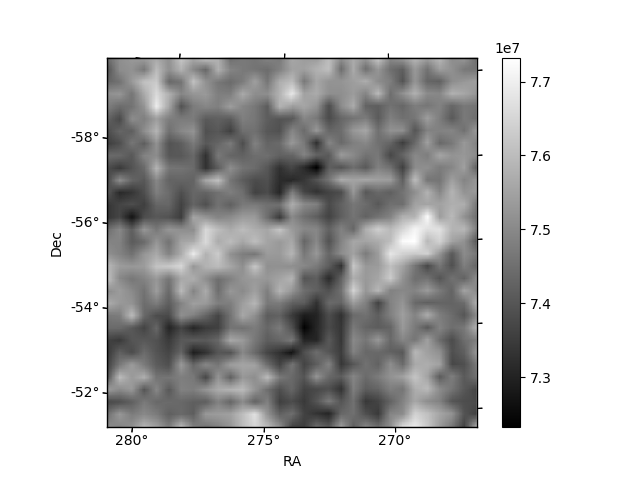
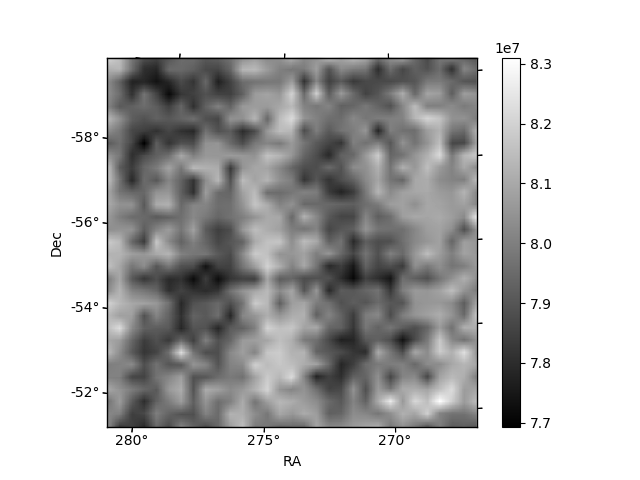
Histogram calculated using DETX and DETY for each event in the final _common_clean file
| Quadrant A | 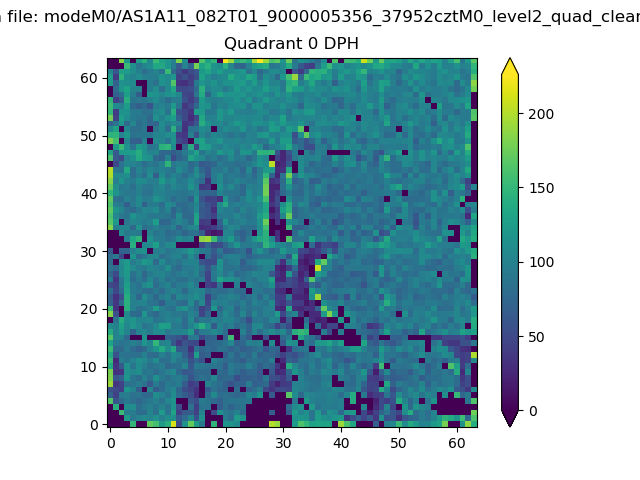 |
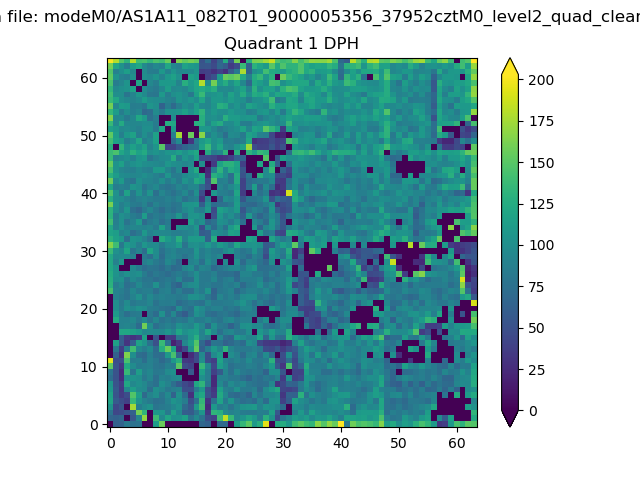 |
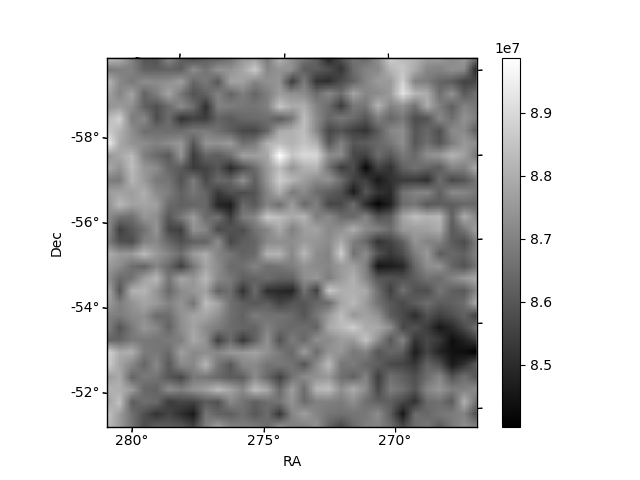
Quadrant B |
|---|---|---|---|
| Quadrant D | 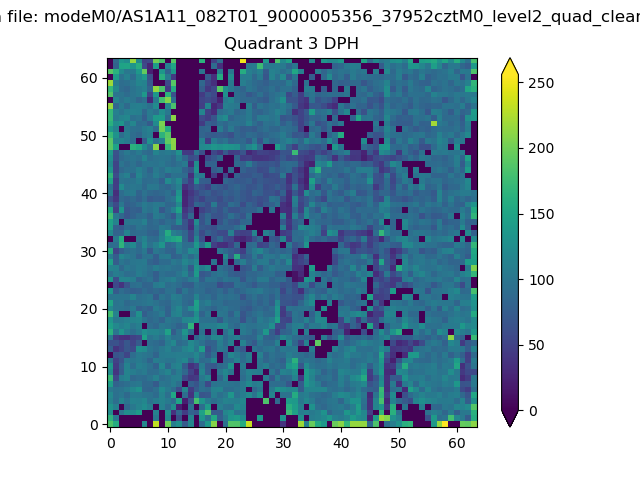 |
 |
Quadrant C |
| Plot type | Count rate plots | Images |
|---|---|---|
| Comparison with Poisson distribution Blue bars denote a histogram of data divided into 1 sec bins. Red curve is a Poisson curve with rate = median count rate of data. |
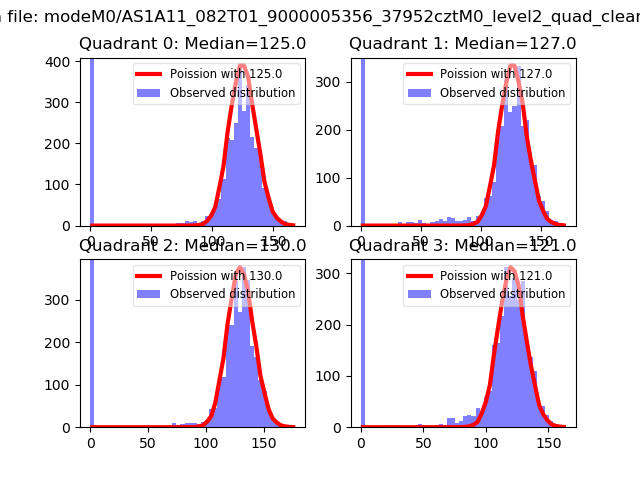 |
 |
| Quadrant-wise count rates Data is divided into 100 sec bins |
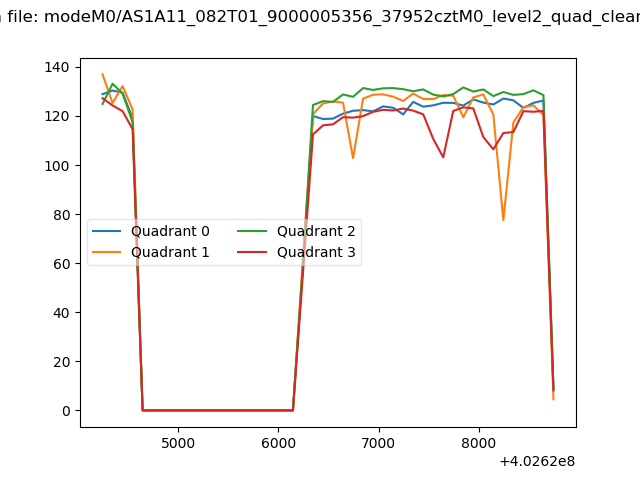 |
|
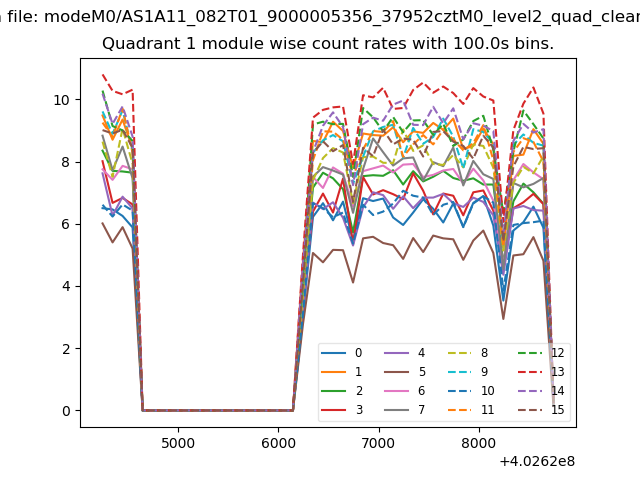
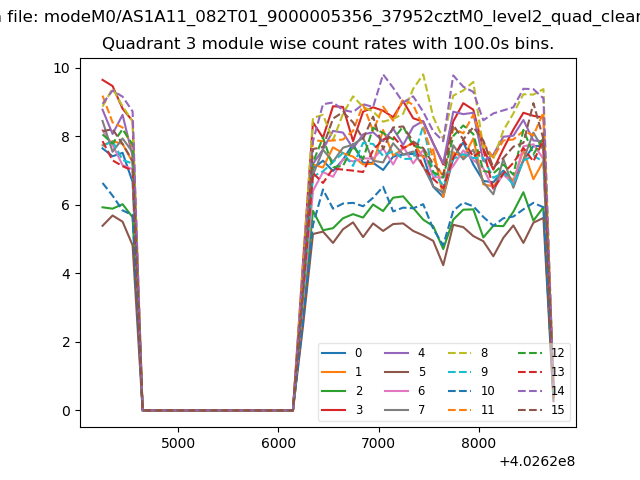
| Module-wise count rates for Quadrant A Data is divided into 100 sec bins |
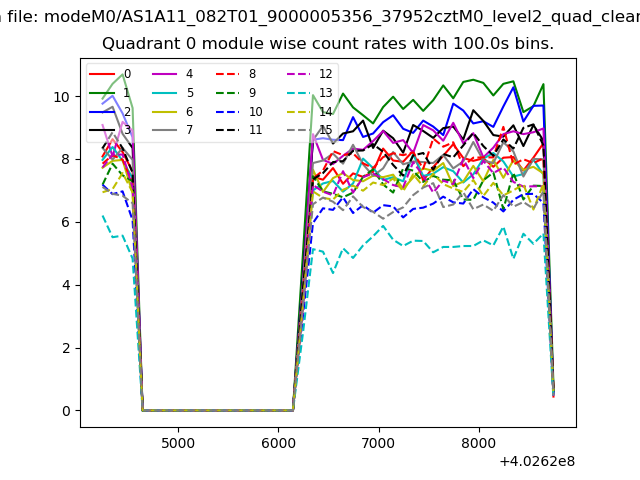 |
 |
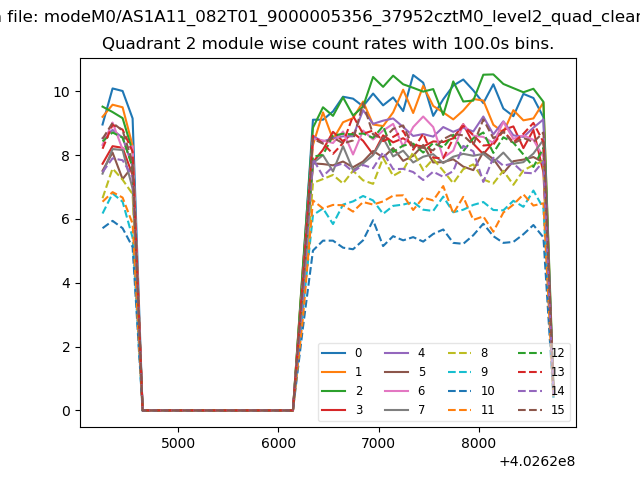
| Module-wise count rates for Quadrant B Data is divided into 100 sec bins |
 |
 |
| Module-wise count rates for Quadrant C Data is divided into 100 sec bins |
 |
 |
| Module-wise count rates for Quadrant D Data is divided into 100 sec bins |
 |
 |
| Parameter | Plot |
|---|---|
| CZT HV Monitor | 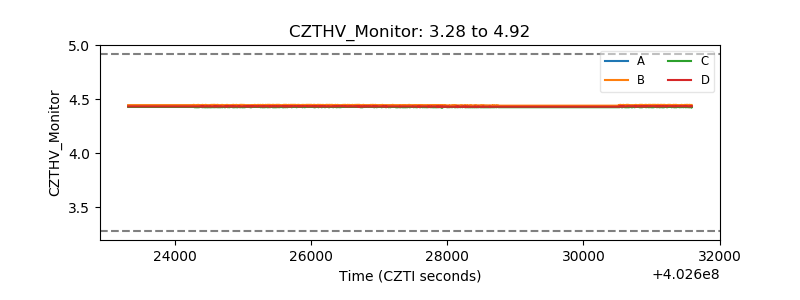 |
| D_VDD | 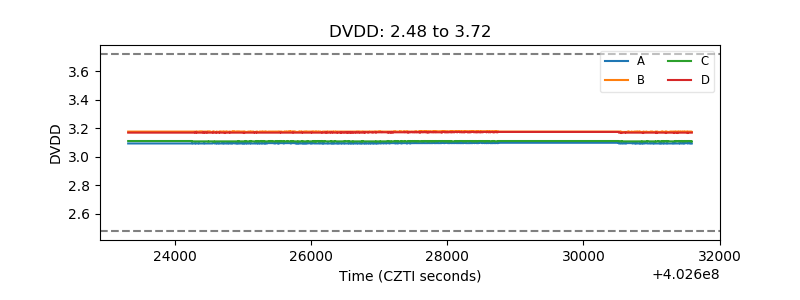 |
| Temperature 1 | 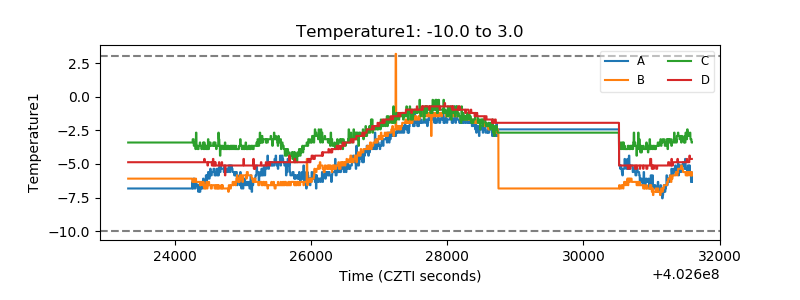 |
| Veto HV Monitor |  |
| Veto LLD | 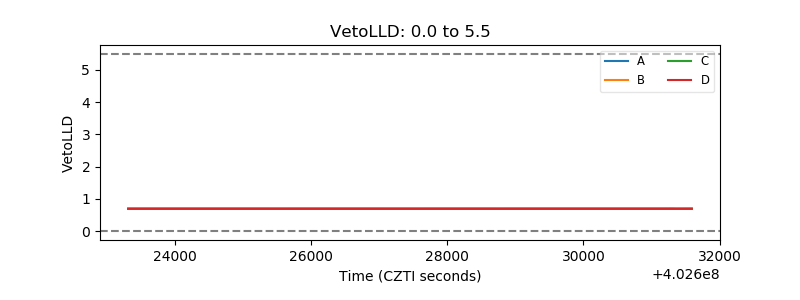 |
| Alpha Counter | 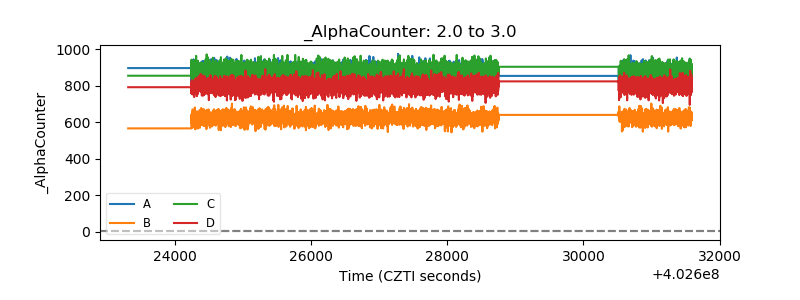 |
| _CPM_Rate | 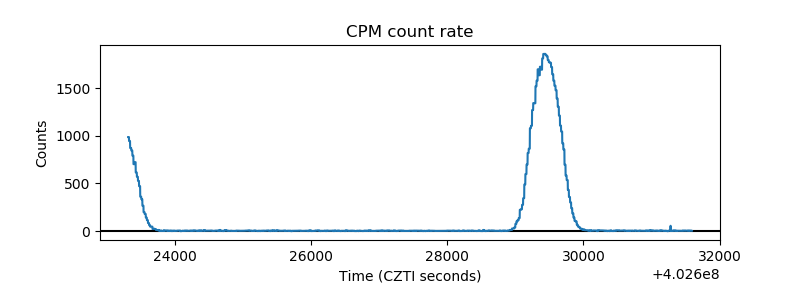 |
| CZT Counter | 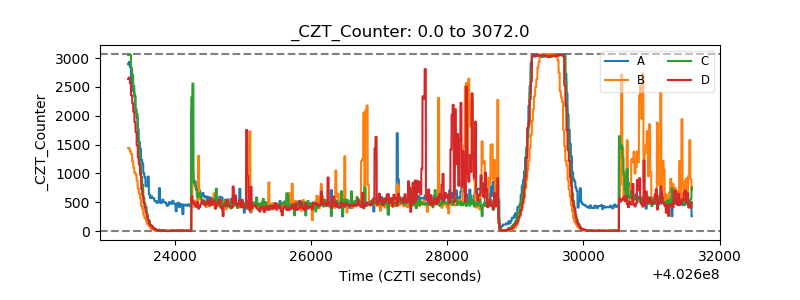 |
| +2.5 Volts monitor | 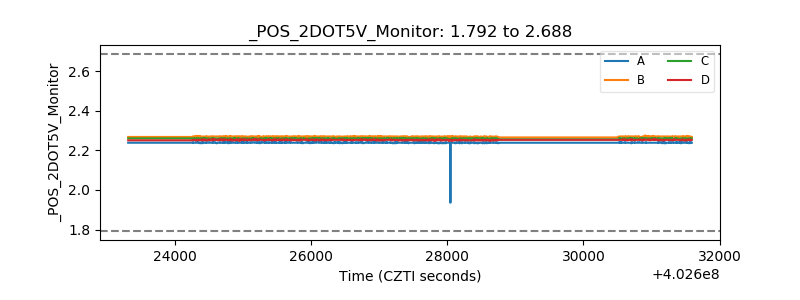 |
| +5 Volts monitor | 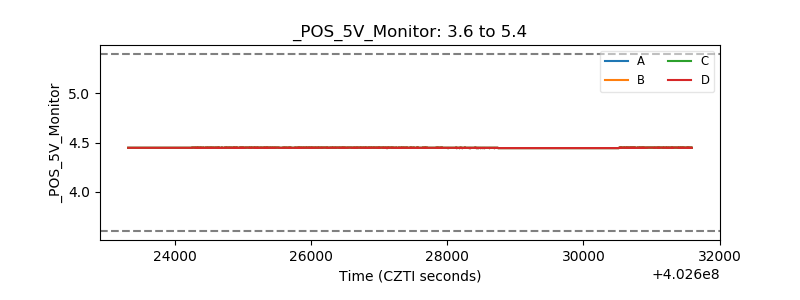 |
| _ROLL_ROT | 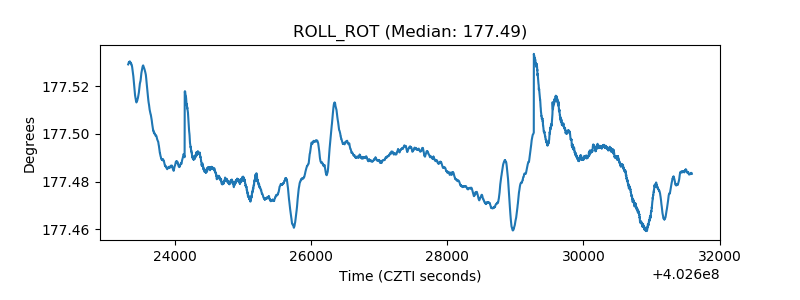 |
| _Roll_DEC | 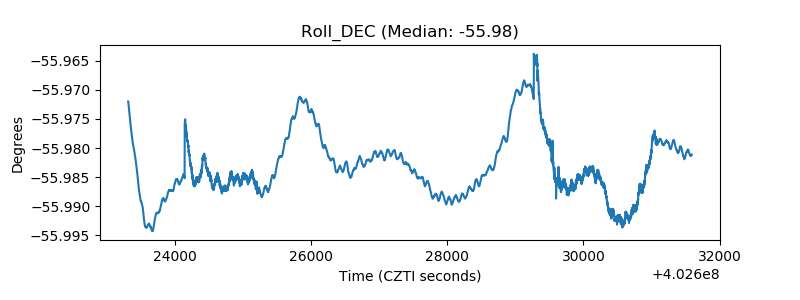 |
| _Roll_RA | 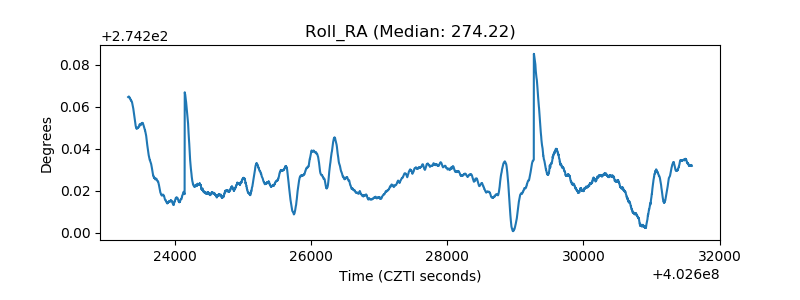 |
| Veto Counter | 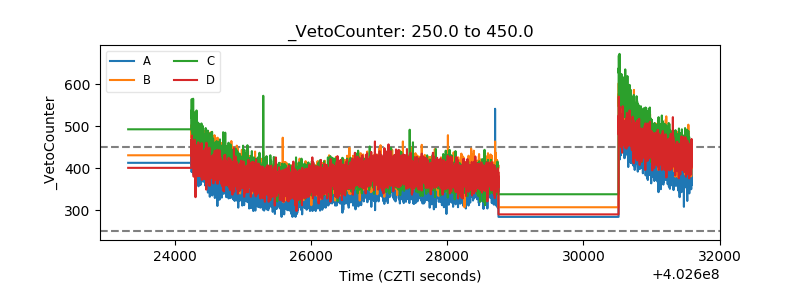 |