| Param | Original file | Final file |
|---|---|---|
| Filename | modeM0/AS1A11_082T01_9000005356_37953cztM0_level2.evt | modeM0/AS1A11_082T01_9000005356_37953cztM0_level2_quad_clean.evt |
| Size (bytes) | 461,139,840 | 58,089,600 |
| Size | 439.8 MB | 55.4 MB |
| Events in quadrant A | 2,842,470 | 349,241 |
| Events in quadrant B | 4,293,083 | 342,728 |
| Events in quadrant C | 3,047,211 | 366,449 |
| Events in quadrant D | 3,433,400 | 339,226 |
| Mode M0 | |||
|---|---|---|---|
| Quadrant | BADHDUFLAG | Total packets | Discarded packets |
| A | 0 | 11448 | 3 |
| B | 0 | 16143 | 2 |
| C | 0 | 12032 | 2 |
| D | 0 | 13462 | 2 |
| Mode SS | |||
|---|---|---|---|
| Quadrant | BADHDUFLAG | Total packets | Discarded packets |
| A | 0 | 106 | 0 |
| B | 0 | 106 | 0 |
| C | 0 | 106 | 0 |
| D | 0 | 106 | 0 |
| Mode M9 | |||
|---|---|---|---|
| Quadrant | BADHDUFLAG | Total packets | Discarded packets |
| A | 0 | 24 | 0 |
| B | 0 | 24 | 0 |
| C | 0 | 24 | 0 |
| D | 0 | 25 | 0 |
| Quadrant | Total seconds | Saturated seconds | Saturation percentage |
|---|---|---|---|
| A | 5148 | 19 | 0.369075% |
| B | 5148 | 437 | 8.488733% |
| C | 5148 | 141 | 2.738928% |
| D | 5148 | 139 | 2.700078% |
Noise dominated data is calculated using 1-second bins in cleaned event files. If a bin has >2000 counts, and if more than 50% of those come from <1% of pixels, then it is considered to be noise-dominated and hence unusable.
| Quadrant | # 1 sec bins | Bins with >0 counts | Bins with >2000 counts | High rate bins dominated by noise | Noise dominated (total time) | Noise dominated (detector-on time) | Marked lightcurve |
|---|---|---|---|---|---|---|---|
| A | 7061 | 5149 | 5 | 5 | 0.07% | 0.10% | 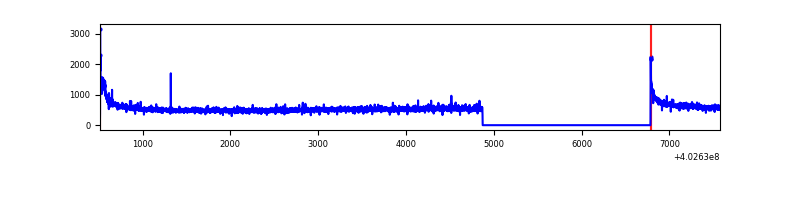 |
| B | 7061 | 5149 | 288 | 288 | 4.08% | 5.59% | 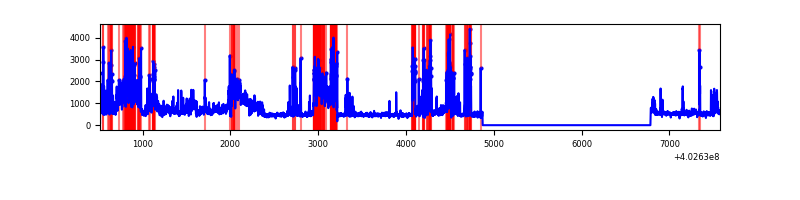 |
| C | 7061 | 5149 | 97 | 97 | 1.37% | 1.88% | 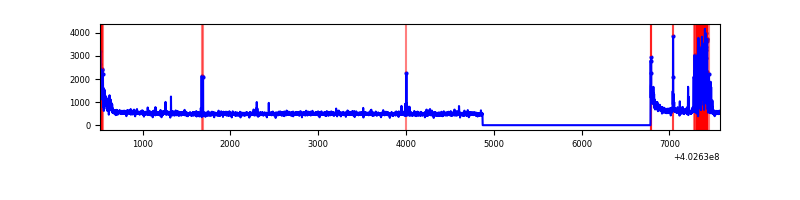 |
| D | 7061 | 5149 | 103 | 103 | 1.46% | 2.00% | 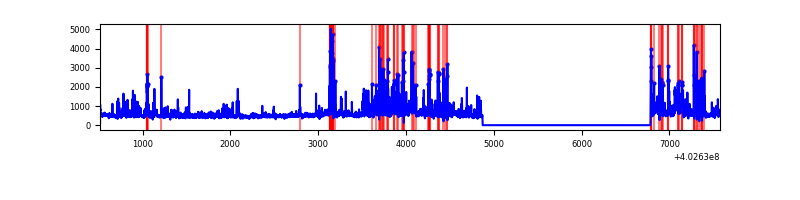 |
Top three noisy pixels from each quadrant. If the there are fewer than three noisy pixels in the level2.evt file, extra rows are filled as -1
| Pixel properties | Quadrant properties | ||||||
|---|---|---|---|---|---|---|---|
| Quadrant | DetID | PixID | Counts | Sigma | Mean | Median | Sigma |
| A | 10 | 83 | 343825 | 2780.68 | 612 | 600 | 123.4 |
| A | 15 | 222 | 82684 | 665.01 | 612 | 600 | 123.4 |
| A | 5 | 98 | 31715 | 252.08 | 612 | 600 | 123.4 |
| B | 5 | 184 | 1235925 | 10989.24 | 595 | 578 | 112.4 |
| B | 5 | 172 | 700742 | 6228.43 | 595 | 578 | 112.4 |
| B | 4 | 81 | 13635 | 116.15 | 595 | 578 | 112.4 |
| C | 15 | 159 | 302035 | 2187.09 | 600 | 604 | 137.8 |
| C | 15 | 214 | 221230 | 1600.8 | 600 | 604 | 137.8 |
| C | 0 | 10 | 153453 | 1109.03 | 600 | 604 | 137.8 |
| D | 1 | 52 | 686899 | 4781.96 | 596 | 581 | 143.5 |
| D | 13 | 249 | 140684 | 976.18 | 596 | 581 | 143.5 |
| D | 7 | 223 | 137237 | 952.16 | 596 | 581 | 143.5 |
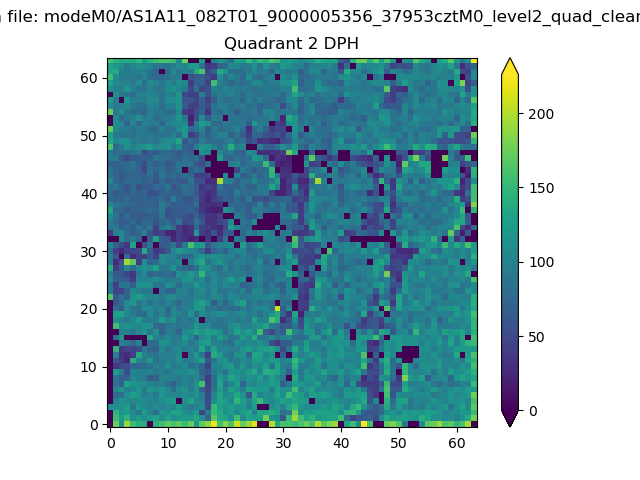
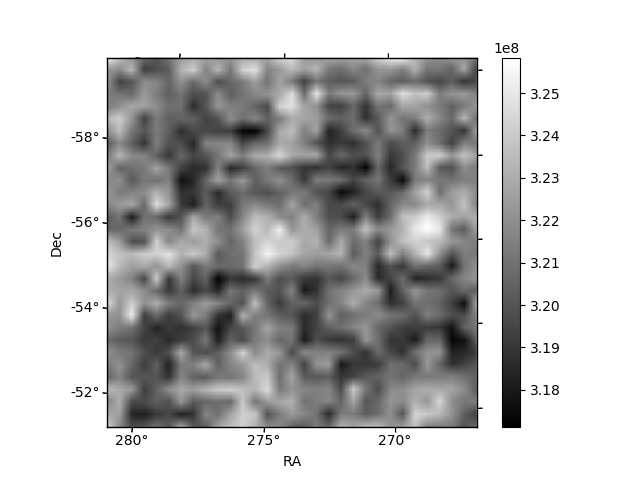
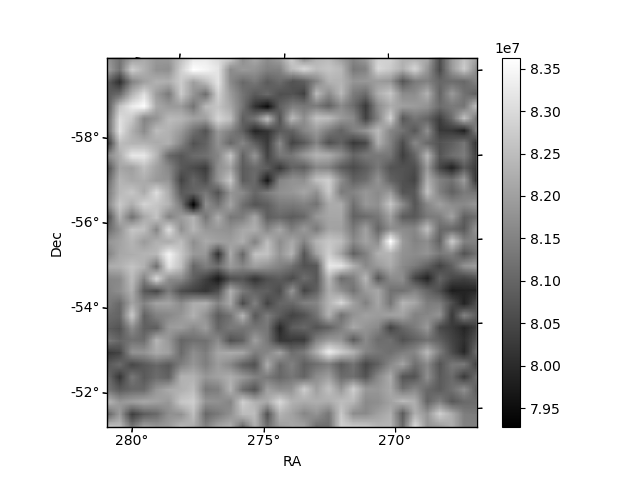
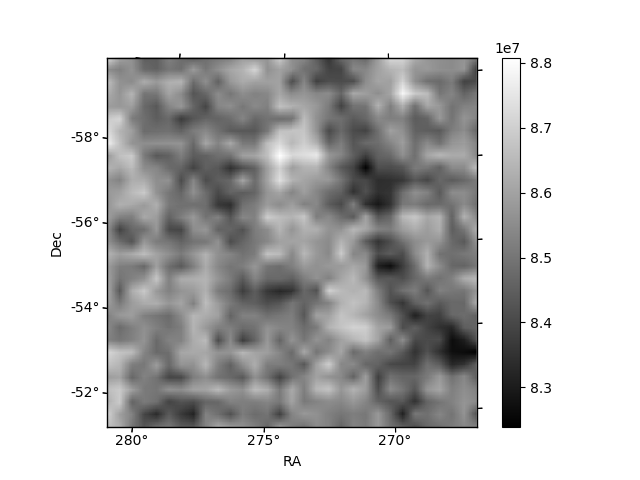
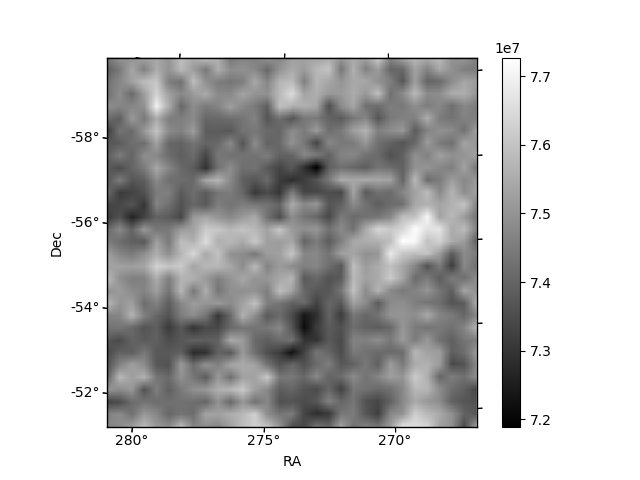
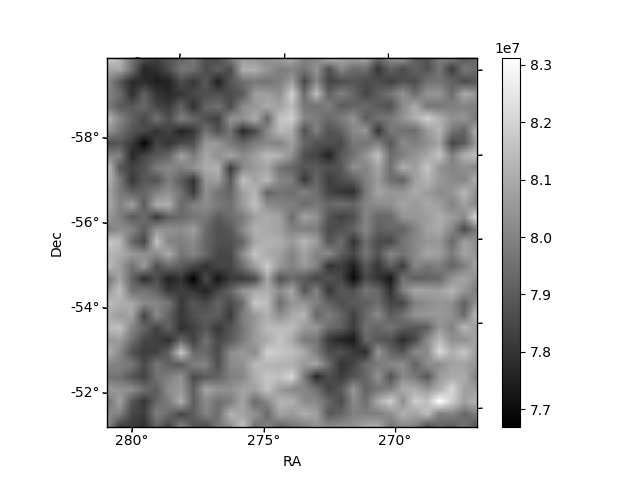
Histogram calculated using DETX and DETY for each event in the final _common_clean file
| Quadrant A | 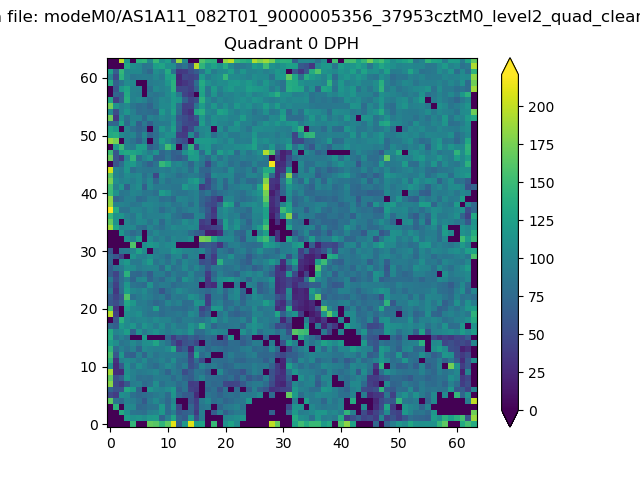 |
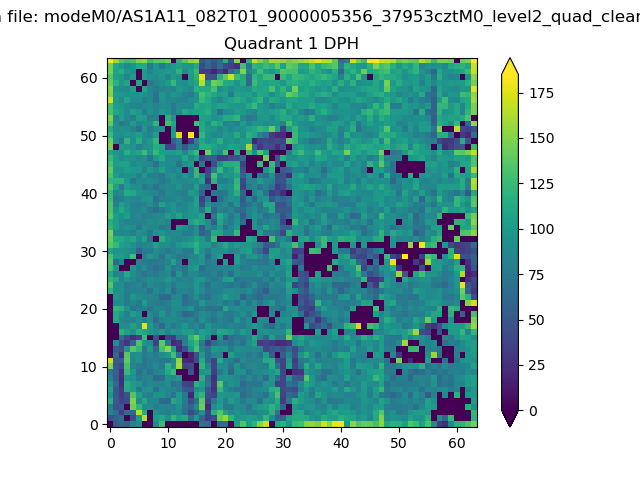 |
Quadrant B |
|---|---|---|---|
| Quadrant D | 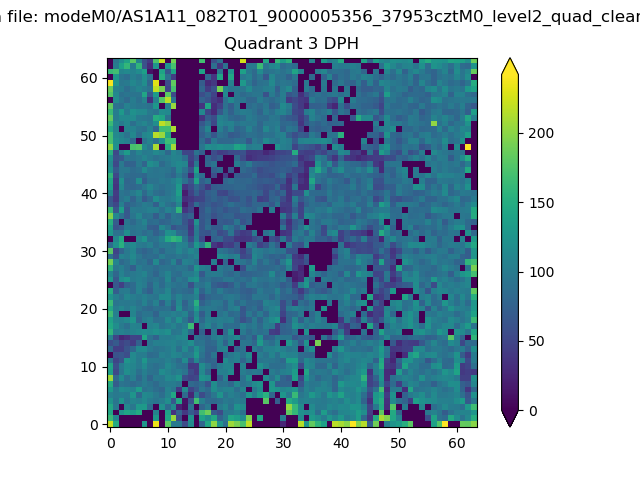 |
 |
Quadrant C |
| Plot type | Count rate plots | Images |
|---|---|---|
| Comparison with Poisson distribution Blue bars denote a histogram of data divided into 1 sec bins. Red curve is a Poisson curve with rate = median count rate of data. |
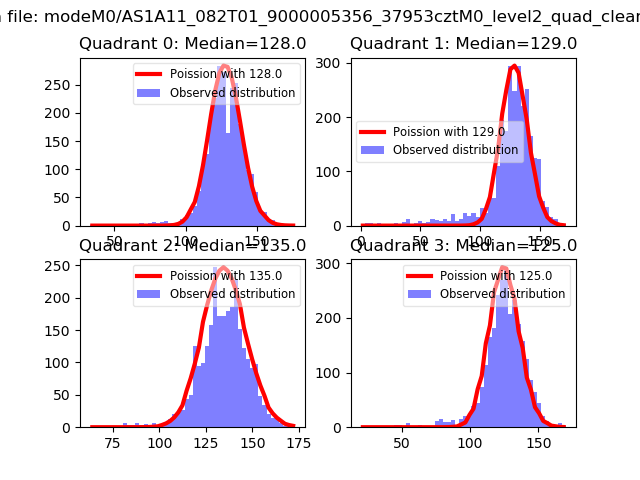 |
 |
| Quadrant-wise count rates Data is divided into 100 sec bins |
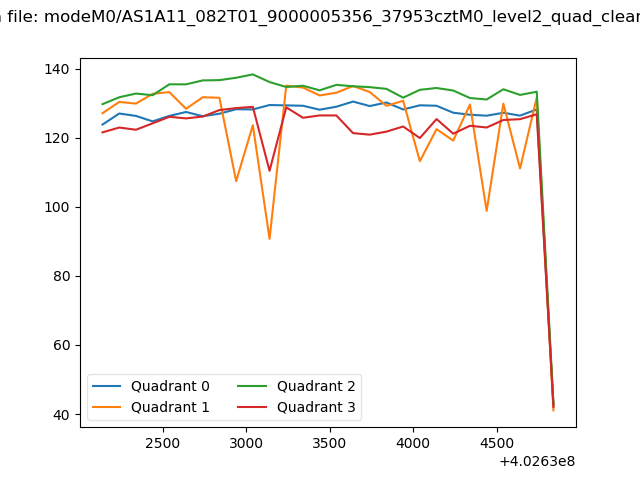 |
|
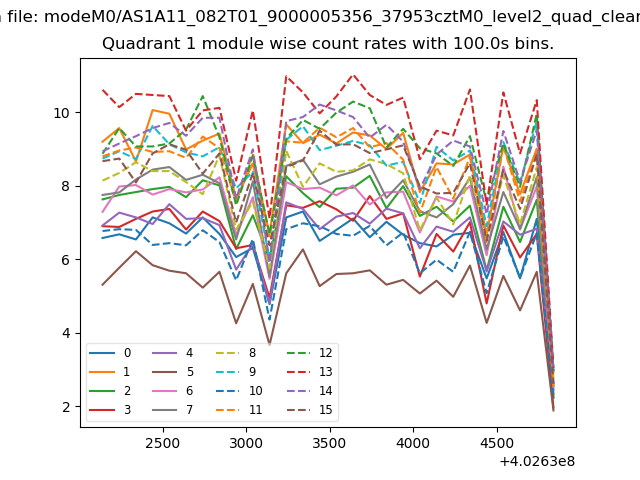
| Module-wise count rates for Quadrant A Data is divided into 100 sec bins |
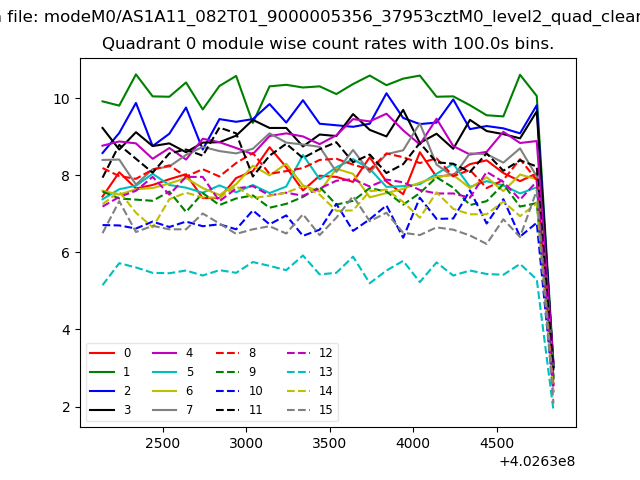 |
 |
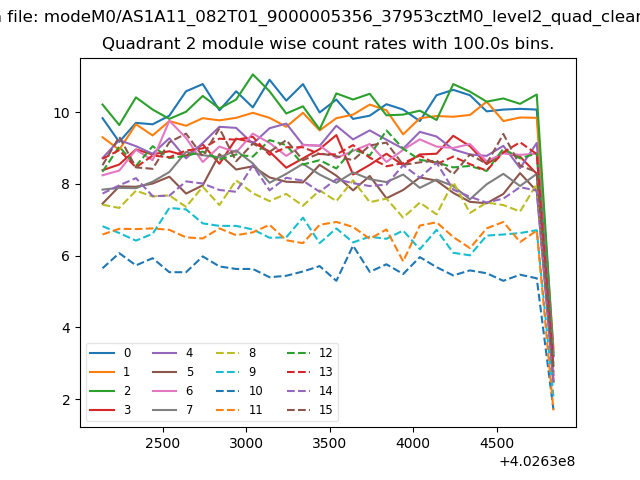
| Module-wise count rates for Quadrant B Data is divided into 100 sec bins |
 |
 |
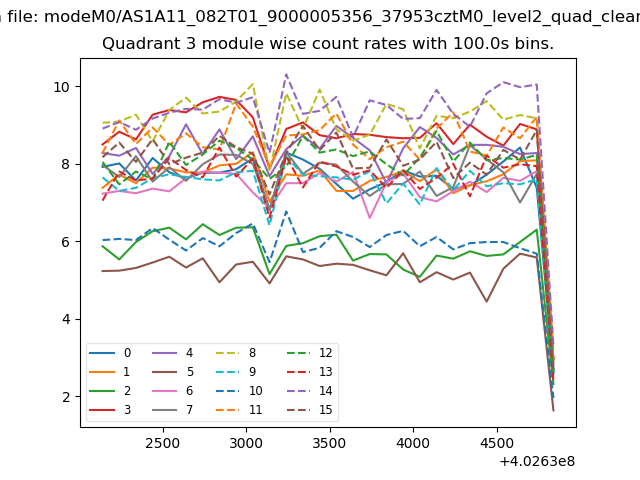
| Module-wise count rates for Quadrant C Data is divided into 100 sec bins |
 |
 |
| Module-wise count rates for Quadrant D Data is divided into 100 sec bins |
 |
 |
| Parameter | Plot |
|---|---|
| CZT HV Monitor | 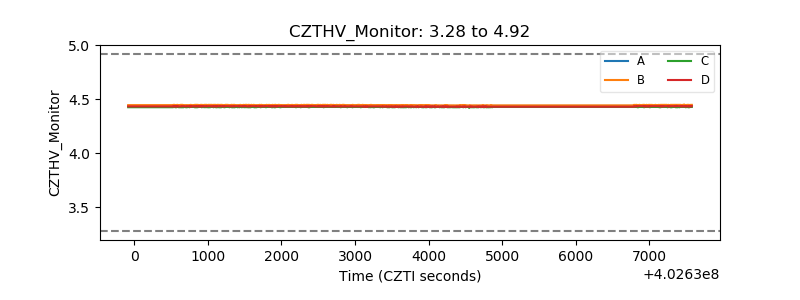 |
| D_VDD | 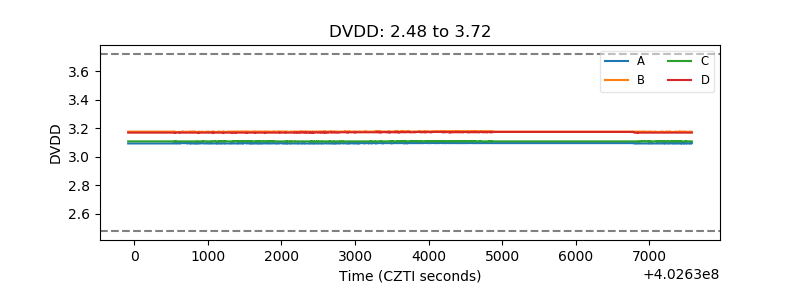 |
| Temperature 1 | 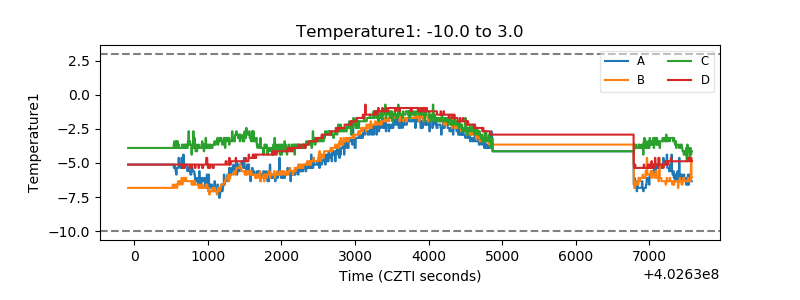 |
| Veto HV Monitor | 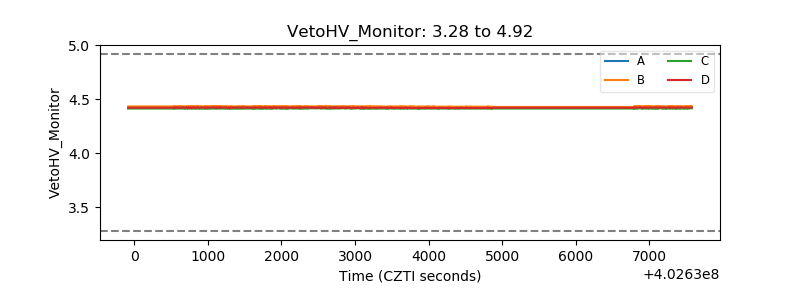 |
| Veto LLD | 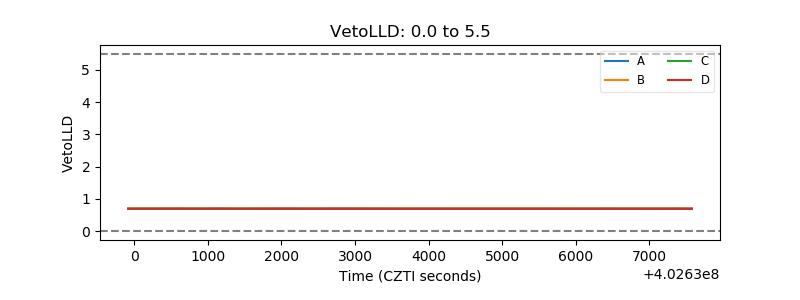 |
| Alpha Counter | 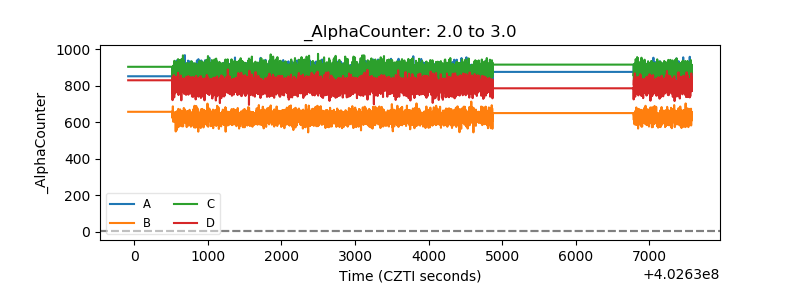 |
| _CPM_Rate | 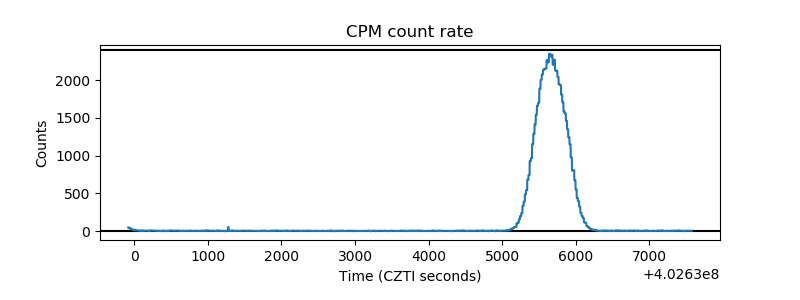 |
| CZT Counter | 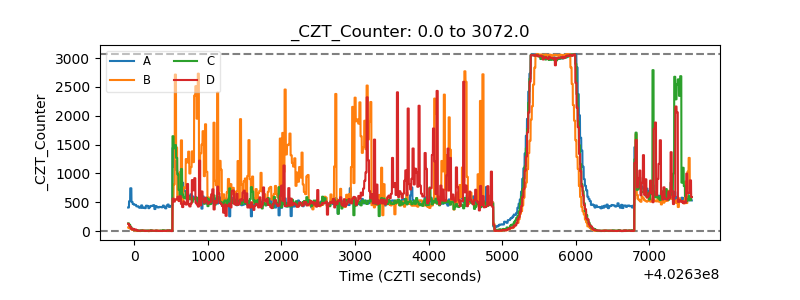 |
| +2.5 Volts monitor | 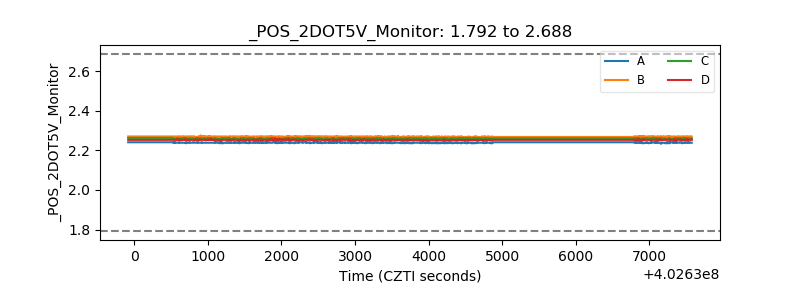 |
| +5 Volts monitor | 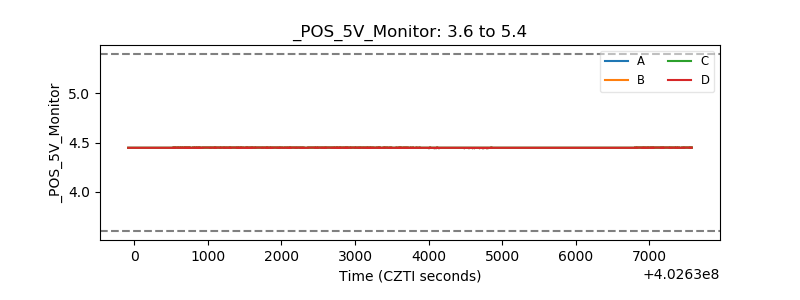 |
| _ROLL_ROT |  |
| _Roll_DEC | 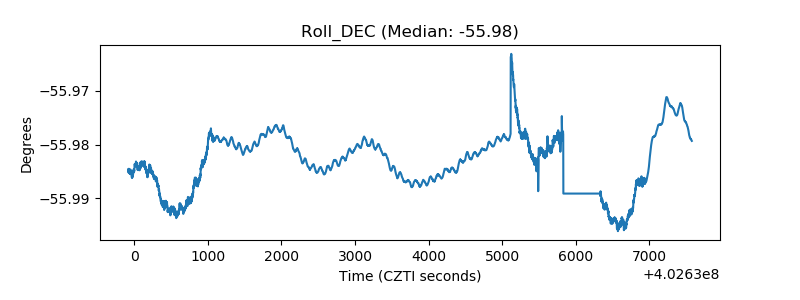 |
| _Roll_RA | 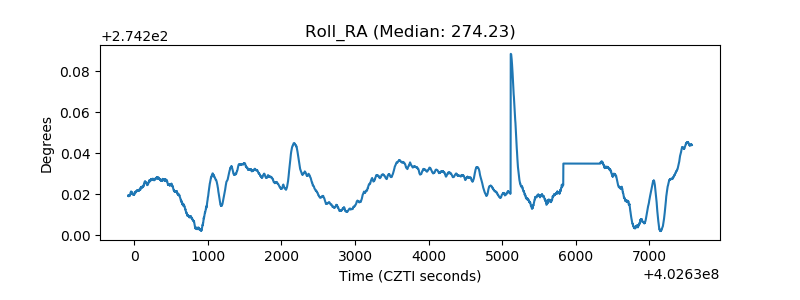 |
| Veto Counter | 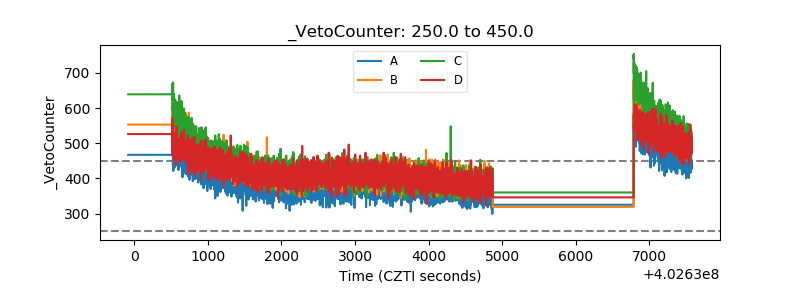 |