| Param | Original file | Final file |
|---|---|---|
| Filename | modeM0/AS1A11_082T01_9000005356_37954cztM0_level2.evt | modeM0/AS1A11_082T01_9000005356_37954cztM0_level2_quad_clean.evt |
| Size (bytes) | 450,561,600 | 67,610,880 |
| Size | 429.7 MB | 64.5 MB |
| Events in quadrant A | 3,282,782 | 416,660 |
| Events in quadrant B | 2,796,291 | 430,307 |
| Events in quadrant C | 3,082,485 | 438,605 |
| Events in quadrant D | 4,138,749 | 405,145 |
| Mode M0 | |||
|---|---|---|---|
| Quadrant | BADHDUFLAG | Total packets | Discarded packets |
| A | 0 | 13131 | 3 |
| B | 0 | 11310 | 2 |
| C | 0 | 12086 | 2 |
| D | 0 | 15733 | 2 |
| Mode SS | |||
|---|---|---|---|
| Quadrant | BADHDUFLAG | Total packets | Discarded packets |
| A | 0 | 104 | 0 |
| B | 0 | 104 | 0 |
| C | 0 | 104 | 0 |
| D | 0 | 104 | 0 |
| Mode M9 | |||
|---|---|---|---|
| Quadrant | BADHDUFLAG | Total packets | Discarded packets |
| A | 0 | 23 | 0 |
| B | 0 | 23 | 0 |
| C | 0 | 23 | 0 |
| D | 0 | 24 | 0 |
| Quadrant | Total seconds | Saturated seconds | Saturation percentage |
|---|---|---|---|
| A | 5084 | 17 | 0.334382% |
| B | 5084 | 51 | 1.003147% |
| C | 5084 | 136 | 2.675059% |
| D | 5084 | 174 | 3.422502% |
Noise dominated data is calculated using 1-second bins in cleaned event files. If a bin has >2000 counts, and if more than 50% of those come from <1% of pixels, then it is considered to be noise-dominated and hence unusable.
| Quadrant | # 1 sec bins | Bins with >0 counts | Bins with >2000 counts | High rate bins dominated by noise | Noise dominated (total time) | Noise dominated (detector-on time) | Marked lightcurve |
|---|---|---|---|---|---|---|---|
| A | 7088 | 5085 | 7 | 7 | 0.10% | 0.14% | 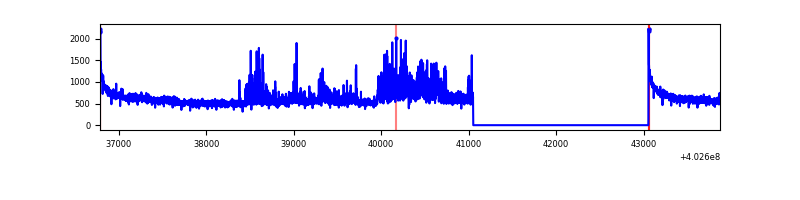 |
| B | 7088 | 5085 | 18 | 18 | 0.25% | 0.35% | 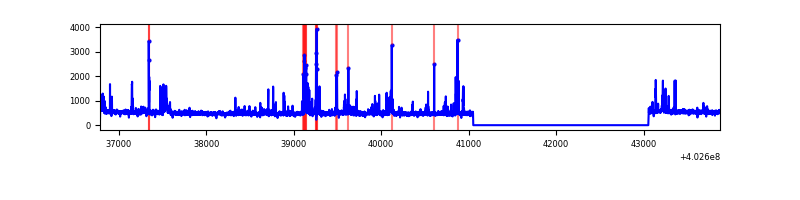 |
| C | 7088 | 5085 | 92 | 92 | 1.30% | 1.81% | 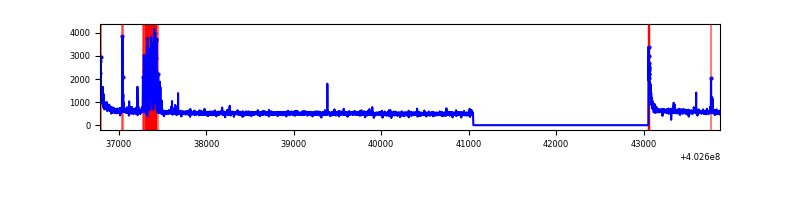 |
| D | 7088 | 5085 | 150 | 150 | 2.12% | 2.95% | 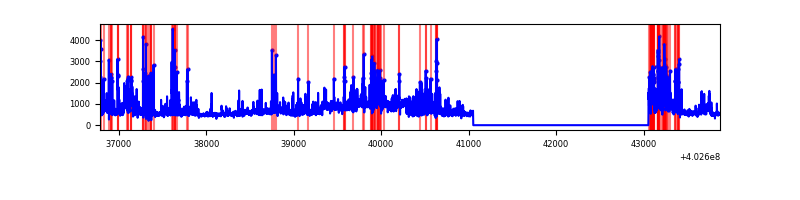 |
Top three noisy pixels from each quadrant. If the there are fewer than three noisy pixels in the level2.evt file, extra rows are filled as -1
| Pixel properties | Quadrant properties | ||||||
|---|---|---|---|---|---|---|---|
| Quadrant | DetID | PixID | Counts | Sigma | Mean | Median | Sigma |
| A | 15 | 222 | 478409 | 3812.02 | 631 | 621 | 125.3 |
| A | 10 | 83 | 350162 | 2788.81 | 631 | 621 | 125.3 |
| A | 13 | 6 | 9281 | 69.09 | 631 | 621 | 125.3 |
| B | 5 | 172 | 240300 | 2018.07 | 629 | 613 | 118.8 |
| B | 5 | 184 | 70528 | 588.66 | 629 | 613 | 118.8 |
| B | 12 | 111 | 13912 | 111.97 | 629 | 613 | 118.8 |
| C | 15 | 159 | 308052 | 2188.15 | 616 | 621 | 140.5 |
| C | 15 | 214 | 232597 | 1651.1 | 616 | 621 | 140.5 |
| C | 0 | 10 | 109670 | 776.16 | 616 | 621 | 140.5 |
| D | 1 | 52 | 1010525 | 6894.2 | 613 | 598 | 146.5 |
| D | 12 | 227 | 308437 | 2101.44 | 613 | 598 | 146.5 |
| D | 7 | 223 | 161411 | 1097.78 | 613 | 598 | 146.5 |
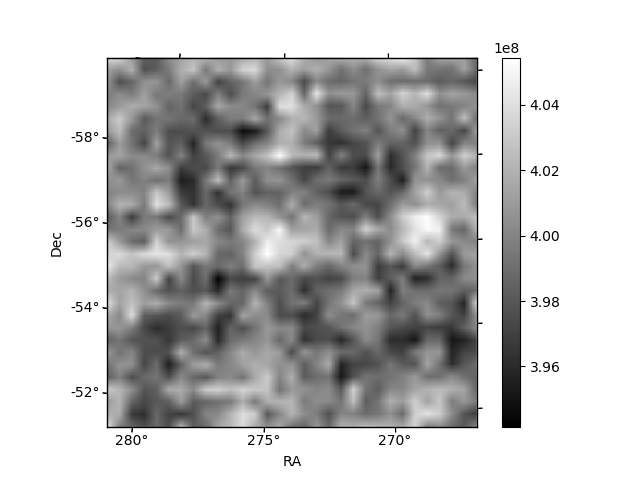
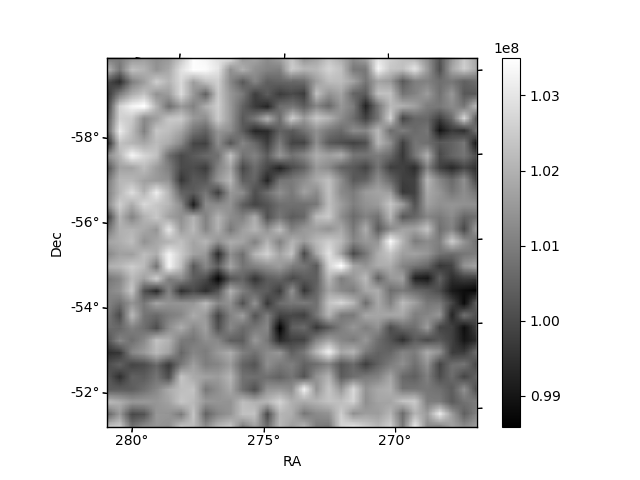
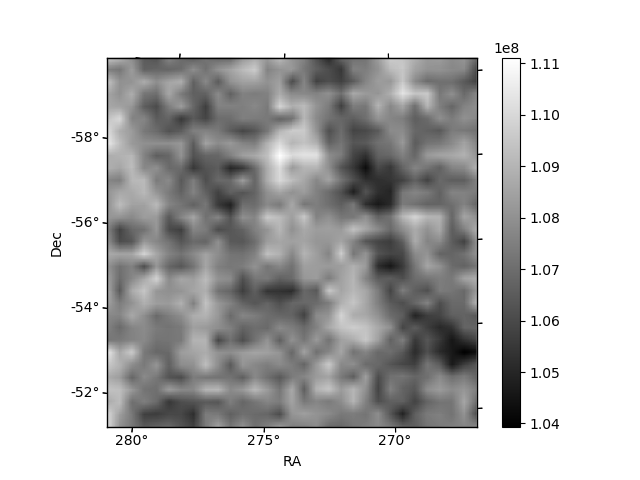
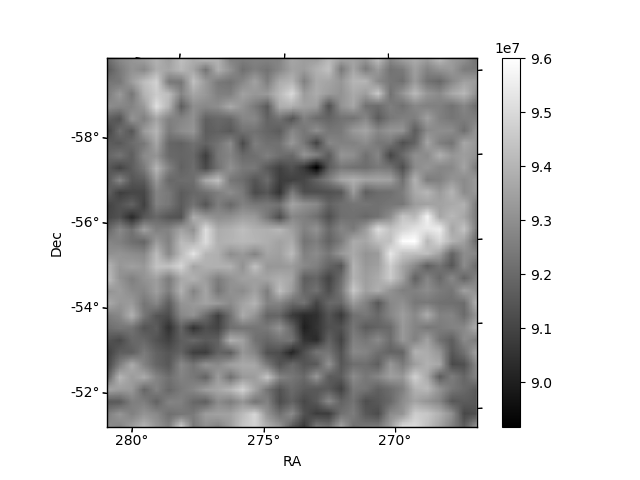
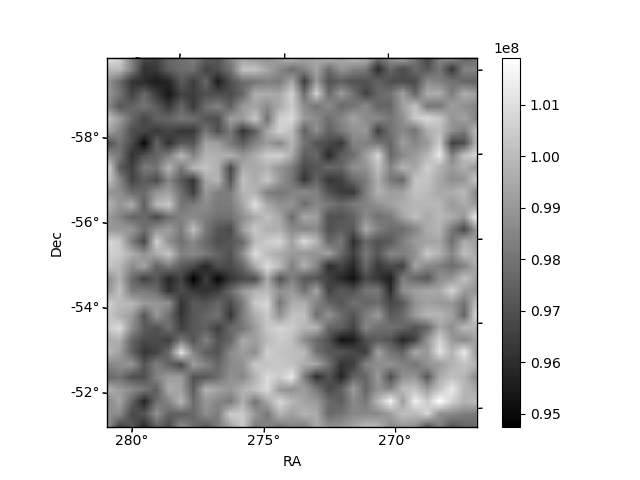
Histogram calculated using DETX and DETY for each event in the final _common_clean file
| Quadrant A | 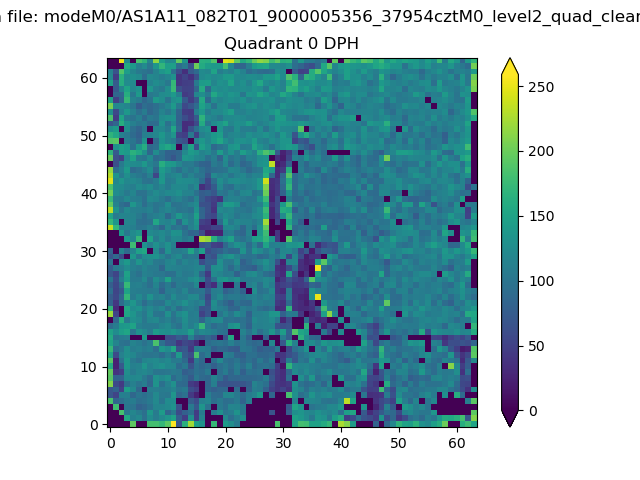 |
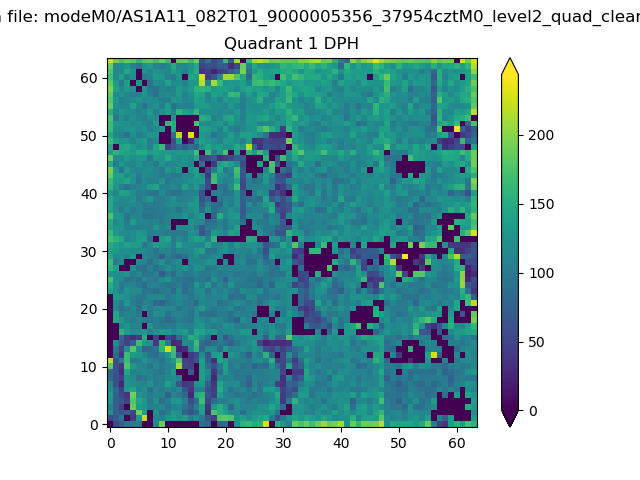 |
Quadrant B |
|---|---|---|---|
| Quadrant D | 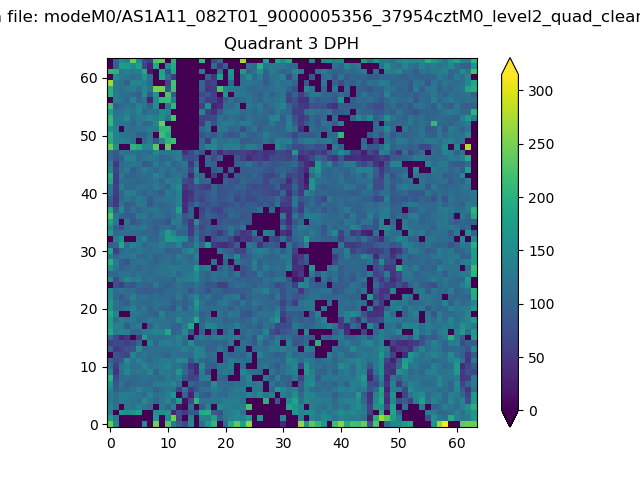 |
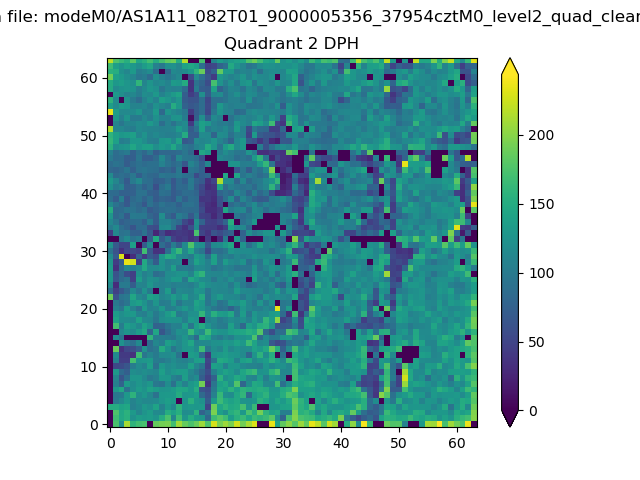 |
Quadrant C |
| Plot type | Count rate plots | Images |
|---|---|---|
| Comparison with Poisson distribution Blue bars denote a histogram of data divided into 1 sec bins. Red curve is a Poisson curve with rate = median count rate of data. |
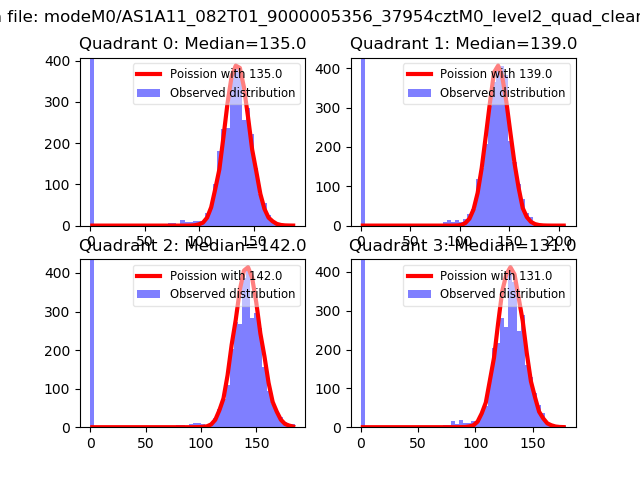 |
 |
| Quadrant-wise count rates Data is divided into 100 sec bins |
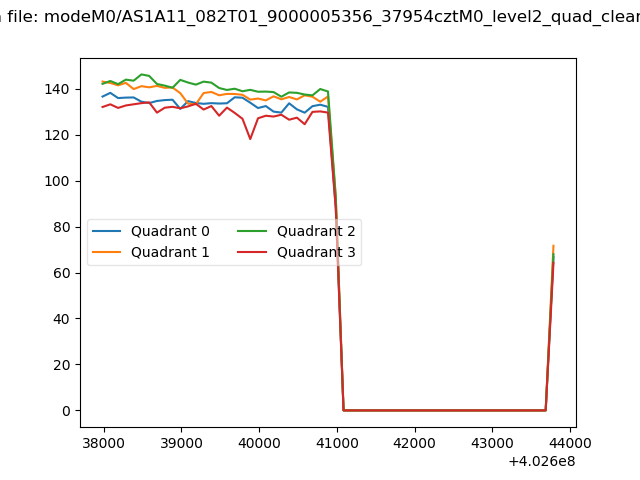 |
|
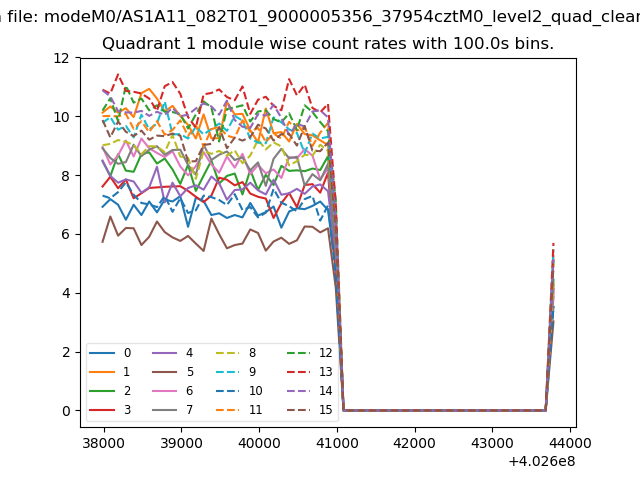
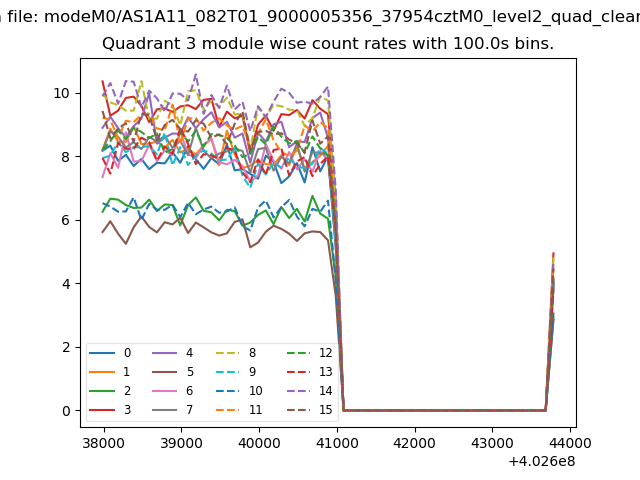
| Module-wise count rates for Quadrant A Data is divided into 100 sec bins |
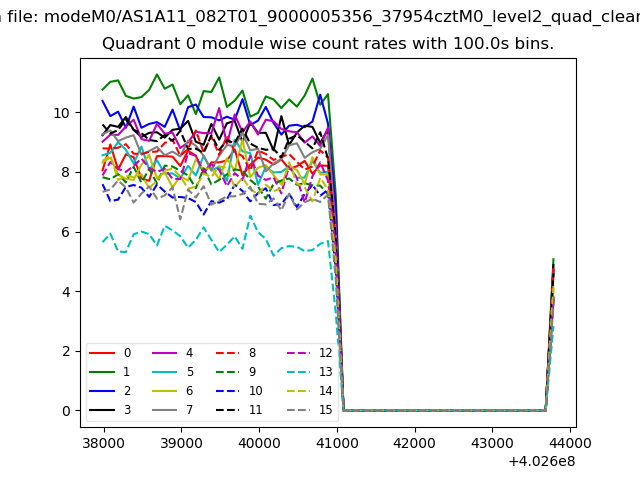 |
 |
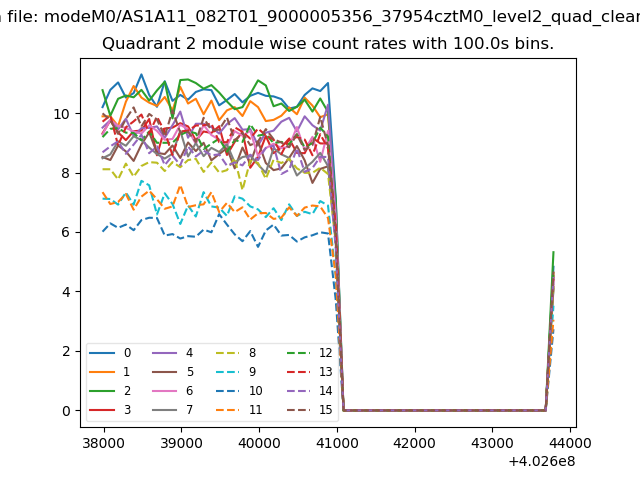
| Module-wise count rates for Quadrant B Data is divided into 100 sec bins |
 |
 |
| Module-wise count rates for Quadrant C Data is divided into 100 sec bins |
 |
 |
| Module-wise count rates for Quadrant D Data is divided into 100 sec bins |
 |
 |
| Parameter | Plot |
|---|---|
| CZT HV Monitor | 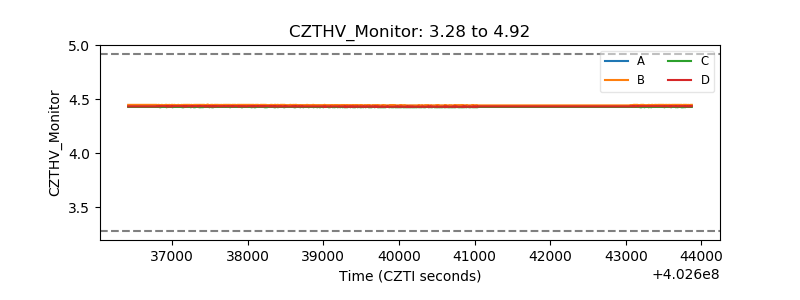 |
| D_VDD | 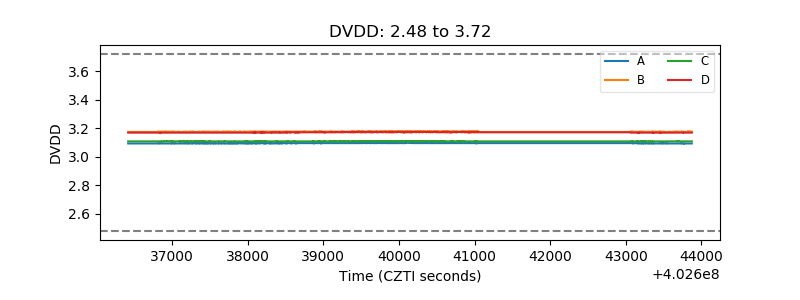 |
| Temperature 1 | 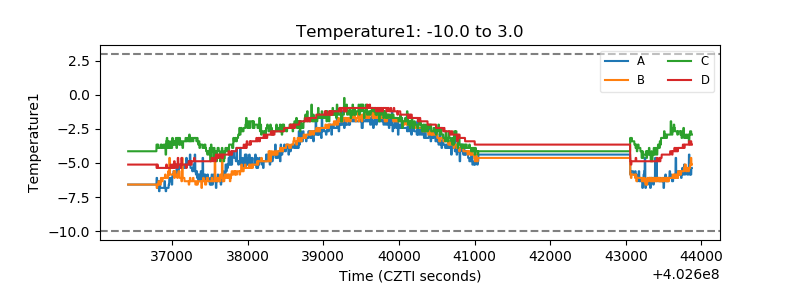 |
| Veto HV Monitor | 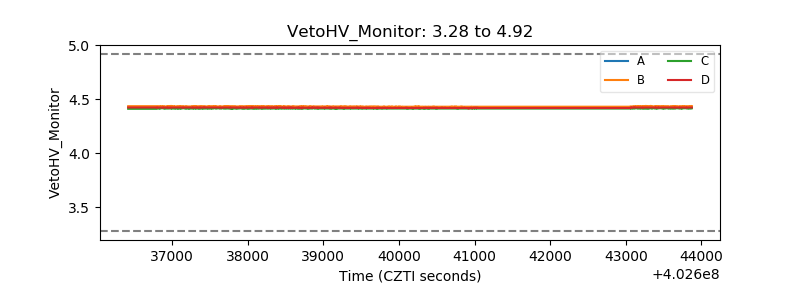 |
| Veto LLD | 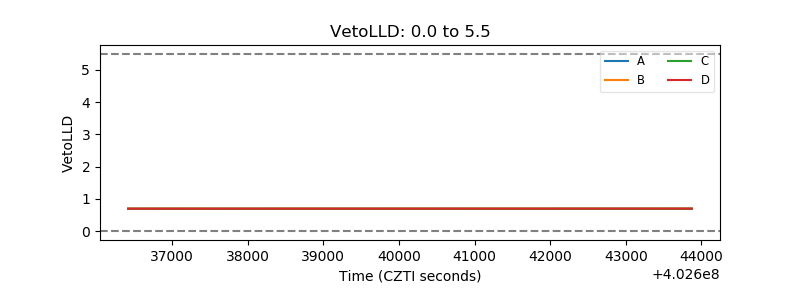 |
| Alpha Counter | 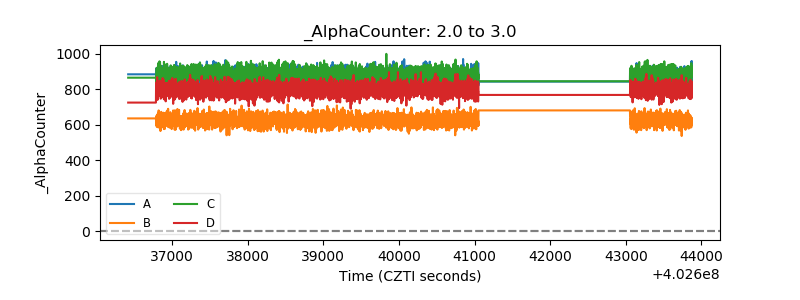 |
| _CPM_Rate | 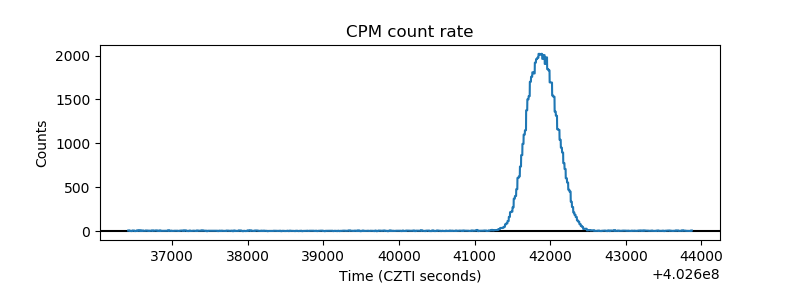 |
| CZT Counter | 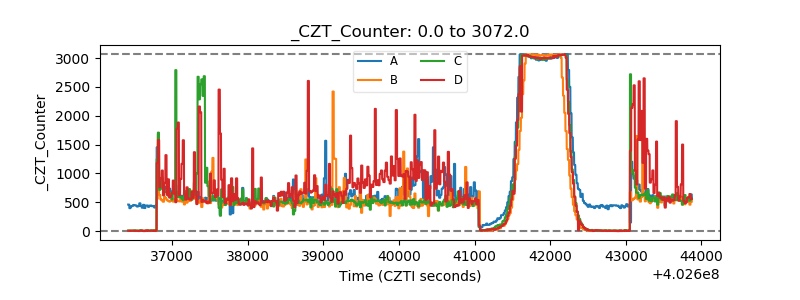 |
| +2.5 Volts monitor | 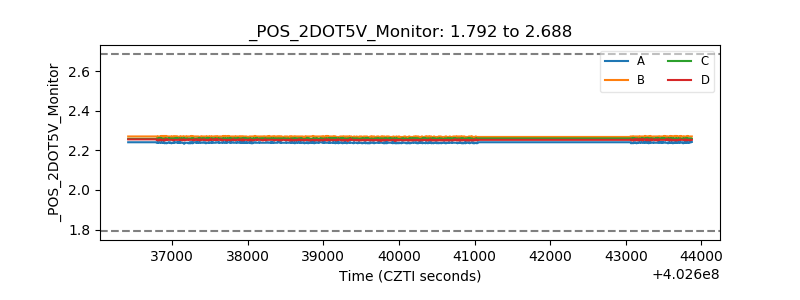 |
| +5 Volts monitor | 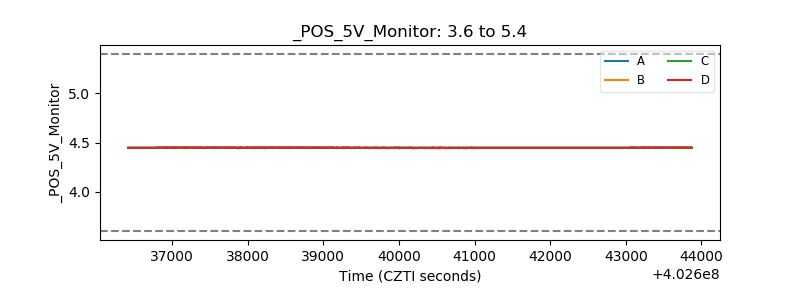 |
| _ROLL_ROT | 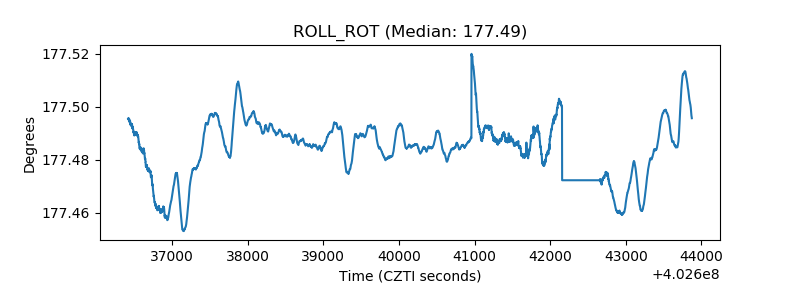 |
| _Roll_DEC | 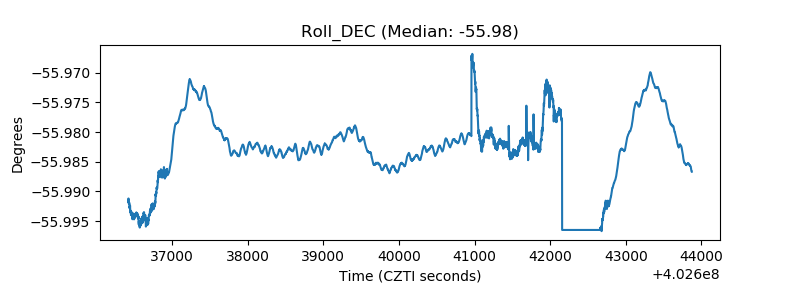 |
| _Roll_RA | 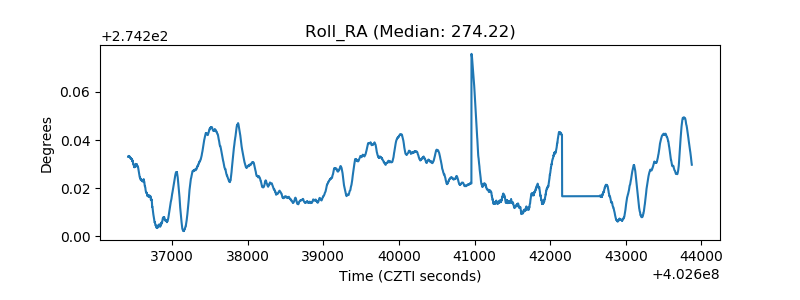 |
| Veto Counter | 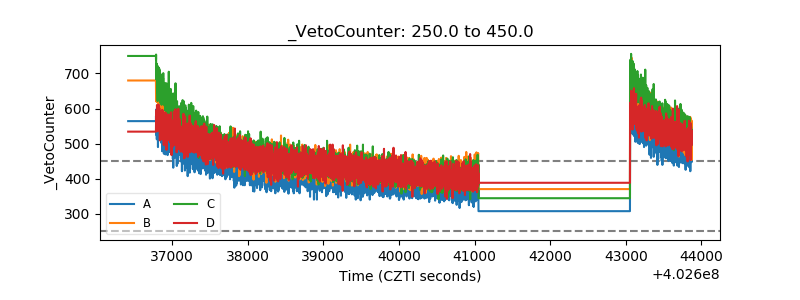 |