| Param | Original file | Final file |
|---|---|---|
| Filename | modeM0/AS1A11_082T01_9000005356_37955cztM0_level2.evt | modeM0/AS1A11_082T01_9000005356_37955cztM0_level2_quad_clean.evt |
| Size (bytes) | 474,154,560 | 80,101,440 |
| Size | 452.2 MB | 76.4 MB |
| Events in quadrant A | 2,877,348 | 533,500 |
| Events in quadrant B | 4,111,805 | 510,127 |
| Events in quadrant C | 3,347,583 | 527,388 |
| Events in quadrant D | 3,689,253 | 509,001 |
| Mode M0 | |||
|---|---|---|---|
| Quadrant | BADHDUFLAG | Total packets | Discarded packets |
| A | 0 | 11513 | 3 |
| B | 0 | 15139 | 2 |
| C | 0 | 12807 | 2 |
| D | 0 | 14097 | 2 |
| Mode SS | |||
|---|---|---|---|
| Quadrant | BADHDUFLAG | Total packets | Discarded packets |
| A | 0 | 98 | 0 |
| B | 0 | 98 | 0 |
| C | 0 | 98 | 0 |
| D | 0 | 98 | 0 |
| Mode M9 | |||
|---|---|---|---|
| Quadrant | BADHDUFLAG | Total packets | Discarded packets |
| A | 0 | 25 | 0 |
| B | 0 | 25 | 0 |
| C | 0 | 25 | 0 |
| D | 0 | 26 | 0 |
| Quadrant | Total seconds | Saturated seconds | Saturation percentage |
|---|---|---|---|
| A | 4930 | 16 | 0.324544% |
| B | 4930 | 560 | 11.359026% |
| C | 4930 | 305 | 6.186613% |
| D | 4930 | 220 | 4.462475% |
Noise dominated data is calculated using 1-second bins in cleaned event files. If a bin has >2000 counts, and if more than 50% of those come from <1% of pixels, then it is considered to be noise-dominated and hence unusable.
| Quadrant | # 1 sec bins | Bins with >0 counts | Bins with >2000 counts | High rate bins dominated by noise | Noise dominated (total time) | Noise dominated (detector-on time) | Marked lightcurve |
|---|---|---|---|---|---|---|---|
| A | 7054 | 4931 | 7 | 7 | 0.10% | 0.14% | 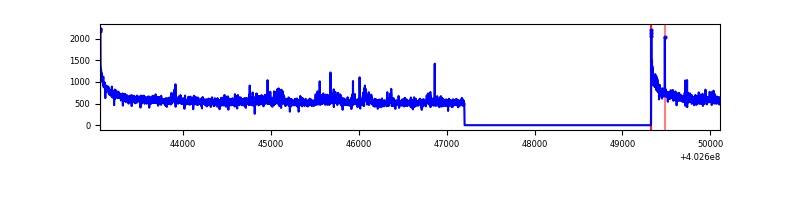 |
| B | 7054 | 4931 | 437 | 437 | 6.20% | 8.86% | 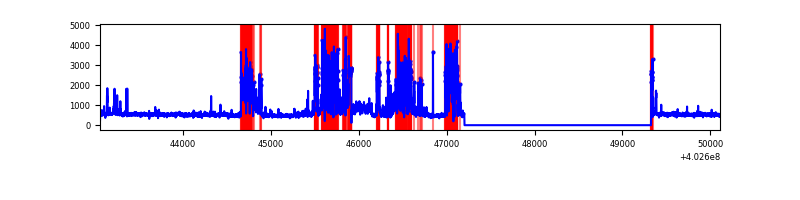 |
| C | 7054 | 4931 | 256 | 256 | 3.63% | 5.19% | 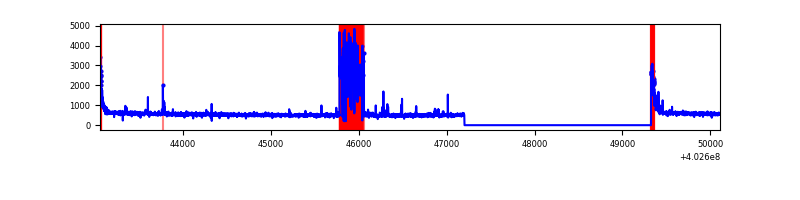 |
| D | 7054 | 4931 | 181 | 181 | 2.57% | 3.67% | 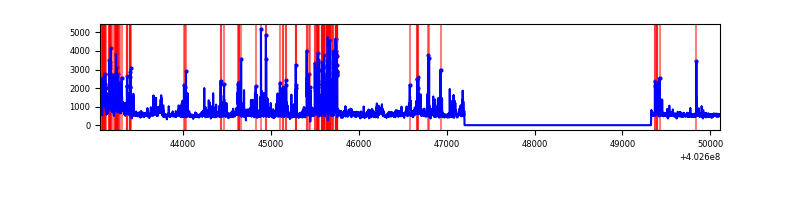 |
Top three noisy pixels from each quadrant. If the there are fewer than three noisy pixels in the level2.evt file, extra rows are filled as -1
| Pixel properties | Quadrant properties | ||||||
|---|---|---|---|---|---|---|---|
| Quadrant | DetID | PixID | Counts | Sigma | Mean | Median | Sigma |
| A | 10 | 83 | 337527 | 2744.48 | 620 | 610 | 122.8 |
| A | 15 | 222 | 108863 | 881.81 | 620 | 610 | 122.8 |
| A | 12 | 189 | 14438 | 112.64 | 620 | 610 | 122.8 |
| B | 5 | 172 | 1483003 | 13291.07 | 589 | 574 | 111.5 |
| B | 5 | 184 | 308539 | 2761.13 | 589 | 574 | 111.5 |
| B | 12 | 111 | 12850 | 110.06 | 589 | 574 | 111.5 |
| C | 14 | 254 | 695949 | 5218.42 | 587 | 593 | 133.3 |
| C | 15 | 214 | 216353 | 1619.21 | 587 | 593 | 133.3 |
| C | 0 | 10 | 138362 | 1033.91 | 587 | 593 | 133.3 |
| D | 12 | 227 | 360077 | 2500.42 | 599 | 583 | 143.8 |
| D | 1 | 52 | 357896 | 2485.25 | 599 | 583 | 143.8 |
| D | 10 | 199 | 178148 | 1235.03 | 599 | 583 | 143.8 |
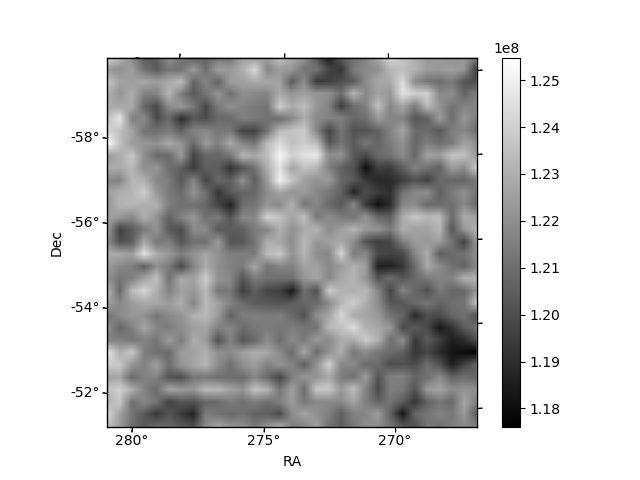
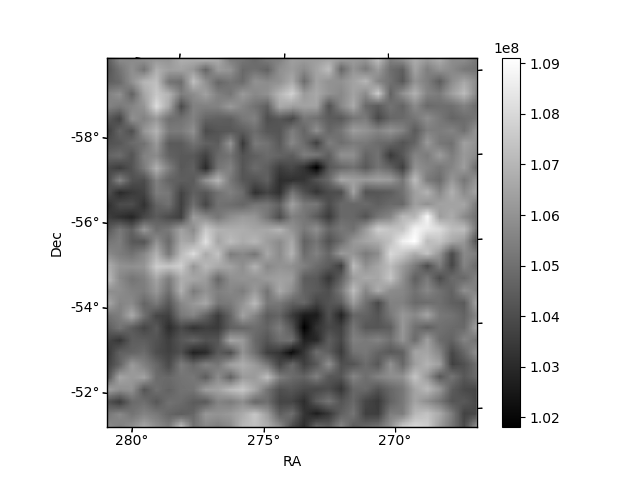
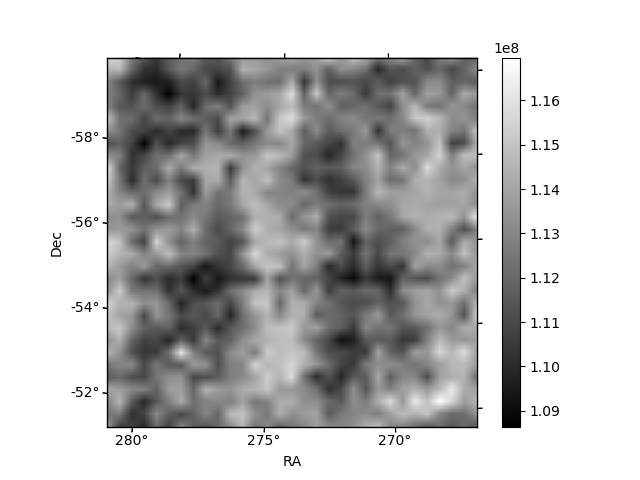
Histogram calculated using DETX and DETY for each event in the final _common_clean file
| Quadrant A | 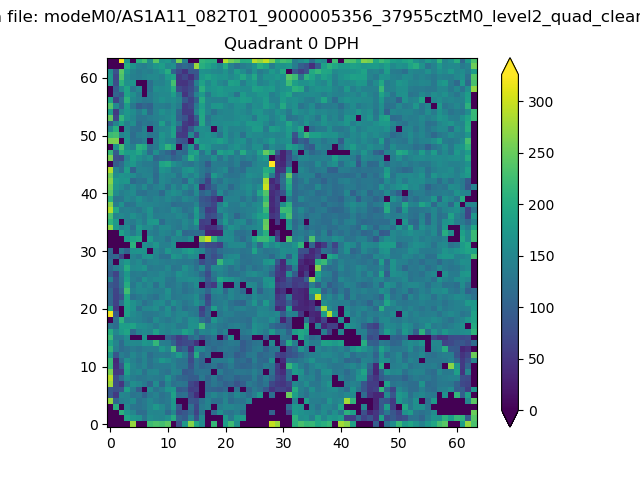 |
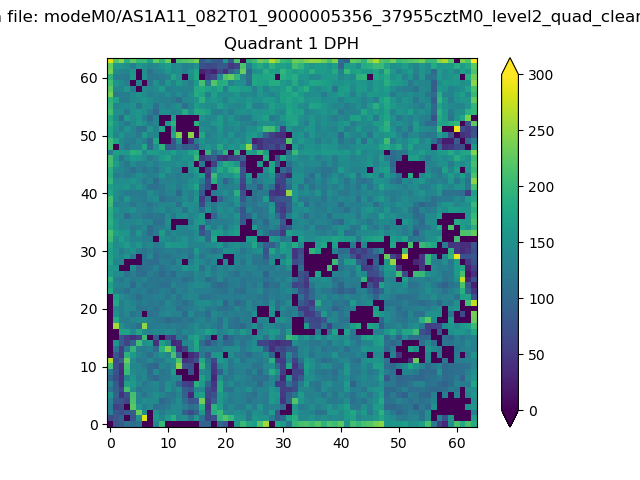 |
Quadrant B |
|---|---|---|---|
| Quadrant D | 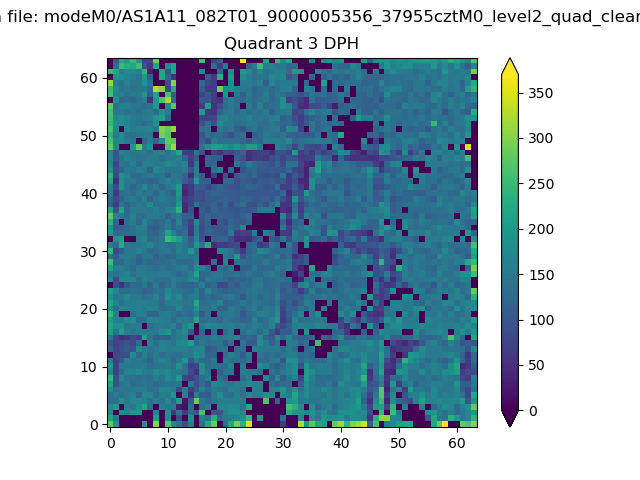 |
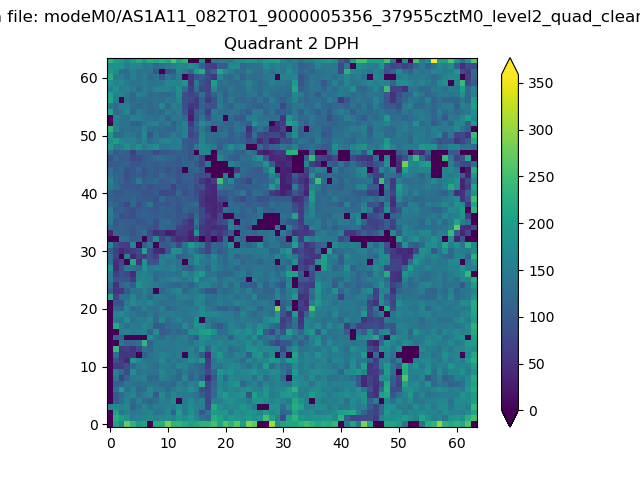 |
Quadrant C |
| Plot type | Count rate plots | Images |
|---|---|---|
| Comparison with Poisson distribution Blue bars denote a histogram of data divided into 1 sec bins. Red curve is a Poisson curve with rate = median count rate of data. |
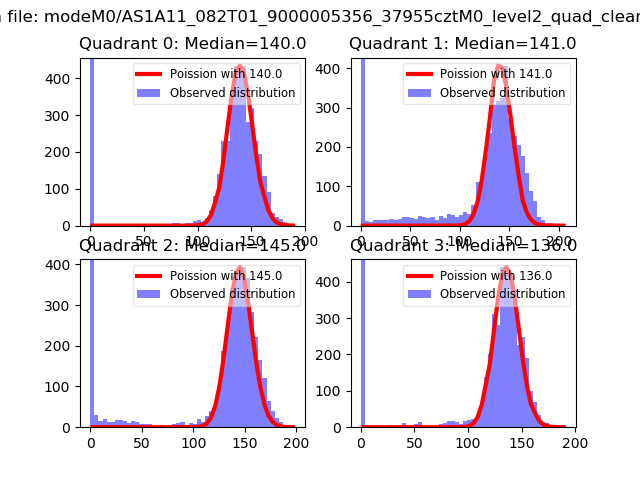 |
 |
| Quadrant-wise count rates Data is divided into 100 sec bins |
 |
|
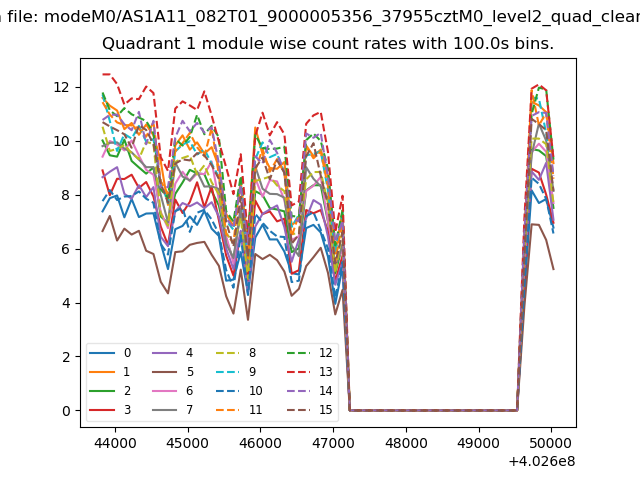
| Module-wise count rates for Quadrant A Data is divided into 100 sec bins |
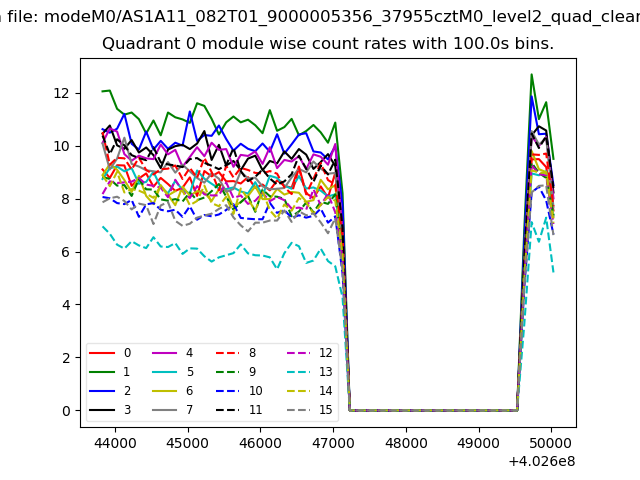 |
 |
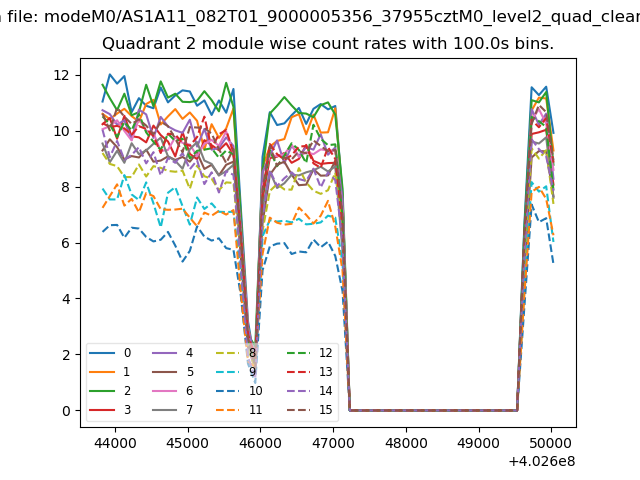
| Module-wise count rates for Quadrant B Data is divided into 100 sec bins |
 |
 |
| Module-wise count rates for Quadrant C Data is divided into 100 sec bins |
 |
 |
| Module-wise count rates for Quadrant D Data is divided into 100 sec bins |
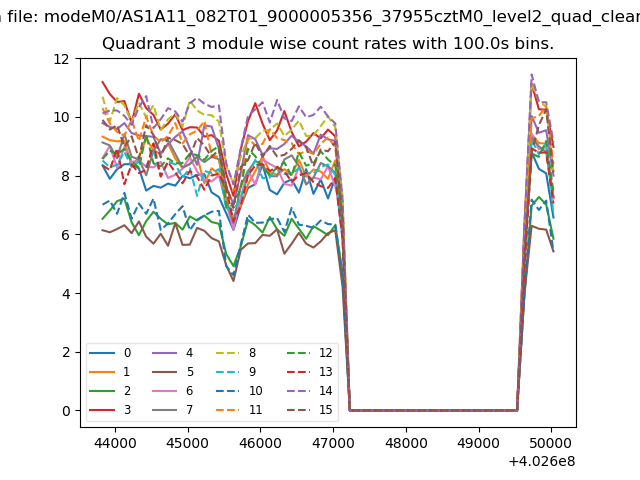 |
 |
| Parameter | Plot |
|---|---|
| CZT HV Monitor | 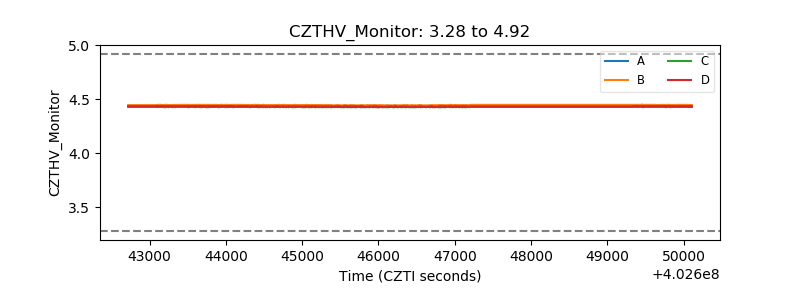 |
| D_VDD | 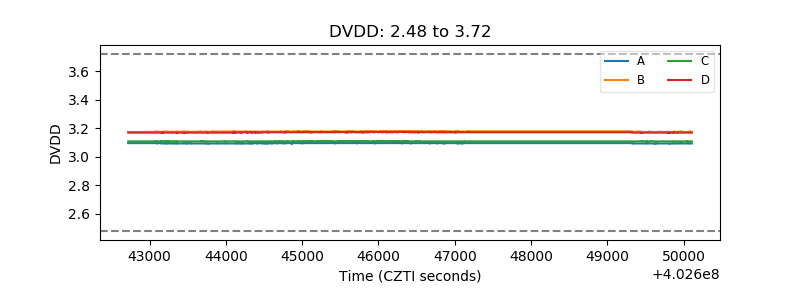 |
| Temperature 1 | 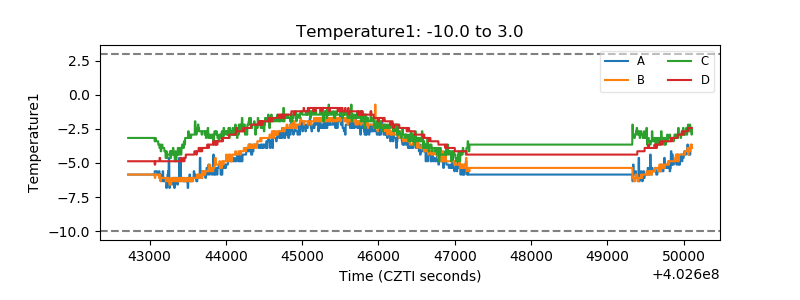 |
| Veto HV Monitor | 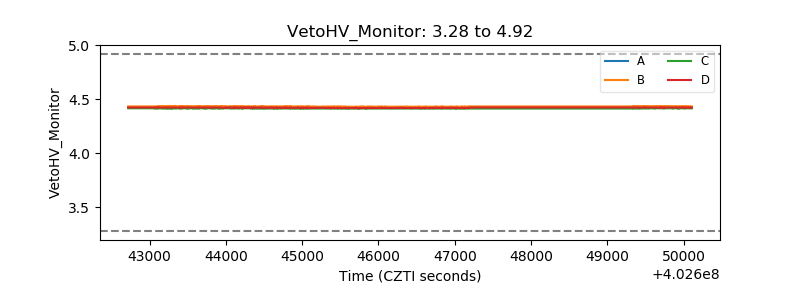 |
| Veto LLD | 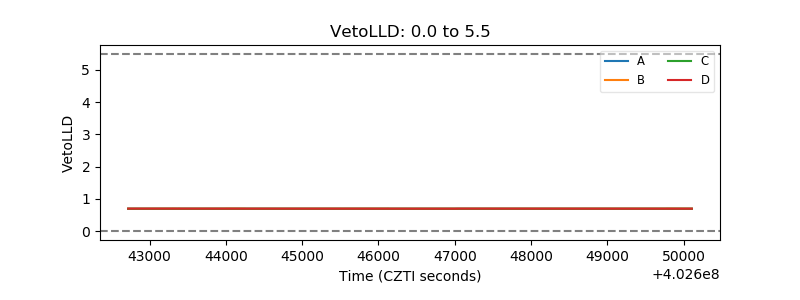 |
| Alpha Counter | 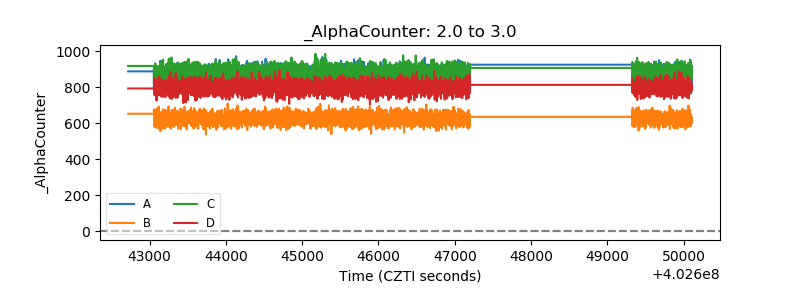 |
| _CPM_Rate | 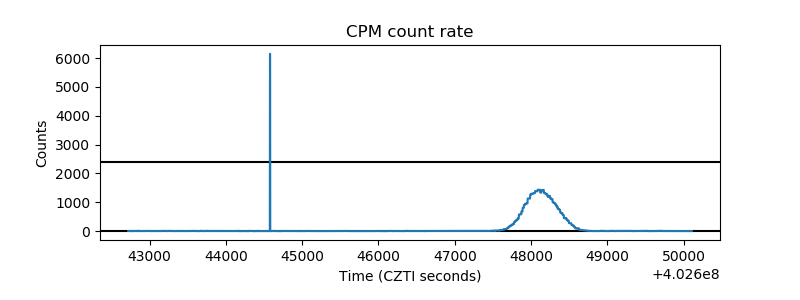 |
| CZT Counter |  |
| +2.5 Volts monitor |  |
| +5 Volts monitor |  |
| _ROLL_ROT | 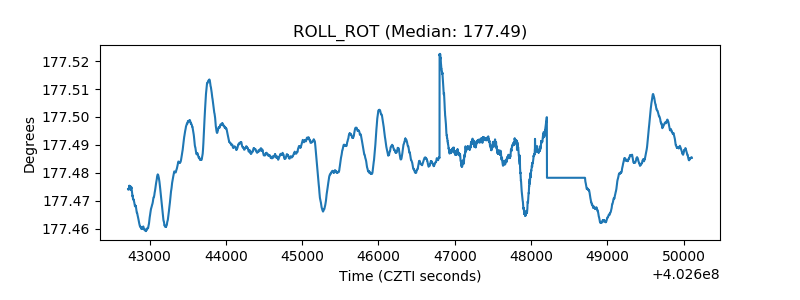 |
| _Roll_DEC | 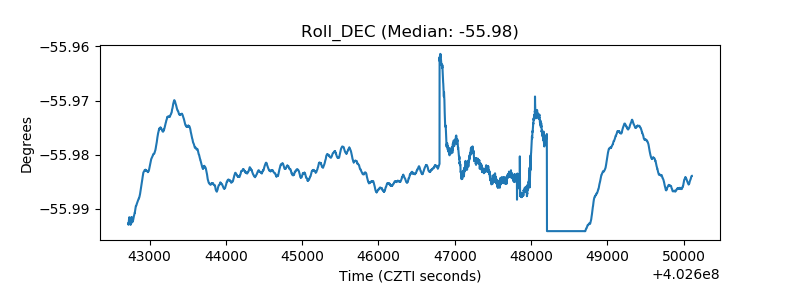 |
| _Roll_RA | 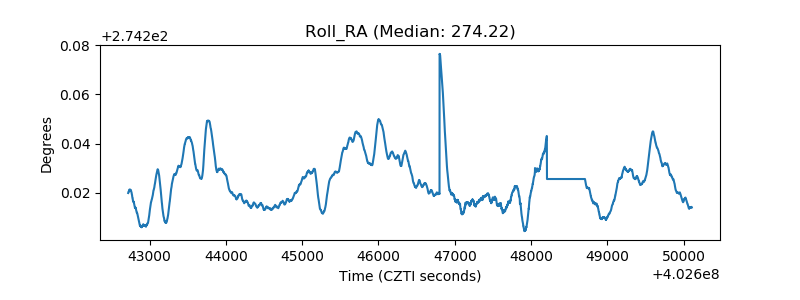 |
| Veto Counter | 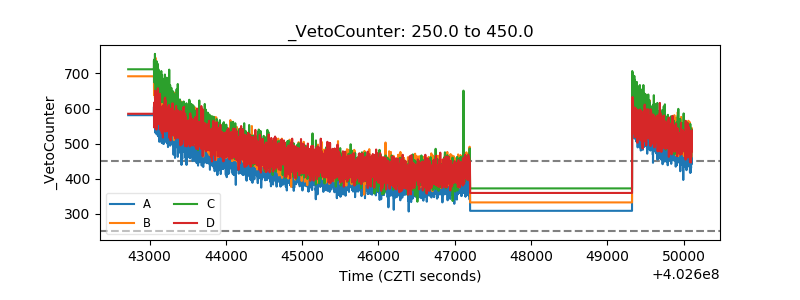 |