| Param | Original file | Final file |
|---|---|---|
| Filename | modeM0/AS1A11_082T01_9000005356_37956cztM0_level2.evt | modeM0/AS1A11_082T01_9000005356_37956cztM0_level2_quad_clean.evt |
| Size (bytes) | 396,944,640 | 95,002,560 |
| Size | 378.6 MB | 90.6 MB |
| Events in quadrant A | 2,808,681 | 628,650 |
| Events in quadrant B | 2,693,549 | 645,493 |
| Events in quadrant C | 2,748,990 | 653,047 |
| Events in quadrant D | 3,438,874 | 607,763 |
| Mode M0 | |||
|---|---|---|---|
| Quadrant | BADHDUFLAG | Total packets | Discarded packets |
| A | 0 | 11331 | 3 |
| B | 0 | 10839 | 2 |
| C | 0 | 10975 | 2 |
| D | 0 | 13337 | 2 |
| Mode SS | |||
|---|---|---|---|
| Quadrant | BADHDUFLAG | Total packets | Discarded packets |
| A | 0 | 100 | 0 |
| B | 0 | 100 | 0 |
| C | 0 | 100 | 0 |
| D | 0 | 100 | 0 |
| Mode M9 | |||
|---|---|---|---|
| Quadrant | BADHDUFLAG | Total packets | Discarded packets |
| A | 0 | 27 | 0 |
| B | 0 | 27 | 0 |
| C | 0 | 27 | 0 |
| D | 0 | 28 | 0 |
| Quadrant | Total seconds | Saturated seconds | Saturation percentage |
|---|---|---|---|
| A | 4877 | 20 | 0.410088% |
| B | 4877 | 91 | 1.865901% |
| C | 4877 | 55 | 1.127742% |
| D | 4877 | 47 | 0.963707% |
Noise dominated data is calculated using 1-second bins in cleaned event files. If a bin has >2000 counts, and if more than 50% of those come from <1% of pixels, then it is considered to be noise-dominated and hence unusable.
| Quadrant | # 1 sec bins | Bins with >0 counts | Bins with >2000 counts | High rate bins dominated by noise | Noise dominated (total time) | Noise dominated (detector-on time) | Marked lightcurve |
|---|---|---|---|---|---|---|---|
| A | 7030 | 4878 | 6 | 6 | 0.09% | 0.12% | 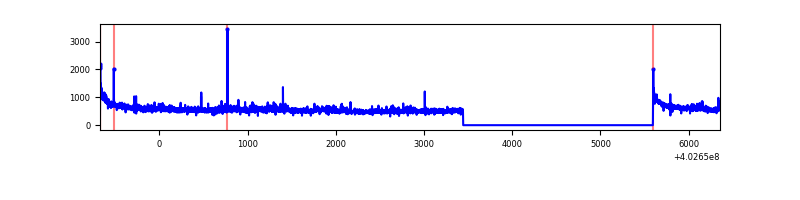 |
| B | 7030 | 4878 | 59 | 59 | 0.84% | 1.21% | 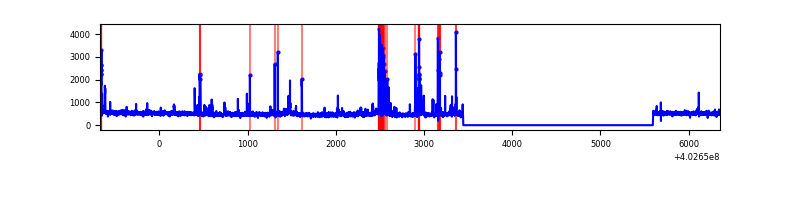 |
| C | 7030 | 4878 | 51 | 51 | 0.73% | 1.05% | 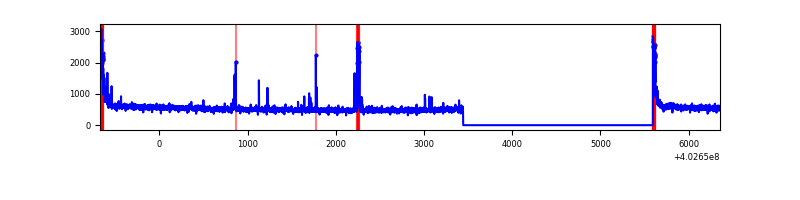 |
| D | 7030 | 4878 | 51 | 51 | 0.73% | 1.05% | 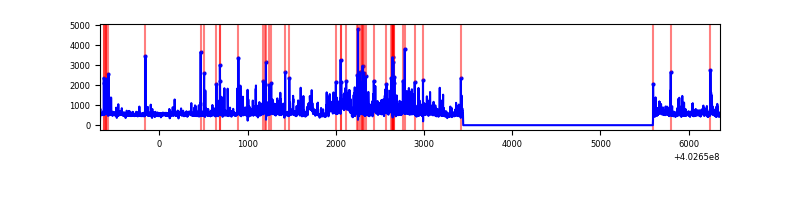 |
Top three noisy pixels from each quadrant. If the there are fewer than three noisy pixels in the level2.evt file, extra rows are filled as -1
| Pixel properties | Quadrant properties | ||||||
|---|---|---|---|---|---|---|---|
| Quadrant | DetID | PixID | Counts | Sigma | Mean | Median | Sigma |
| A | 10 | 83 | 339826 | 2826.35 | 600 | 590 | 120.0 |
| A | 15 | 222 | 110794 | 918.17 | 600 | 590 | 120.0 |
| A | 13 | 6 | 10062 | 78.92 | 600 | 590 | 120.0 |
| B | 5 | 172 | 285436 | 2560.23 | 592 | 579 | 111.3 |
| B | 5 | 184 | 44016 | 390.4 | 592 | 579 | 111.3 |
| B | 4 | 232 | 19559 | 170.59 | 592 | 579 | 111.3 |
| C | 15 | 214 | 222853 | 1658.27 | 586 | 591 | 134.0 |
| C | 0 | 10 | 151266 | 1124.17 | 586 | 591 | 134.0 |
| C | 15 | 159 | 60161 | 444.44 | 586 | 591 | 134.0 |
| D | 1 | 52 | 601491 | 4206.12 | 586 | 571 | 142.9 |
| D | 7 | 223 | 198705 | 1386.83 | 586 | 571 | 142.9 |
| D | 9 | 49 | 116074 | 808.46 | 586 | 571 | 142.9 |
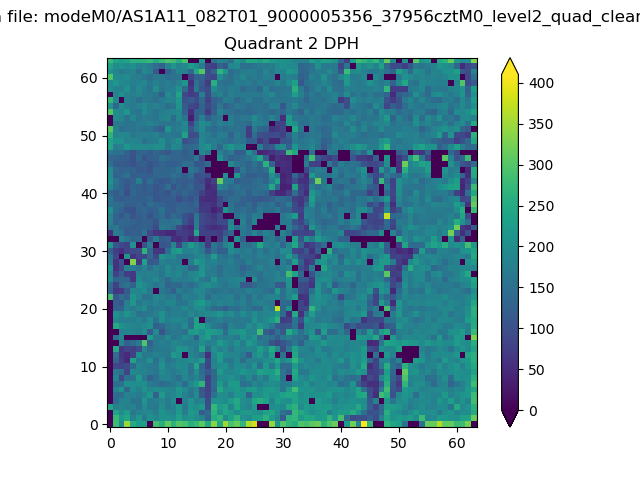
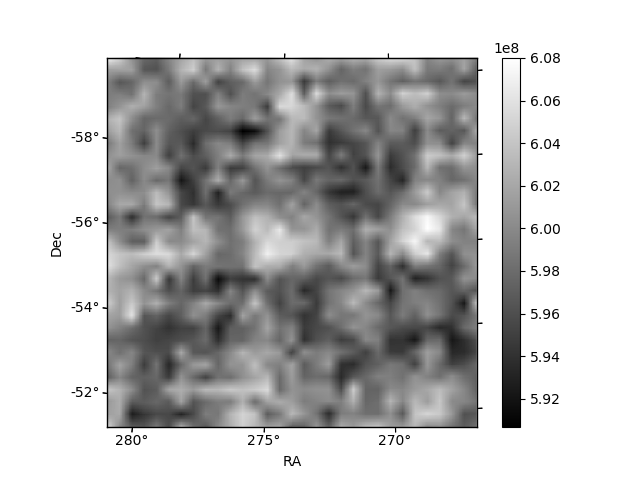
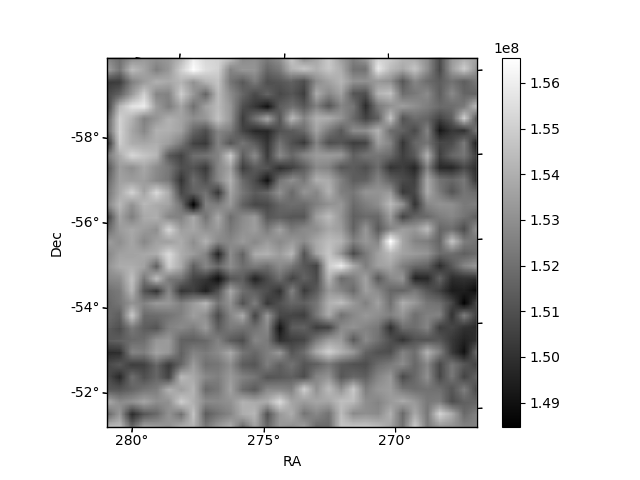
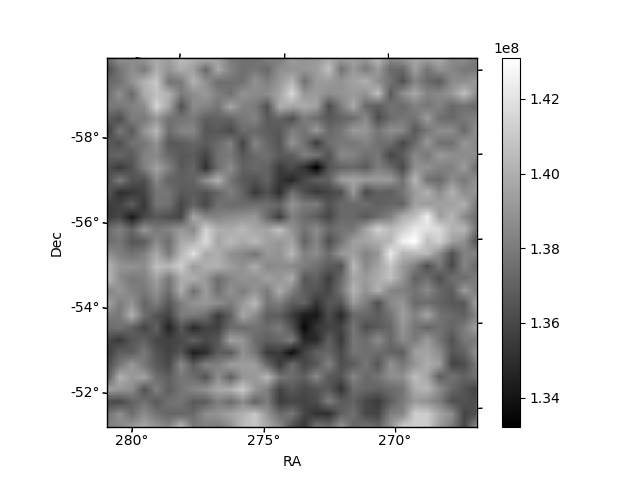
Histogram calculated using DETX and DETY for each event in the final _common_clean file
| Quadrant A | 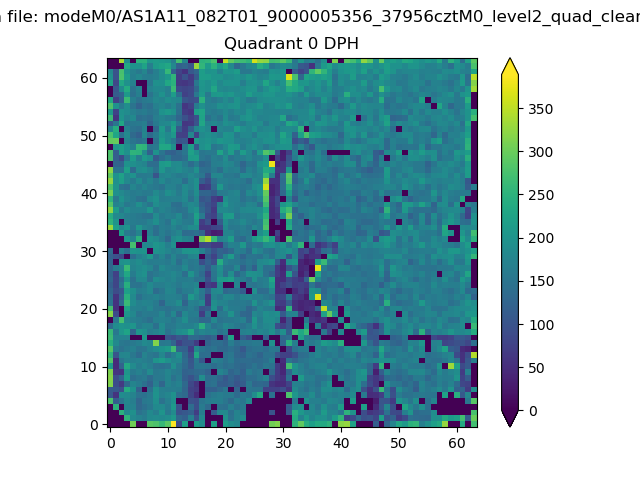 |
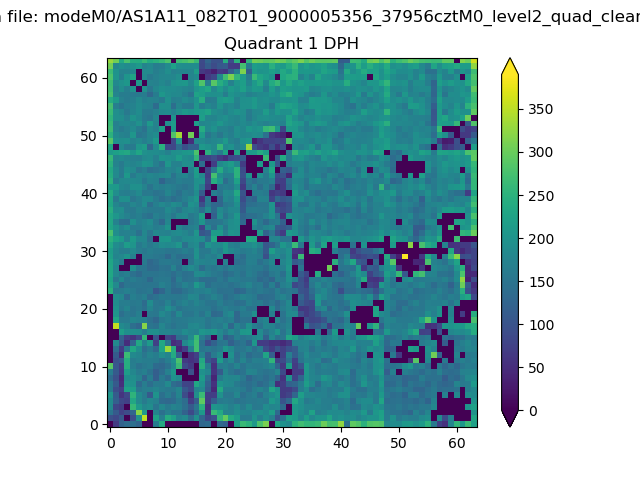 |
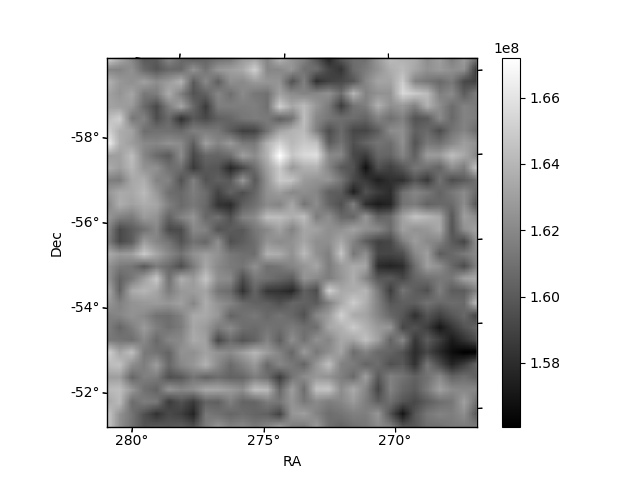
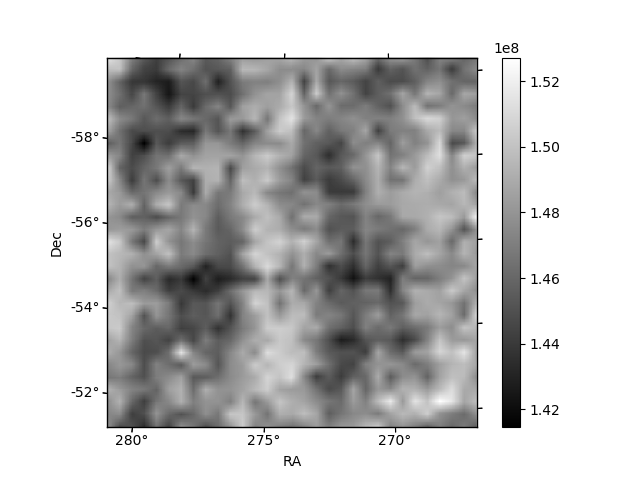
Quadrant B |
|---|---|---|---|
| Quadrant D | 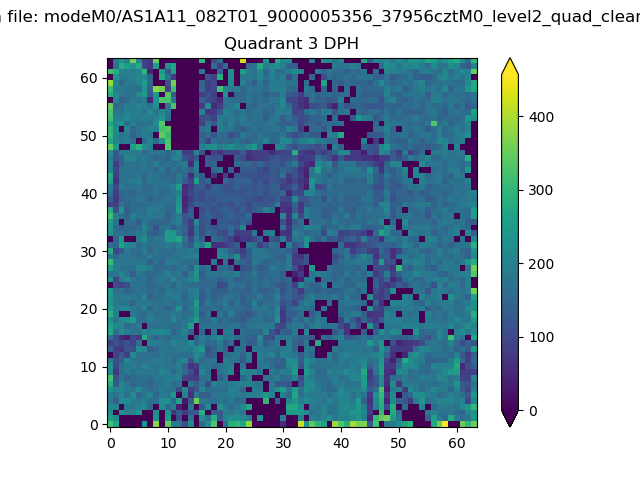 |
 |
Quadrant C |
| Plot type | Count rate plots | Images |
|---|---|---|
| Comparison with Poisson distribution Blue bars denote a histogram of data divided into 1 sec bins. Red curve is a Poisson curve with rate = median count rate of data. |
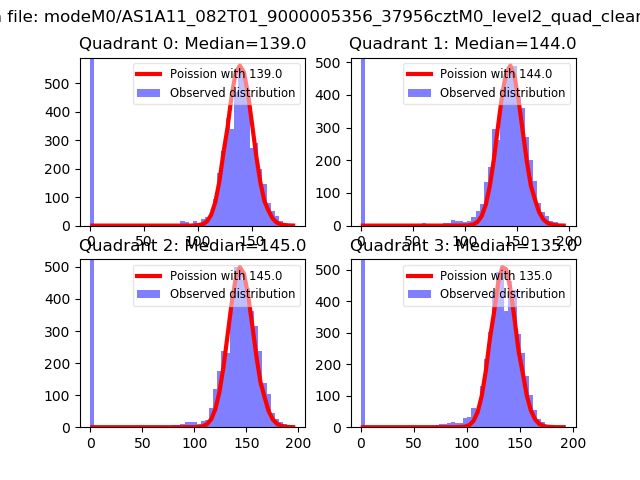 |
 |
| Quadrant-wise count rates Data is divided into 100 sec bins |
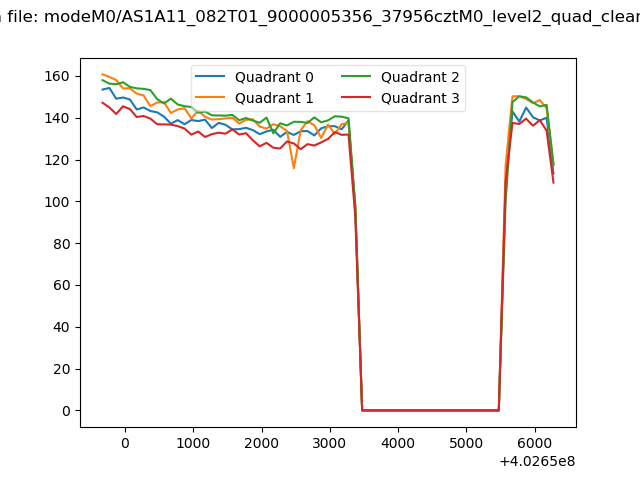 |
|
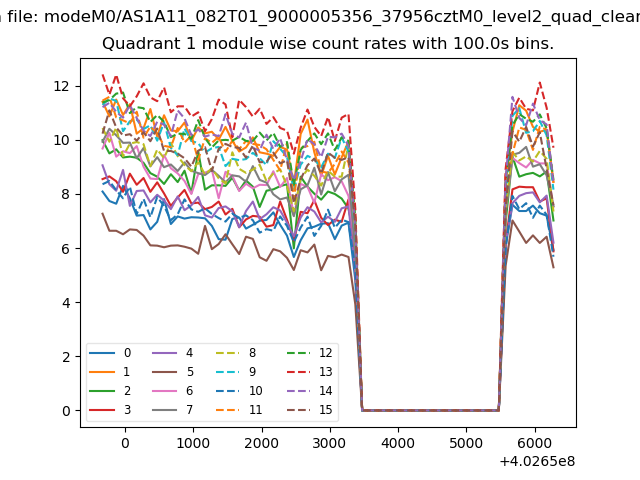
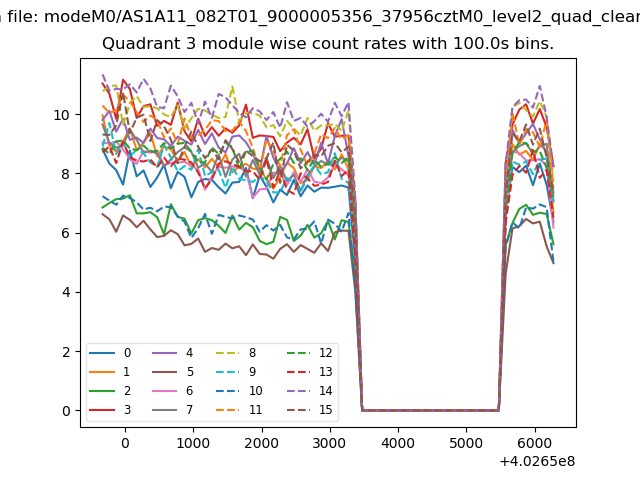
| Module-wise count rates for Quadrant A Data is divided into 100 sec bins |
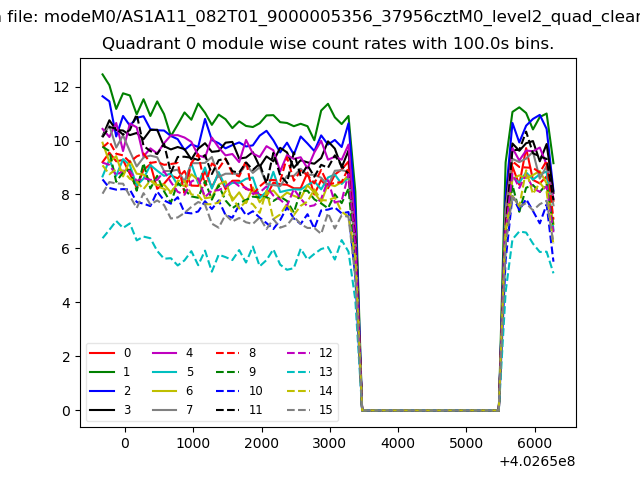 |
 |
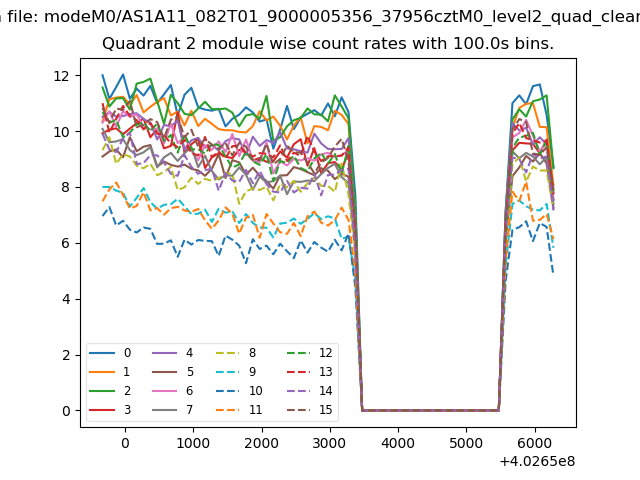
| Module-wise count rates for Quadrant B Data is divided into 100 sec bins |
 |
 |
| Module-wise count rates for Quadrant C Data is divided into 100 sec bins |
 |
 |
| Module-wise count rates for Quadrant D Data is divided into 100 sec bins |
 |
 |
| Parameter | Plot |
|---|---|
| CZT HV Monitor | 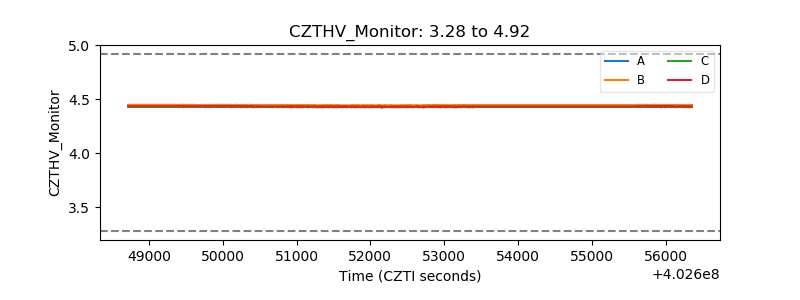 |
| D_VDD | 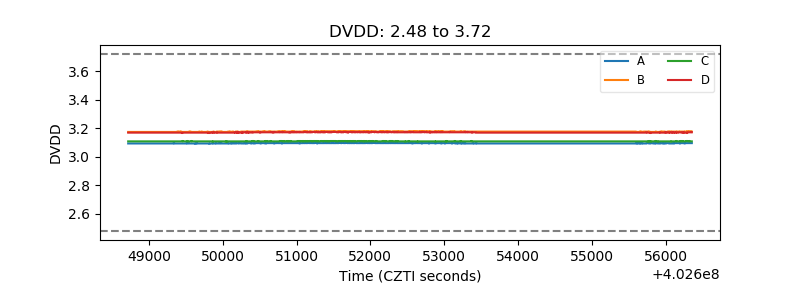 |
| Temperature 1 | 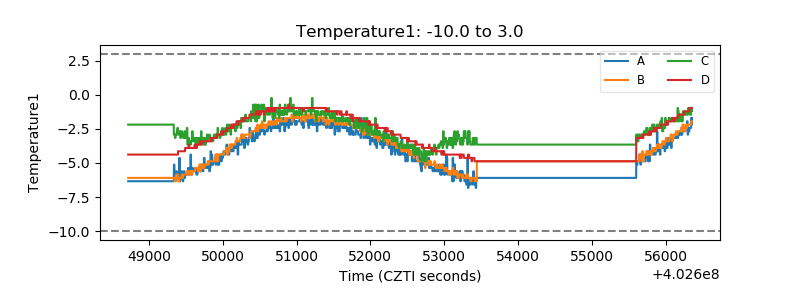 |
| Veto HV Monitor | 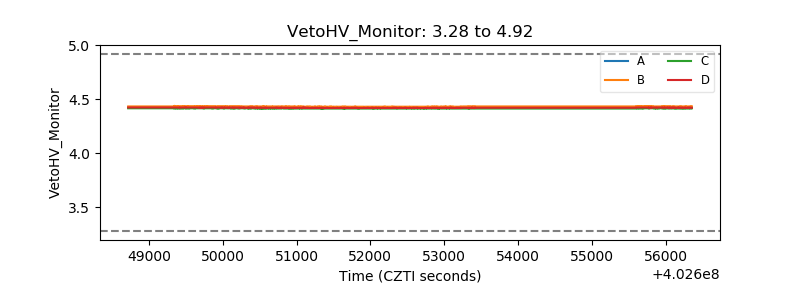 |
| Veto LLD | 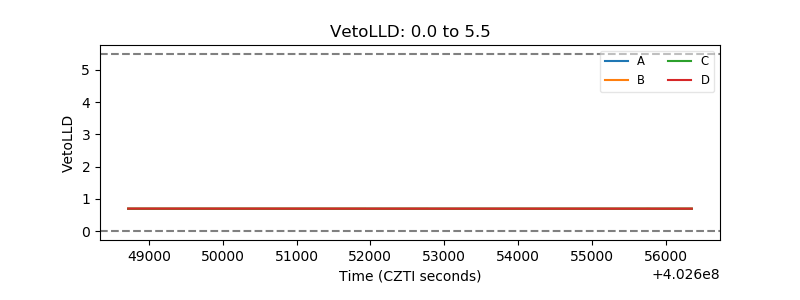 |
| Alpha Counter | 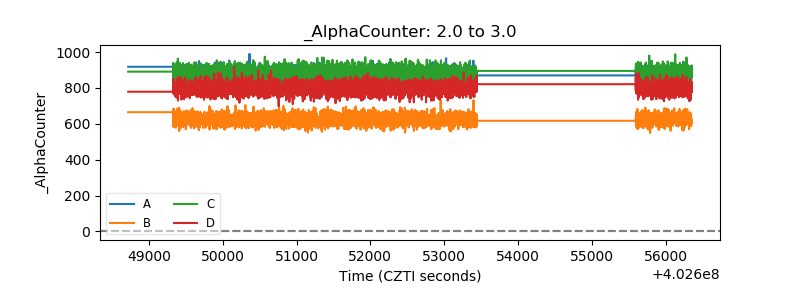 |
| _CPM_Rate | 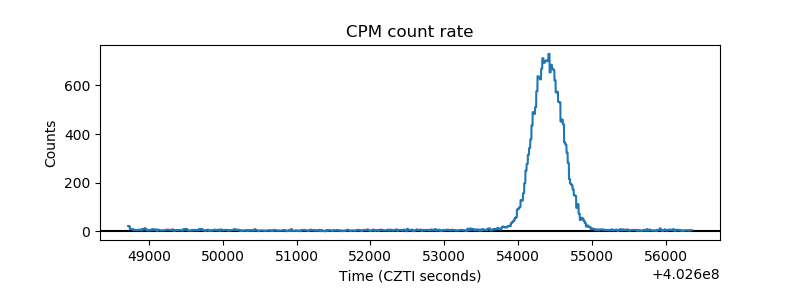 |
| CZT Counter | 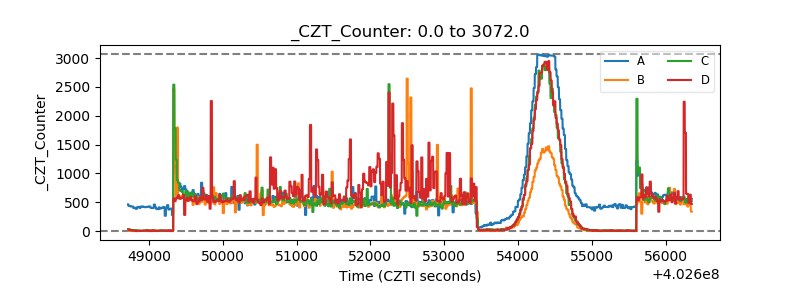 |
| +2.5 Volts monitor | 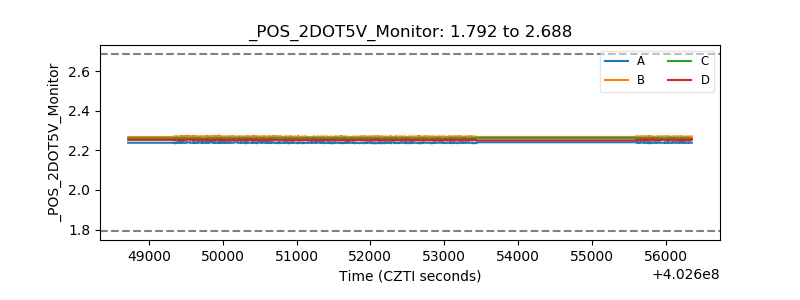 |
| +5 Volts monitor | 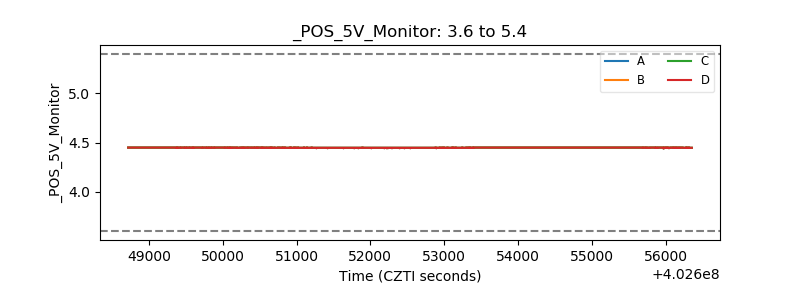 |
| _ROLL_ROT | 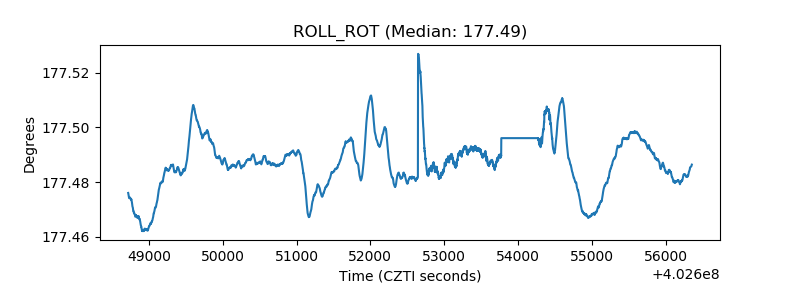 |
| _Roll_DEC | 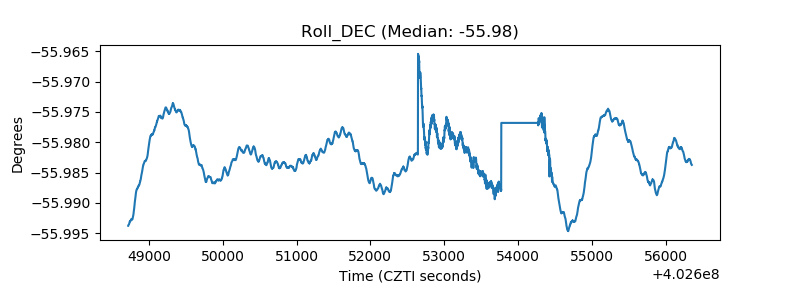 |
| _Roll_RA | 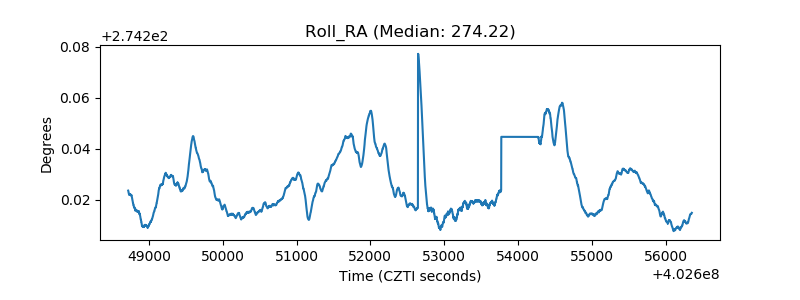 |
| Veto Counter | 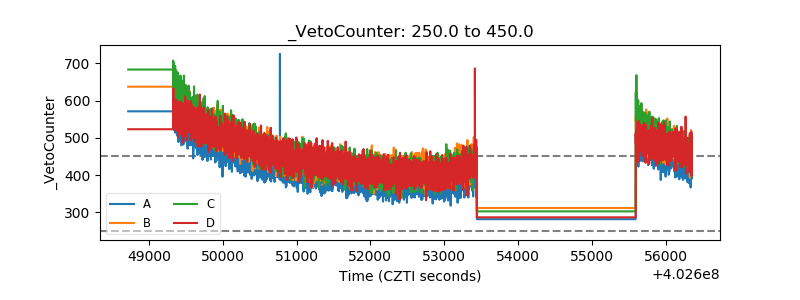 |