| Param | Original file | Final file |
|---|---|---|
| Filename | modeM0/AS1A11_082T01_9000005356_37957cztM0_level2.evt | modeM0/AS1A11_082T01_9000005356_37957cztM0_level2_quad_clean.evt |
| Size (bytes) | 389,007,360 | 95,538,240 |
| Size | 371.0 MB | 91.1 MB |
| Events in quadrant A | 2,814,913 | 635,206 |
| Events in quadrant B | 3,092,456 | 641,606 |
| Events in quadrant C | 2,644,375 | 654,157 |
| Events in quadrant D | 2,896,145 | 618,655 |
| Mode M0 | |||
|---|---|---|---|
| Quadrant | BADHDUFLAG | Total packets | Discarded packets |
| A | 0 | 11380 | 3 |
| B | 0 | 12188 | 2 |
| C | 0 | 10668 | 2 |
| D | 0 | 11799 | 2 |
| Mode SS | |||
|---|---|---|---|
| Quadrant | BADHDUFLAG | Total packets | Discarded packets |
| A | 0 | 100 | 0 |
| B | 0 | 100 | 0 |
| C | 0 | 100 | 0 |
| D | 0 | 100 | 0 |
| Mode M9 | |||
|---|---|---|---|
| Quadrant | BADHDUFLAG | Total packets | Discarded packets |
| A | 0 | 33 | 0 |
| B | 0 | 33 | 0 |
| C | 0 | 33 | 0 |
| D | 0 | 34 | 0 |
| Quadrant | Total seconds | Saturated seconds | Saturation percentage |
|---|---|---|---|
| A | 4900 | 19 | 0.387755% |
| B | 4900 | 169 | 3.448980% |
| C | 4900 | 58 | 1.183673% |
| D | 4900 | 56 | 1.142857% |
Noise dominated data is calculated using 1-second bins in cleaned event files. If a bin has >2000 counts, and if more than 50% of those come from <1% of pixels, then it is considered to be noise-dominated and hence unusable.
| Quadrant | # 1 sec bins | Bins with >0 counts | Bins with >2000 counts | High rate bins dominated by noise | Noise dominated (total time) | Noise dominated (detector-on time) | Marked lightcurve |
|---|---|---|---|---|---|---|---|
| A | 6993 | 4901 | 4 | 4 | 0.06% | 0.08% | 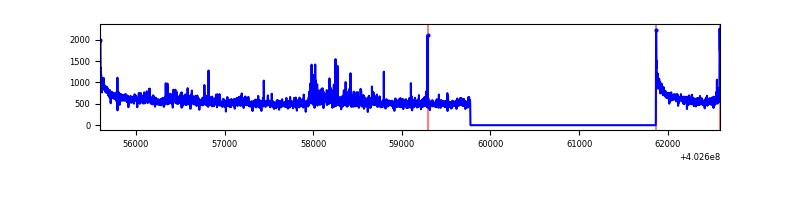 |
| B | 6993 | 4901 | 115 | 115 | 1.64% | 2.35% | 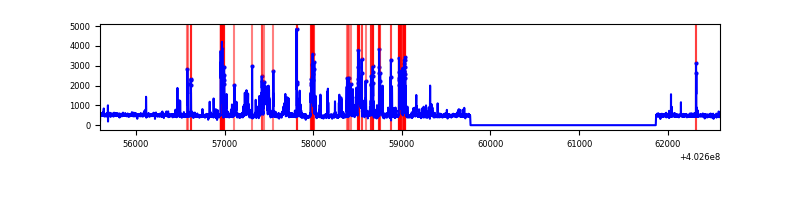 |
| C | 6993 | 4901 | 43 | 43 | 0.61% | 0.88% | 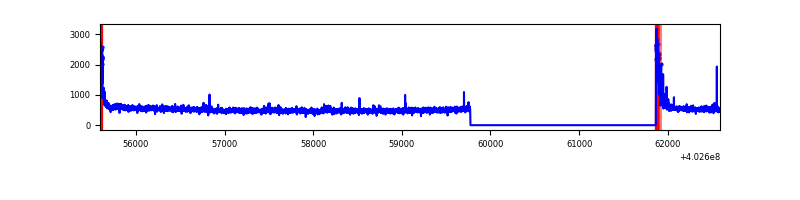 |
| D | 6993 | 4901 | 58 | 58 | 0.83% | 1.18% | 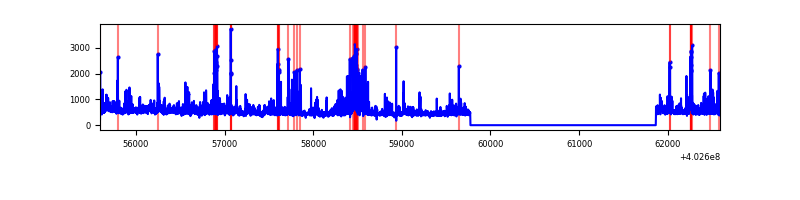 |
Top three noisy pixels from each quadrant. If the there are fewer than three noisy pixels in the level2.evt file, extra rows are filled as -1
| Pixel properties | Quadrant properties | ||||||
|---|---|---|---|---|---|---|---|
| Quadrant | DetID | PixID | Counts | Sigma | Mean | Median | Sigma |
| A | 10 | 83 | 359662 | 3116.83 | 577 | 567 | 115.2 |
| A | 15 | 222 | 191182 | 1654.48 | 577 | 567 | 115.2 |
| A | 12 | 189 | 17729 | 148.96 | 577 | 567 | 115.2 |
| B | 5 | 172 | 744330 | 6998.46 | 566 | 553 | 106.3 |
| B | 4 | 81 | 38968 | 361.46 | 566 | 553 | 106.3 |
| B | 5 | 184 | 32589 | 301.44 | 566 | 553 | 106.3 |
| C | 15 | 214 | 225572 | 1751.63 | 559 | 562 | 128.5 |
| C | 0 | 10 | 217007 | 1684.95 | 559 | 562 | 128.5 |
| C | 14 | 254 | 15764 | 118.34 | 559 | 562 | 128.5 |
| D | 1 | 52 | 361534 | 2643.32 | 560 | 546 | 136.6 |
| D | 13 | 249 | 133539 | 973.84 | 560 | 546 | 136.6 |
| D | 2 | 249 | 105329 | 767.27 | 560 | 546 | 136.6 |
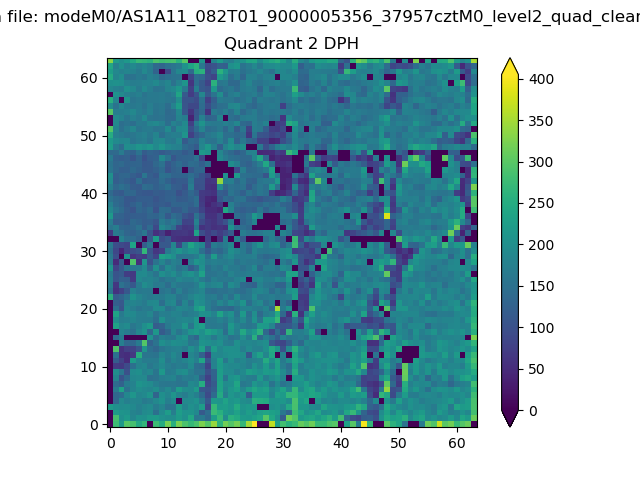
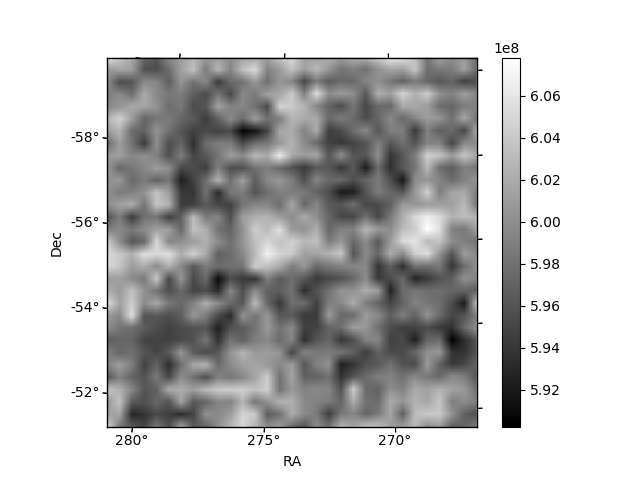
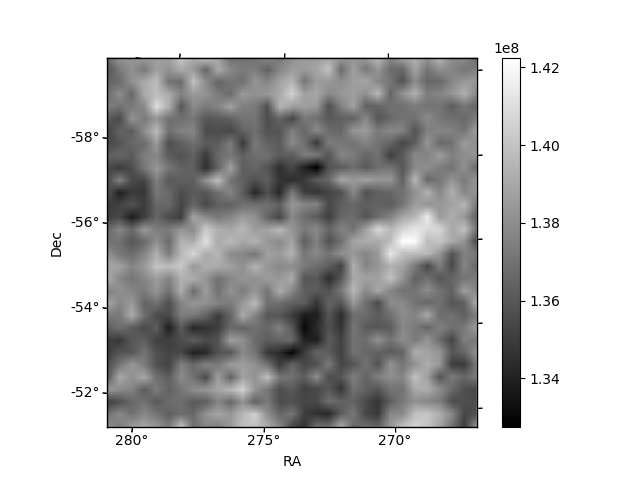
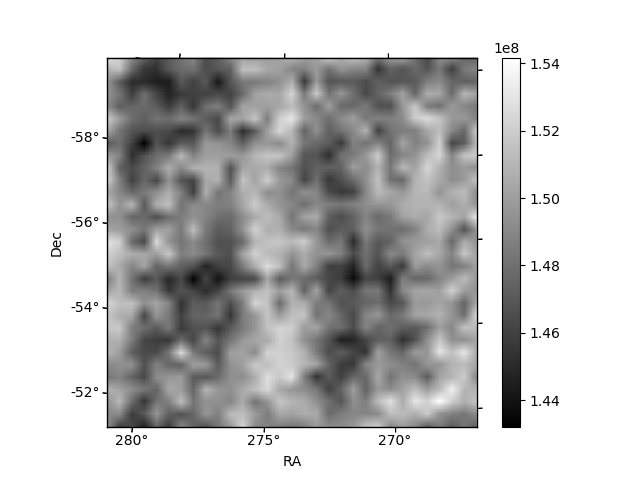
Histogram calculated using DETX and DETY for each event in the final _common_clean file
| Quadrant A | 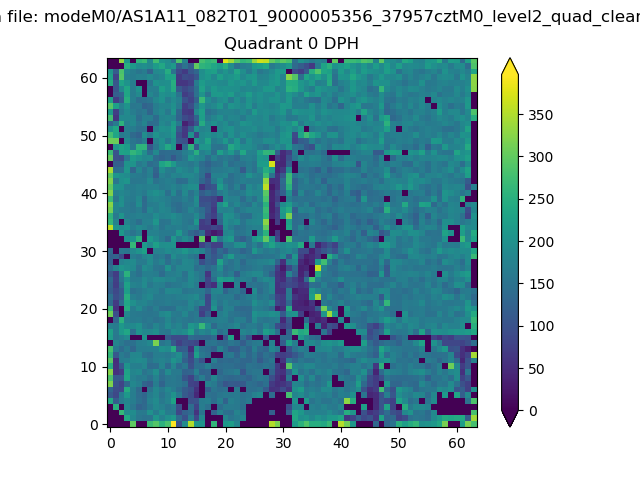 |
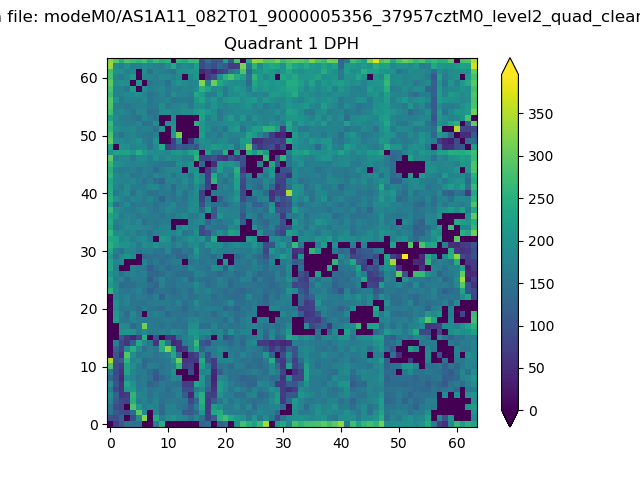 |
Quadrant B |
|---|---|---|---|
| Quadrant D | 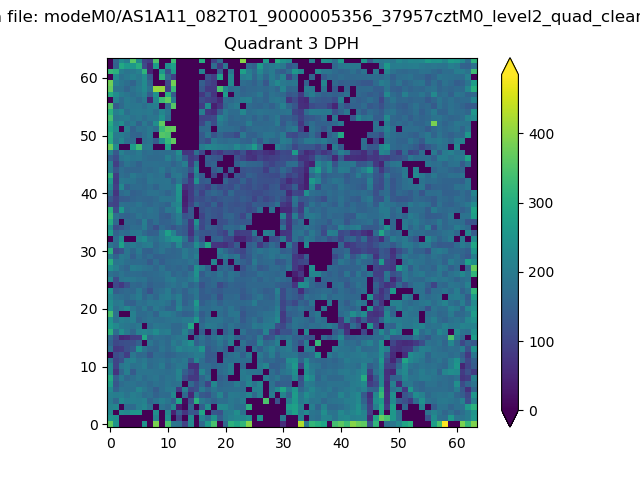 |
 |
Quadrant C |
| Plot type | Count rate plots | Images |
|---|---|---|
| Comparison with Poisson distribution Blue bars denote a histogram of data divided into 1 sec bins. Red curve is a Poisson curve with rate = median count rate of data. |
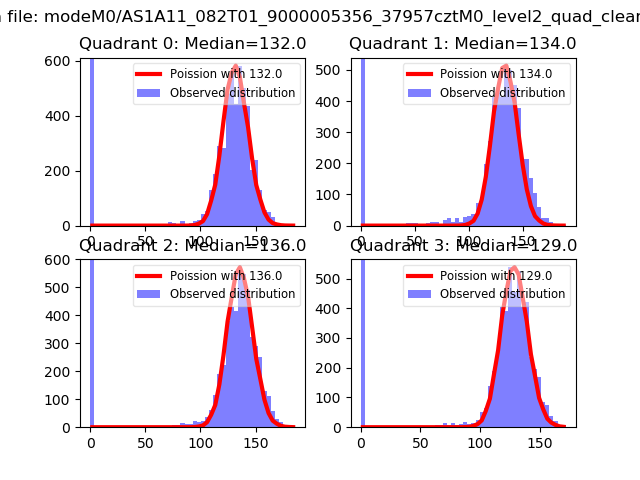 |
 |
| Quadrant-wise count rates Data is divided into 100 sec bins |
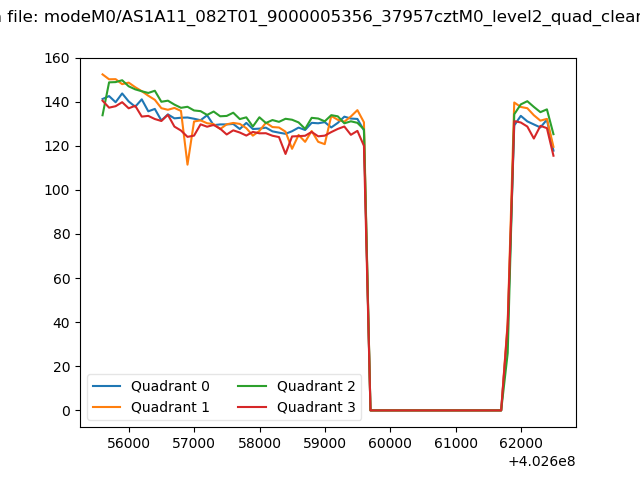 |
|
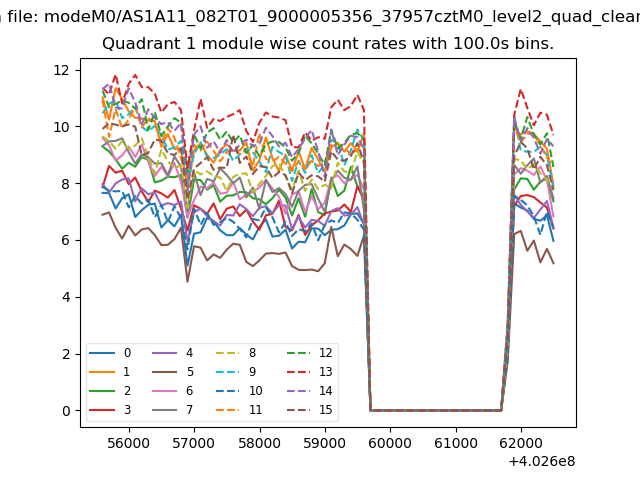
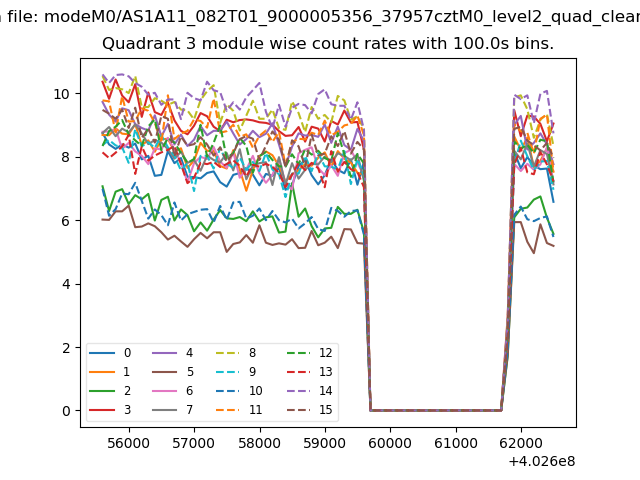
| Module-wise count rates for Quadrant A Data is divided into 100 sec bins |
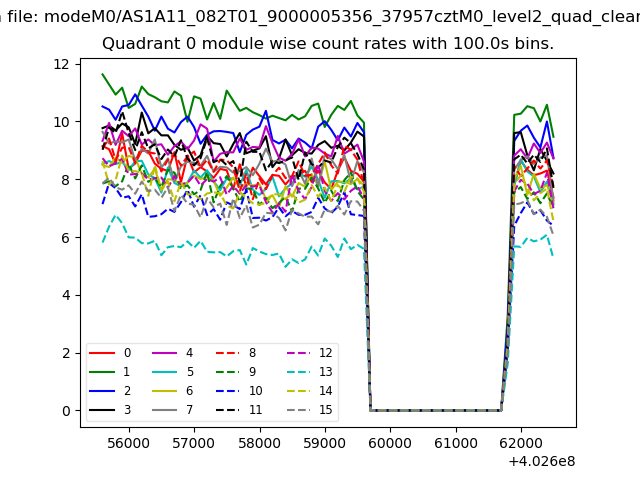 |
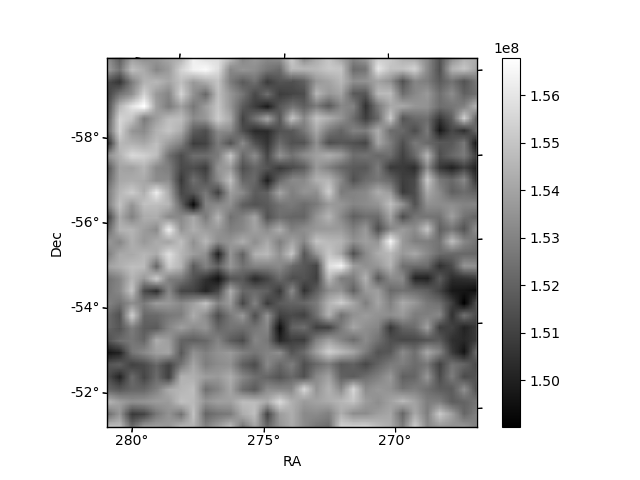 |
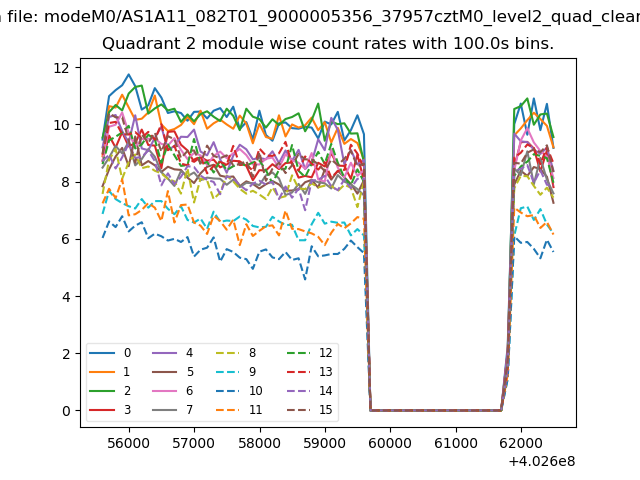
| Module-wise count rates for Quadrant B Data is divided into 100 sec bins |
 |
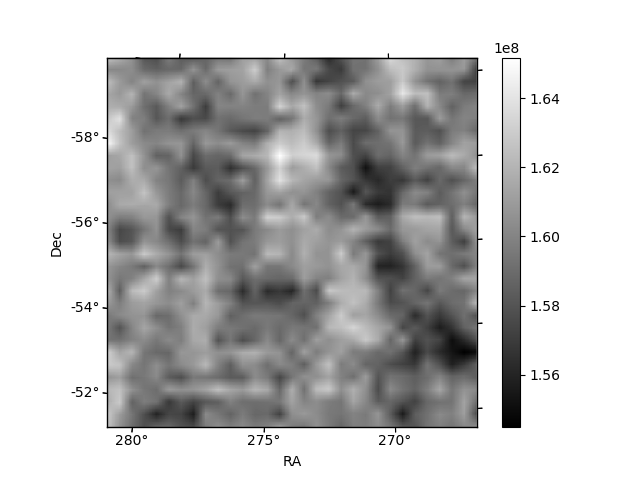 |
| Module-wise count rates for Quadrant C Data is divided into 100 sec bins |
 |
 |
| Module-wise count rates for Quadrant D Data is divided into 100 sec bins |
 |
 |
| Parameter | Plot |
|---|---|
| CZT HV Monitor | 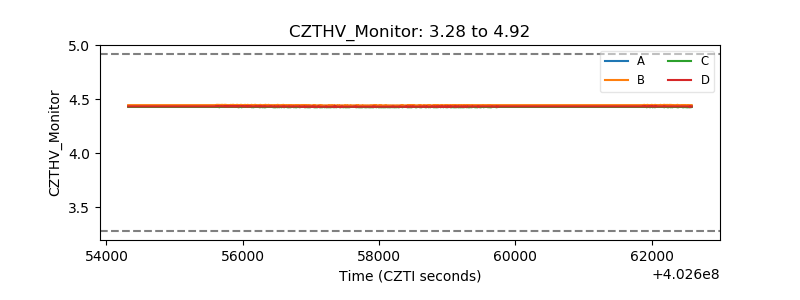 |
| D_VDD | 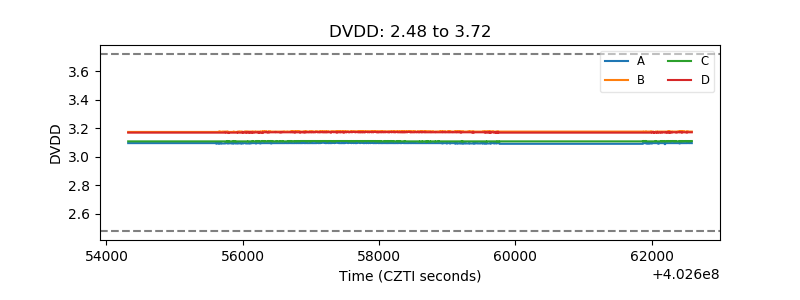 |
| Temperature 1 | 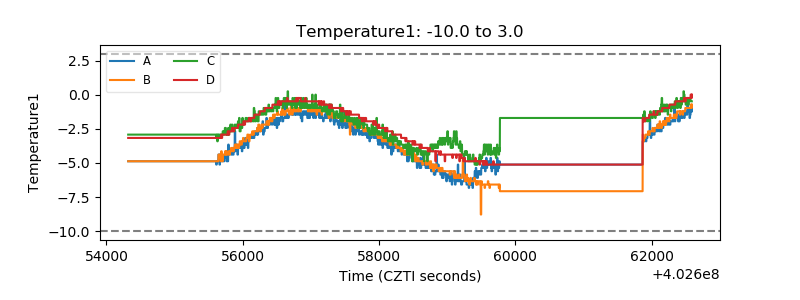 |
| Veto HV Monitor | 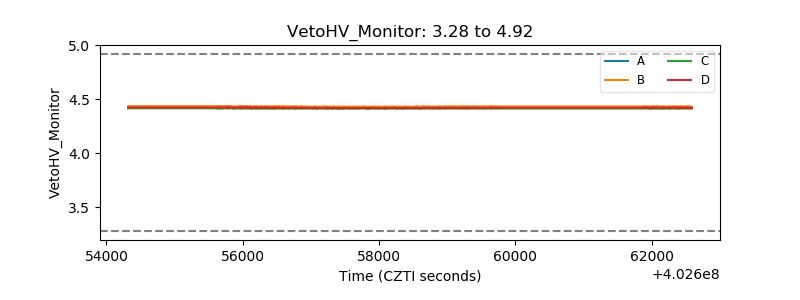 |
| Veto LLD | 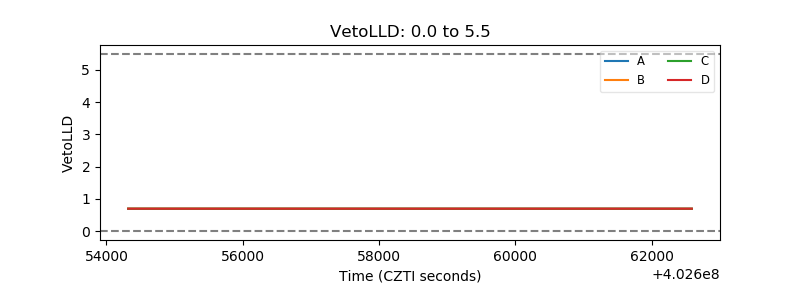 |
| Alpha Counter | 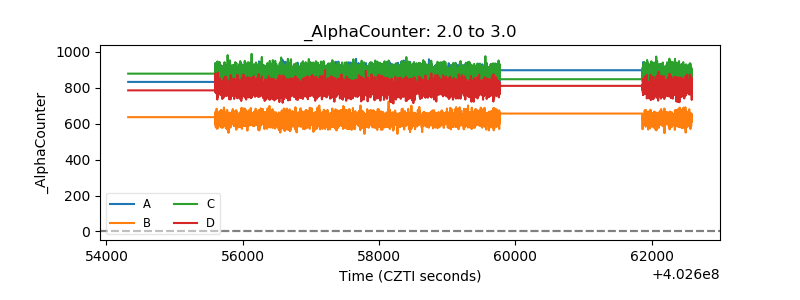 |
| _CPM_Rate | 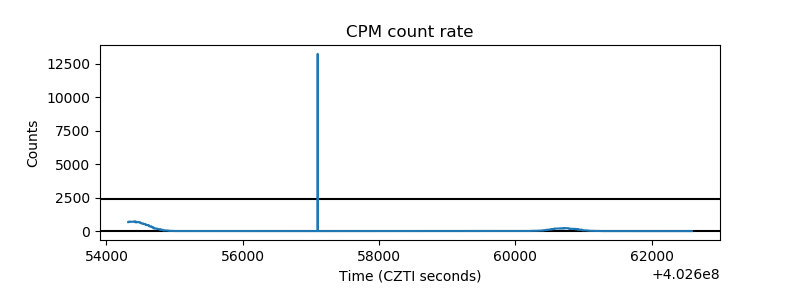 |
| CZT Counter | 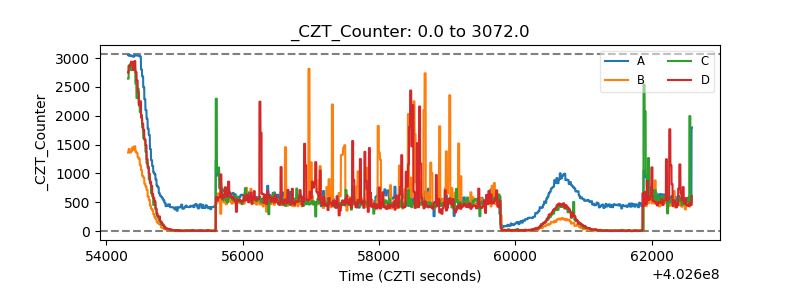 |
| +2.5 Volts monitor | 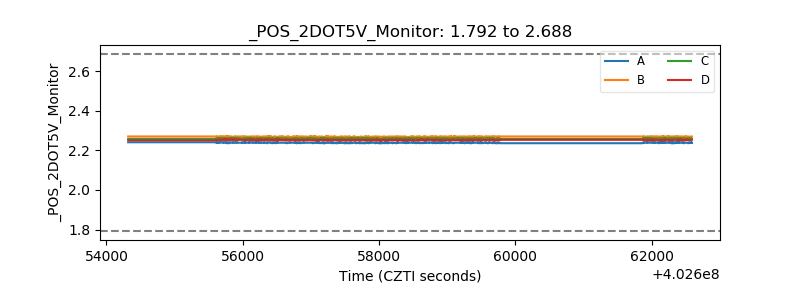 |
| +5 Volts monitor | 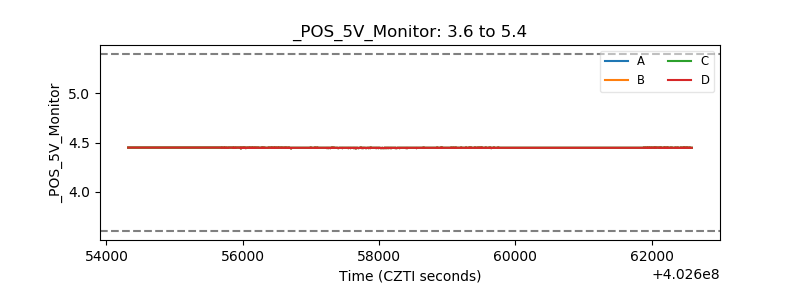 |
| _ROLL_ROT | 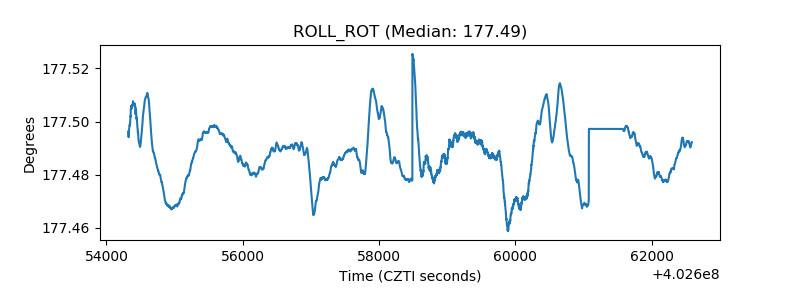 |
| _Roll_DEC | 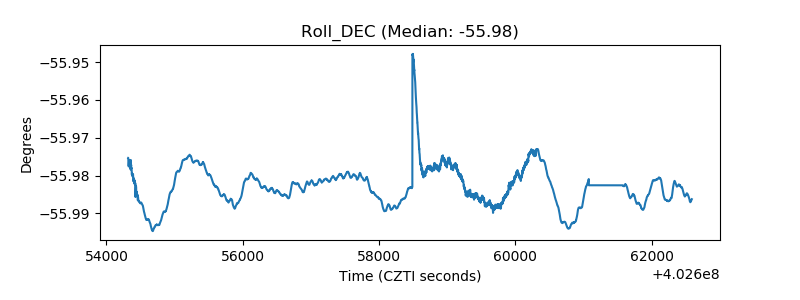 |
| _Roll_RA | 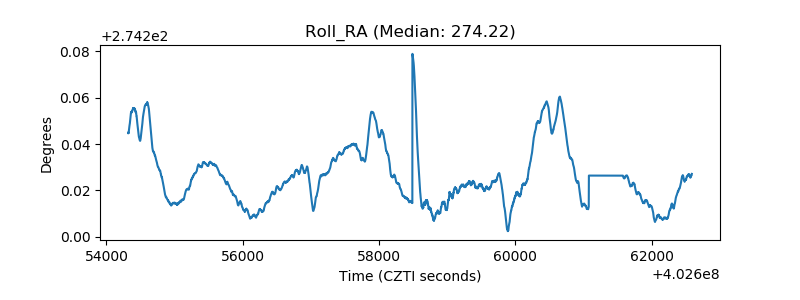 |
| Veto Counter | 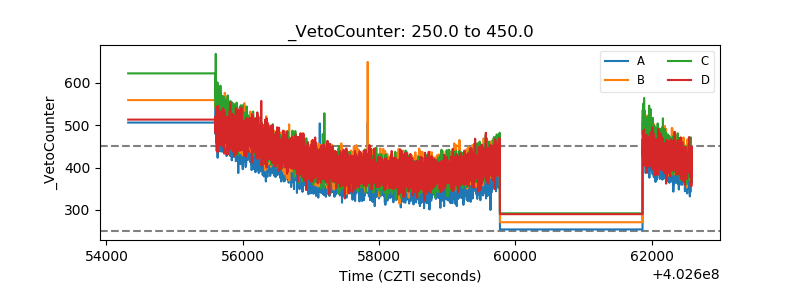 |