| Param | Original file | Final file |
|---|---|---|
| Filename | modeM0/AS1A11_082T01_9000005356_37958cztM0_level2.evt | modeM0/AS1A11_082T01_9000005356_37958cztM0_level2_quad_clean.evt |
| Size (bytes) | 441,190,080 | 79,568,640 |
| Size | 420.8 MB | 75.9 MB |
| Events in quadrant A | 3,068,900 | 519,356 |
| Events in quadrant B | 3,181,065 | 526,038 |
| Events in quadrant C | 2,833,665 | 522,532 |
| Events in quadrant D | 3,908,132 | 460,253 |
| Mode M0 | |||
|---|---|---|---|
| Quadrant | BADHDUFLAG | Total packets | Discarded packets |
| A | 0 | 12443 | 3 |
| B | 0 | 12961 | 2 |
| C | 0 | 11679 | 2 |
| D | 0 | 15179 | 2 |
| Mode SS | |||
|---|---|---|---|
| Quadrant | BADHDUFLAG | Total packets | Discarded packets |
| A | 0 | 110 | 0 |
| B | 0 | 110 | 0 |
| C | 0 | 110 | 0 |
| D | 0 | 110 | 0 |
| Mode M9 | |||
|---|---|---|---|
| Quadrant | BADHDUFLAG | Total packets | Discarded packets |
| A | 0 | 21 | 0 |
| B | 0 | 21 | 0 |
| C | 0 | 21 | 0 |
| D | 0 | 22 | 0 |
| Quadrant | Total seconds | Saturated seconds | Saturation percentage |
|---|---|---|---|
| A | 5447 | 29 | 0.532403% |
| B | 5447 | 110 | 2.019460% |
| C | 5447 | 54 | 0.991371% |
| D | 5447 | 312 | 5.727924% |
Noise dominated data is calculated using 1-second bins in cleaned event files. If a bin has >2000 counts, and if more than 50% of those come from <1% of pixels, then it is considered to be noise-dominated and hence unusable.
| Quadrant | # 1 sec bins | Bins with >0 counts | Bins with >2000 counts | High rate bins dominated by noise | Noise dominated (total time) | Noise dominated (detector-on time) | Marked lightcurve |
|---|---|---|---|---|---|---|---|
| A | 7299 | 5448 | 13 | 13 | 0.18% | 0.24% | 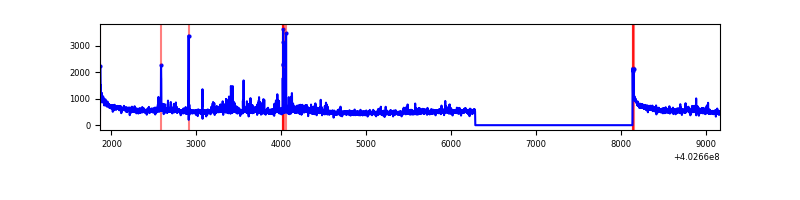 |
| B | 7299 | 5448 | 87 | 87 | 1.19% | 1.60% | 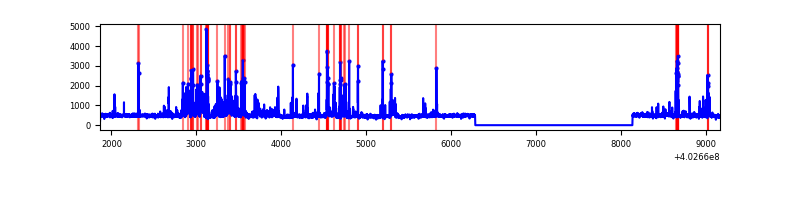 |
| C | 7299 | 5448 | 35 | 35 | 0.48% | 0.64% | 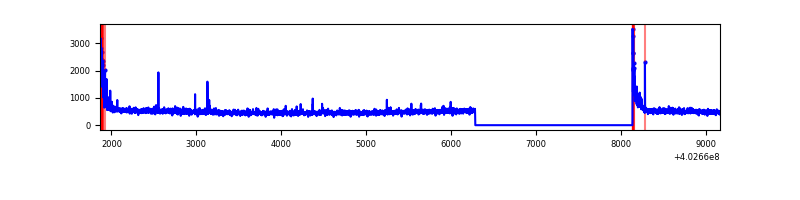 |
| D | 7299 | 5448 | 295 | 295 | 4.04% | 5.41% | 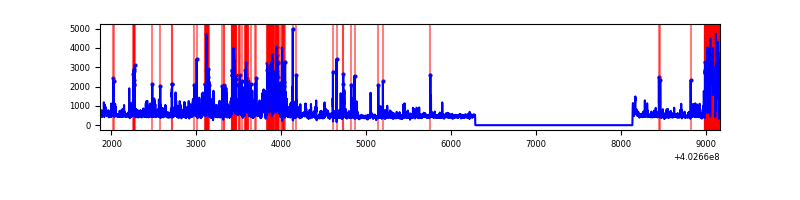 |
Top three noisy pixels from each quadrant. If the there are fewer than three noisy pixels in the level2.evt file, extra rows are filled as -1
| Pixel properties | Quadrant properties | ||||||
|---|---|---|---|---|---|---|---|
| Quadrant | DetID | PixID | Counts | Sigma | Mean | Median | Sigma |
| A | 10 | 83 | 396234 | 3171.84 | 617 | 606 | 124.7 |
| A | 15 | 222 | 208324 | 1665.32 | 617 | 606 | 124.7 |
| A | 13 | 248 | 36154 | 285.0 | 617 | 606 | 124.7 |
| B | 5 | 172 | 274983 | 2343.85 | 610 | 594 | 117.1 |
| B | 5 | 184 | 154918 | 1318.25 | 610 | 594 | 117.1 |
| B | 0 | 186 | 120641 | 1025.45 | 610 | 594 | 117.1 |
| C | 15 | 214 | 238451 | 1716.39 | 596 | 601 | 138.6 |
| C | 0 | 10 | 226639 | 1631.15 | 596 | 601 | 138.6 |
| C | 14 | 254 | 21581 | 151.4 | 596 | 601 | 138.6 |
| D | 1 | 52 | 511539 | 3583.58 | 586 | 571 | 142.6 |
| D | 12 | 227 | 451060 | 3159.42 | 586 | 571 | 142.6 |
| D | 2 | 249 | 243875 | 1706.37 | 586 | 571 | 142.6 |
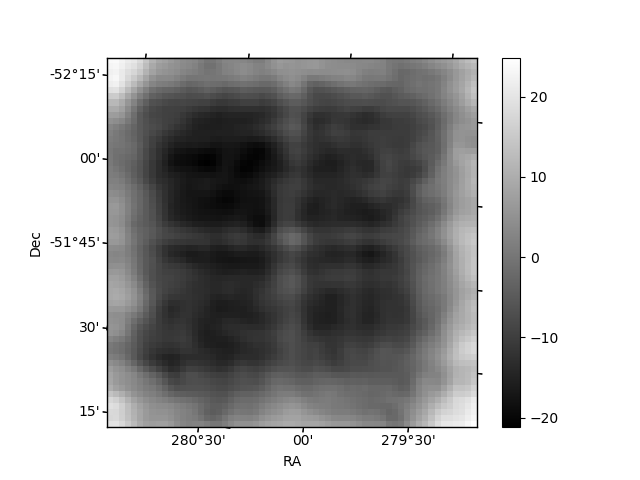
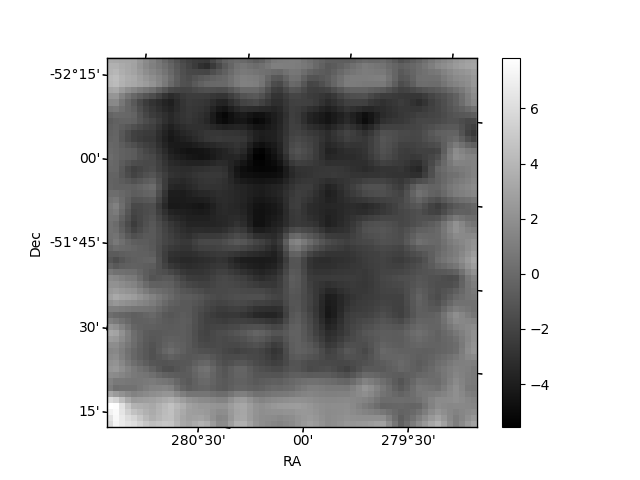
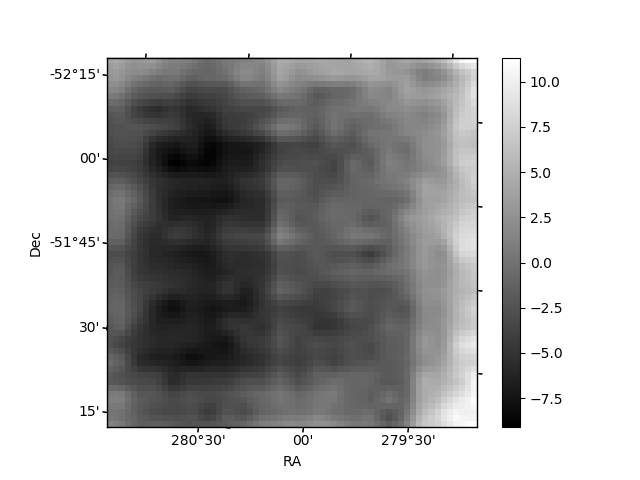
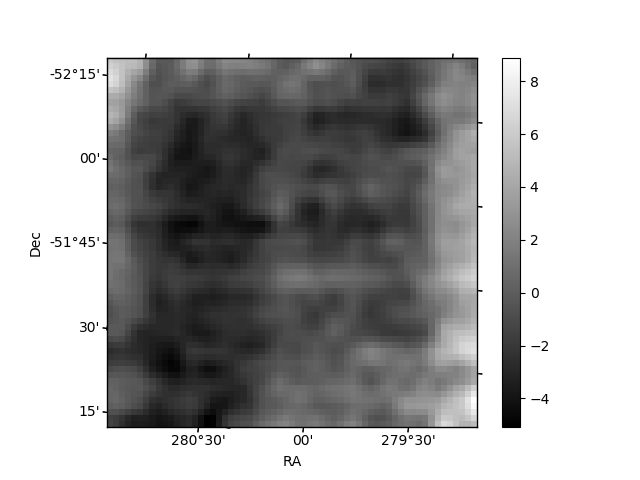
Histogram calculated using DETX and DETY for each event in the final _common_clean file
| Quadrant A | 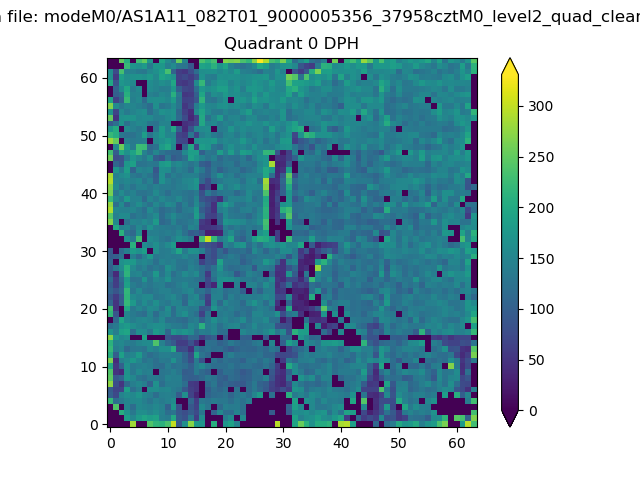 |
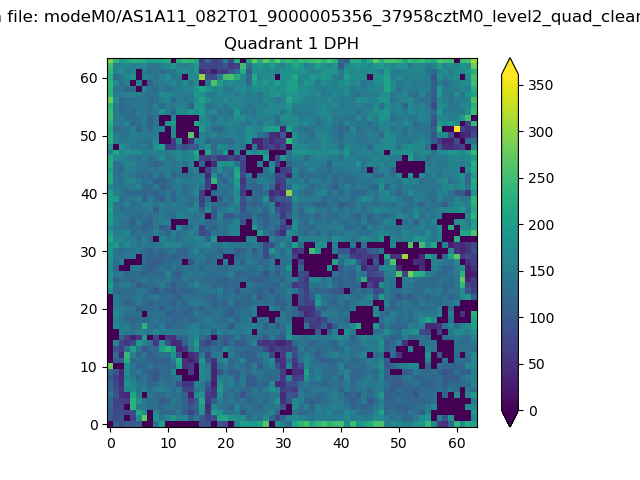 |
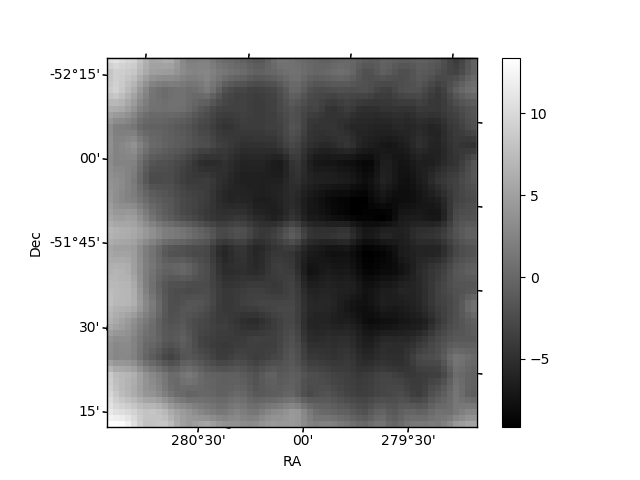
Quadrant B |
|---|---|---|---|
| Quadrant D | 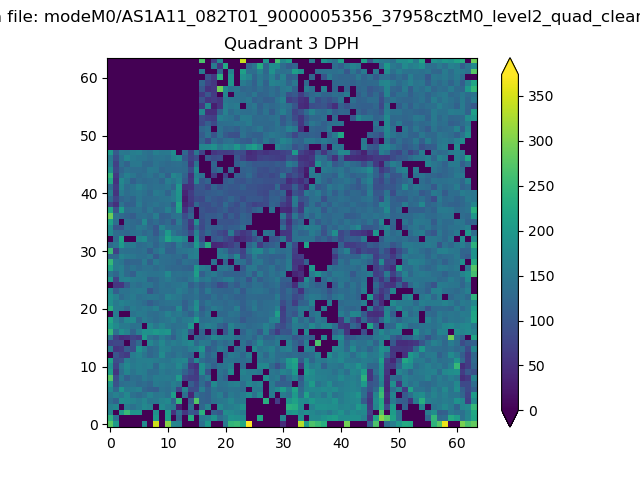 |
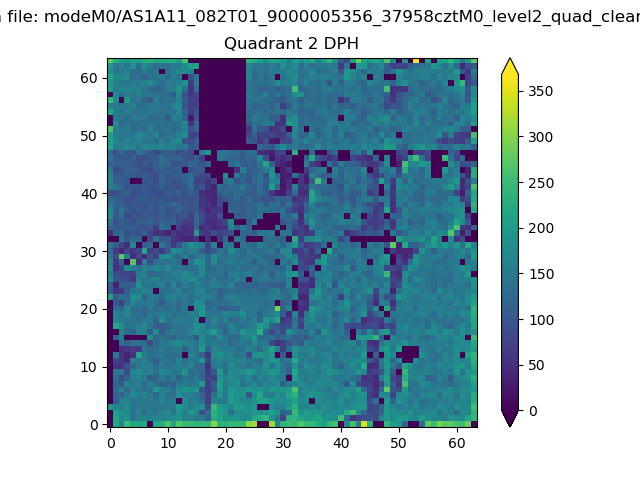 |
Quadrant C |
| Plot type | Count rate plots | Images |
|---|---|---|
| Comparison with Poisson distribution Blue bars denote a histogram of data divided into 1 sec bins. Red curve is a Poisson curve with rate = median count rate of data. |
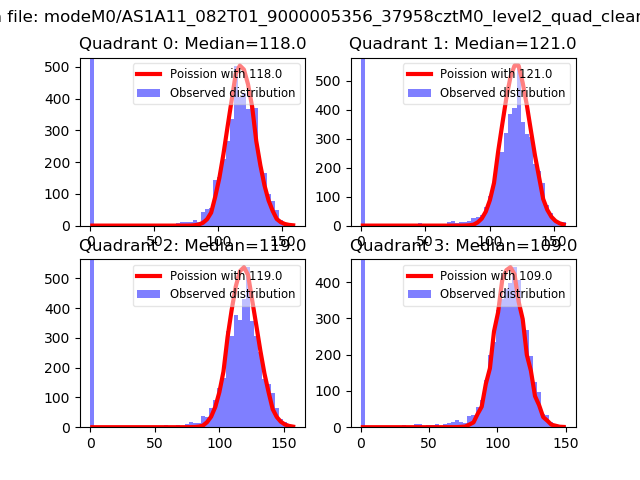 |
 |
| Quadrant-wise count rates Data is divided into 100 sec bins |
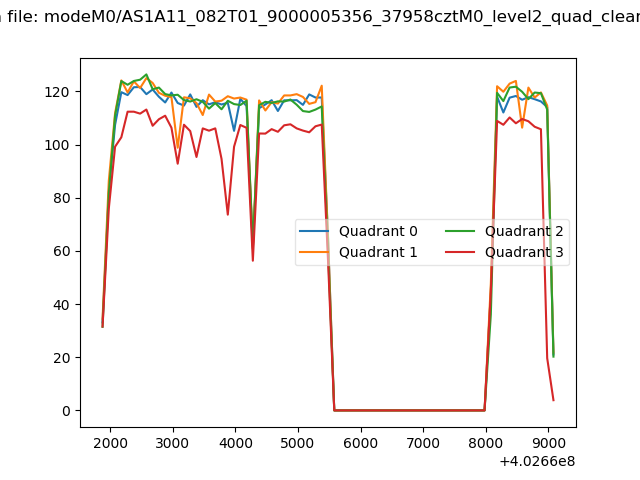 |
|
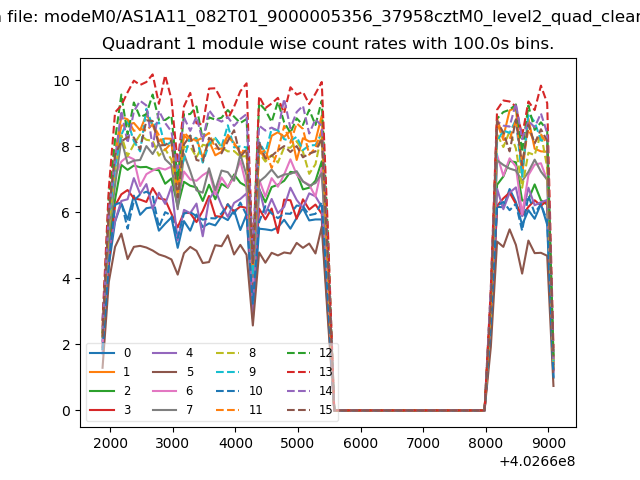
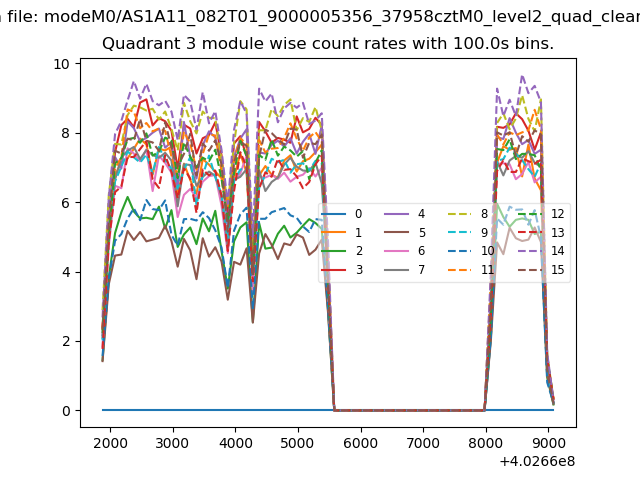
| Module-wise count rates for Quadrant A Data is divided into 100 sec bins |
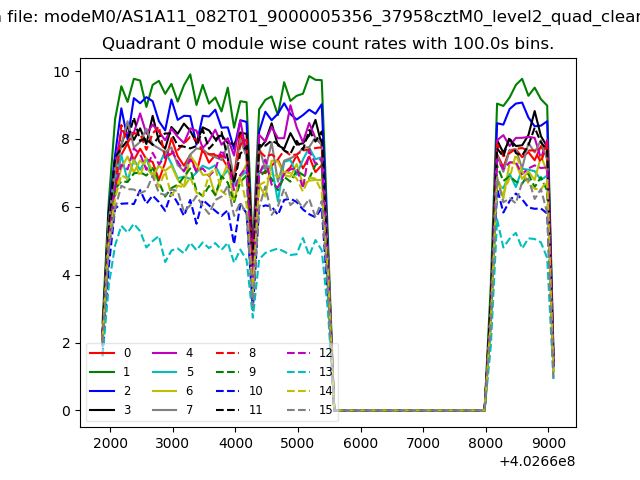 |
 |
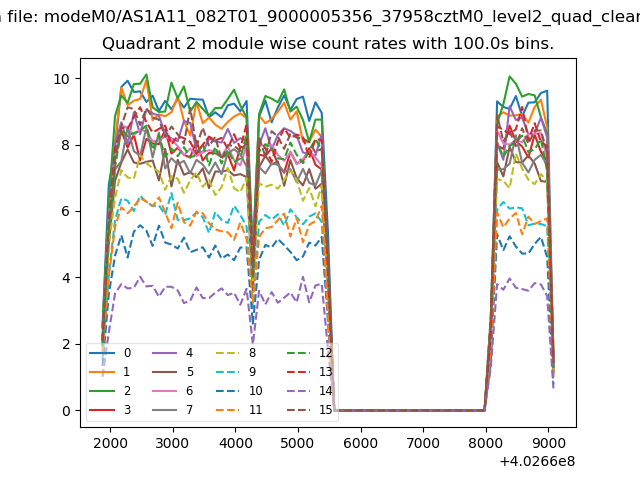
| Module-wise count rates for Quadrant B Data is divided into 100 sec bins |
 |
 |
| Module-wise count rates for Quadrant C Data is divided into 100 sec bins |
 |
 |
| Module-wise count rates for Quadrant D Data is divided into 100 sec bins |
 |
 |
| Parameter | Plot |
|---|---|
| CZT HV Monitor |  |
| D_VDD | 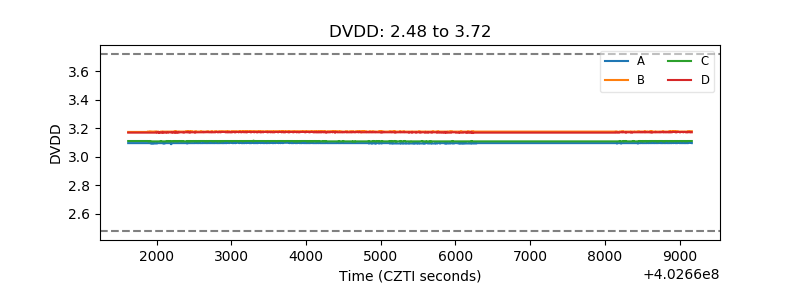 |
| Temperature 1 | 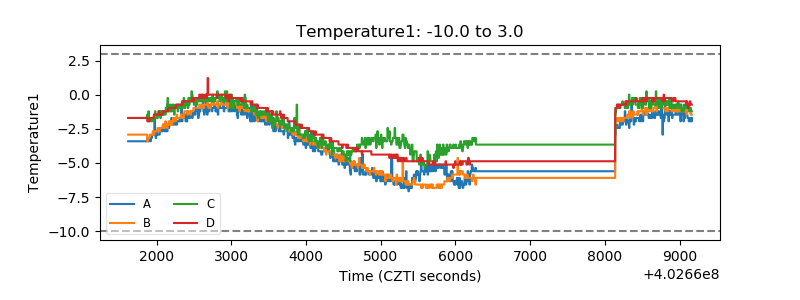 |
| Veto HV Monitor | 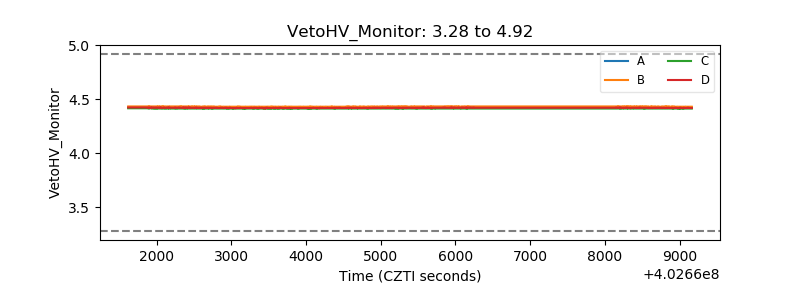 |
| Veto LLD | 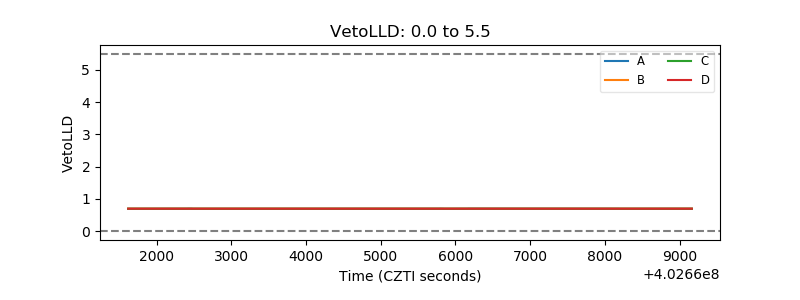 |
| Alpha Counter | 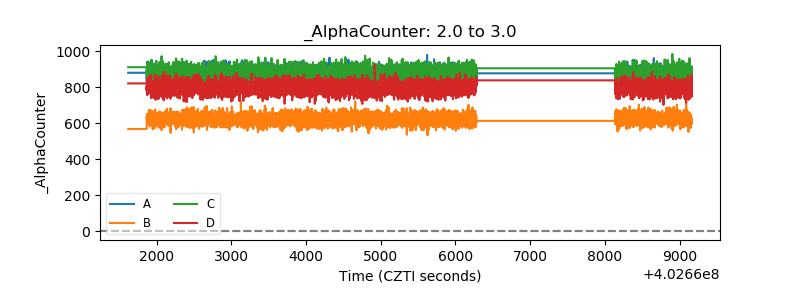 |
| _CPM_Rate | 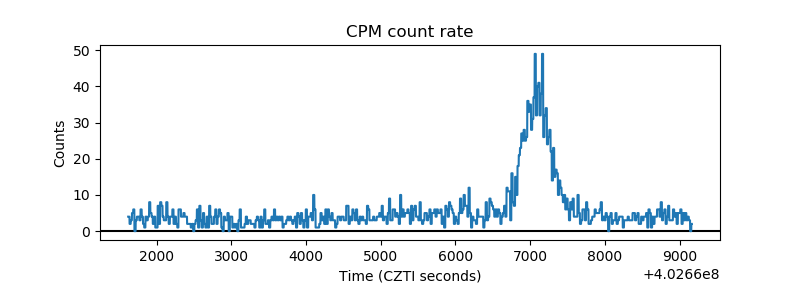 |
| CZT Counter | 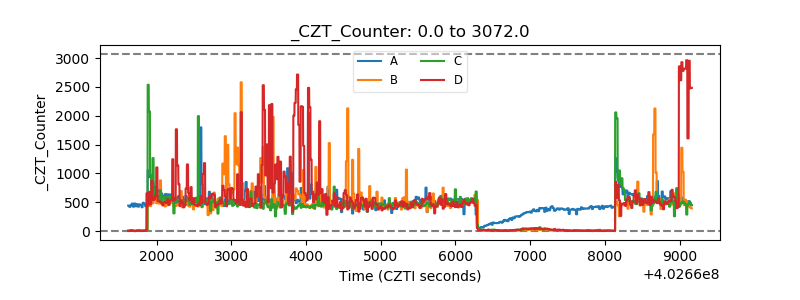 |
| +2.5 Volts monitor | 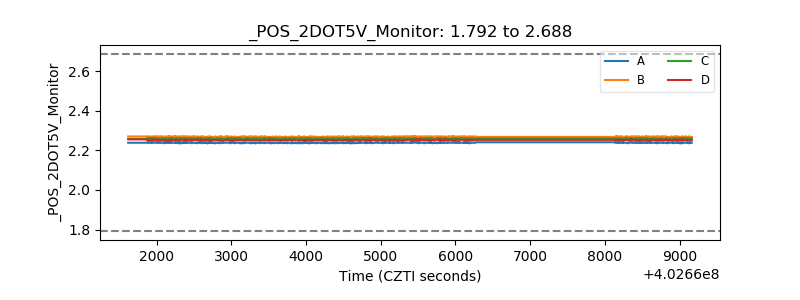 |
| +5 Volts monitor | 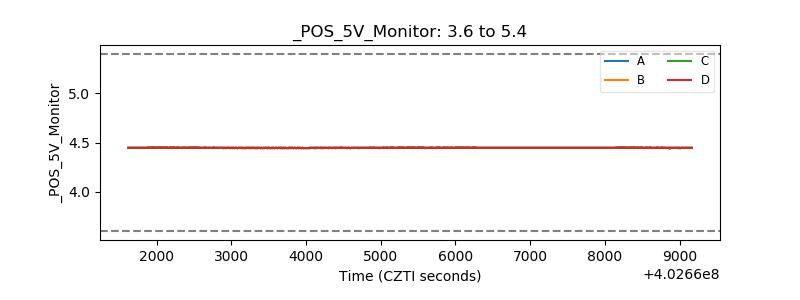 |
| _ROLL_ROT | 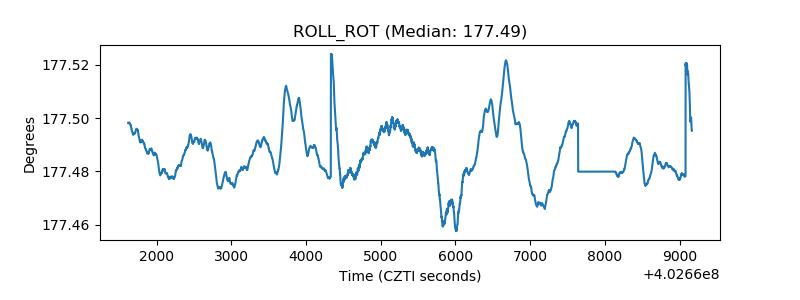 |
| _Roll_DEC | 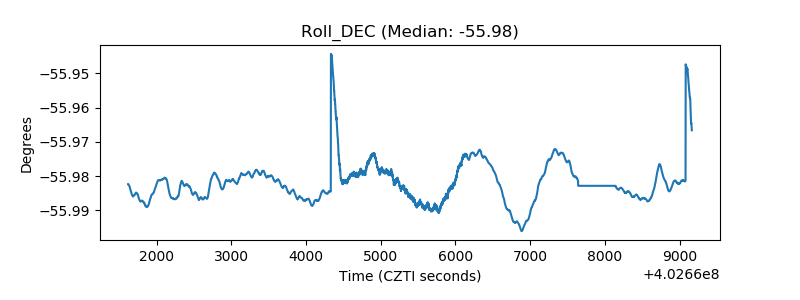 |
| _Roll_RA | 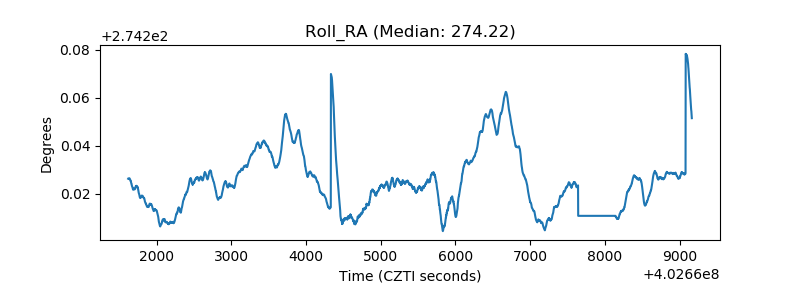 |
| Veto Counter | 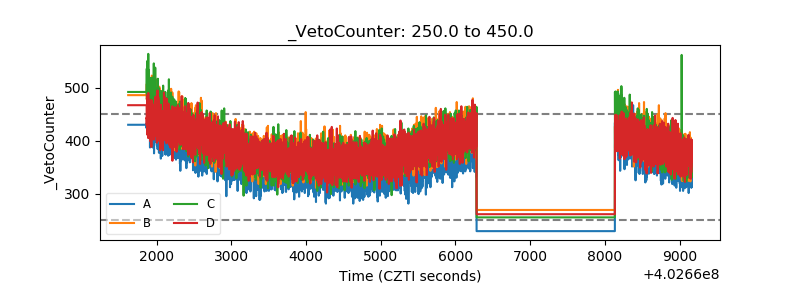 |