| Param | Original file | Final file |
|---|---|---|
| Filename | modeM0/AS1A11_082T01_9000005356_37959cztM0_level2.evt | modeM0/AS1A11_082T01_9000005356_37959cztM0_level2_quad_clean.evt |
| Size (bytes) | 429,998,400 | 80,205,120 |
| Size | 410.1 MB | 76.5 MB |
| Events in quadrant A | 3,086,597 | 509,388 |
| Events in quadrant B | 3,181,526 | 513,937 |
| Events in quadrant C | 2,817,731 | 525,361 |
| Events in quadrant D | 3,547,829 | 480,024 |
| Mode M0 | |||
|---|---|---|---|
| Quadrant | BADHDUFLAG | Total packets | Discarded packets |
| A | 0 | 12777 | 3 |
| B | 0 | 13260 | 2 |
| C | 0 | 11943 | 2 |
| D | 0 | 14403 | 2 |
| Mode SS | |||
|---|---|---|---|
| Quadrant | BADHDUFLAG | Total packets | Discarded packets |
| A | 0 | 116 | 0 |
| B | 0 | 116 | 0 |
| C | 0 | 116 | 0 |
| D | 0 | 116 | 0 |
| Mode M9 | |||
|---|---|---|---|
| Quadrant | BADHDUFLAG | Total packets | Discarded packets |
| A | 0 | 15 | 0 |
| B | 0 | 15 | 0 |
| C | 0 | 15 | 0 |
| D | 0 | 15 | 0 |
| Quadrant | Total seconds | Saturated seconds | Saturation percentage |
|---|---|---|---|
| A | 5723 | 16 | 0.279574% |
| B | 5723 | 119 | 2.079329% |
| C | 5723 | 24 | 0.419360% |
| D | 5723 | 250 | 4.368338% |
Noise dominated data is calculated using 1-second bins in cleaned event files. If a bin has >2000 counts, and if more than 50% of those come from <1% of pixels, then it is considered to be noise-dominated and hence unusable.
| Quadrant | # 1 sec bins | Bins with >0 counts | Bins with >2000 counts | High rate bins dominated by noise | Noise dominated (total time) | Noise dominated (detector-on time) | Marked lightcurve |
|---|---|---|---|---|---|---|---|
| A | 7216 | 5724 | 3 | 3 | 0.04% | 0.05% | 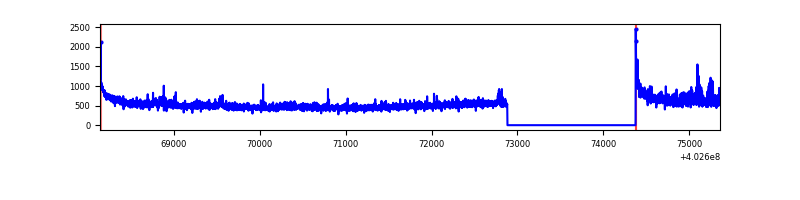 |
| B | 7216 | 5724 | 81 | 81 | 1.12% | 1.42% | 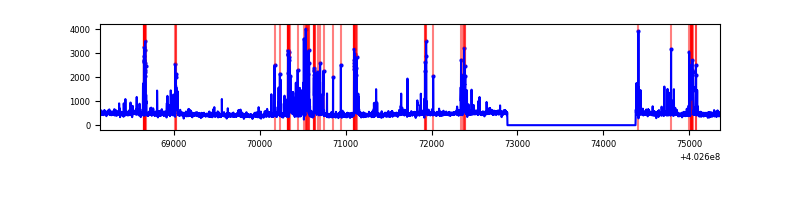 |
| C | 7216 | 5724 | 12 | 12 | 0.17% | 0.21% | 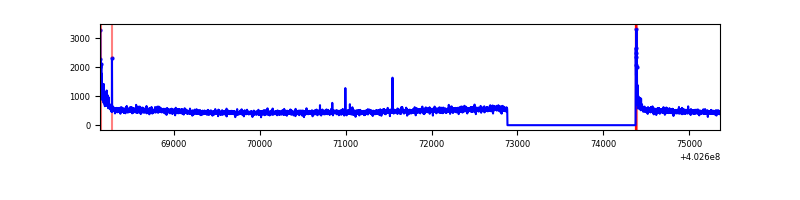 |
| D | 7216 | 5724 | 228 | 228 | 3.16% | 3.98% | 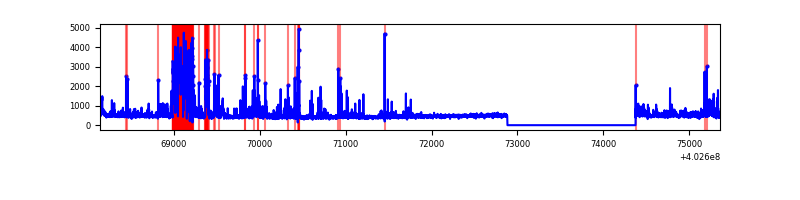 |
Top three noisy pixels from each quadrant. If the there are fewer than three noisy pixels in the level2.evt file, extra rows are filled as -1
| Pixel properties | Quadrant properties | ||||||
|---|---|---|---|---|---|---|---|
| Quadrant | DetID | PixID | Counts | Sigma | Mean | Median | Sigma |
| A | 10 | 83 | 393155 | 3038.89 | 641 | 628 | 129.2 |
| A | 15 | 222 | 167764 | 1293.94 | 641 | 628 | 129.2 |
| A | 12 | 189 | 19420 | 145.48 | 641 | 628 | 129.2 |
| B | 5 | 172 | 457328 | 3723.32 | 636 | 620 | 122.7 |
| B | 4 | 81 | 75391 | 609.57 | 636 | 620 | 122.7 |
| B | 5 | 184 | 68848 | 556.23 | 636 | 620 | 122.7 |
| C | 15 | 214 | 246319 | 1690.95 | 623 | 626 | 145.3 |
| C | 0 | 10 | 114936 | 786.72 | 623 | 626 | 145.3 |
| C | 14 | 254 | 16924 | 112.17 | 623 | 626 | 145.3 |
| D | 12 | 227 | 578999 | 3915.72 | 609 | 594 | 147.7 |
| D | 1 | 52 | 146190 | 985.66 | 609 | 594 | 147.7 |
| D | 2 | 249 | 133148 | 897.37 | 609 | 594 | 147.7 |
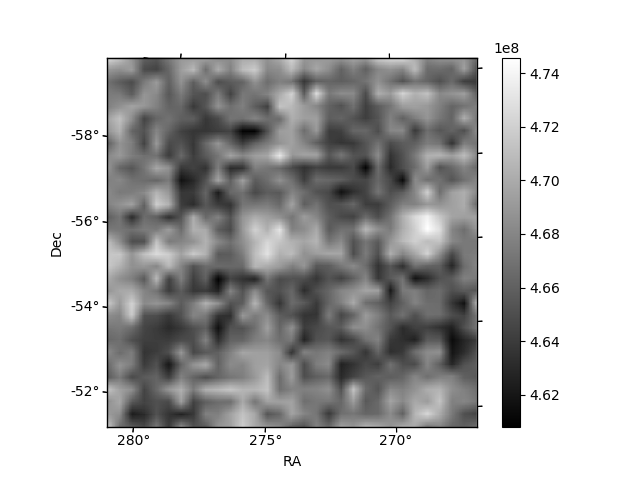
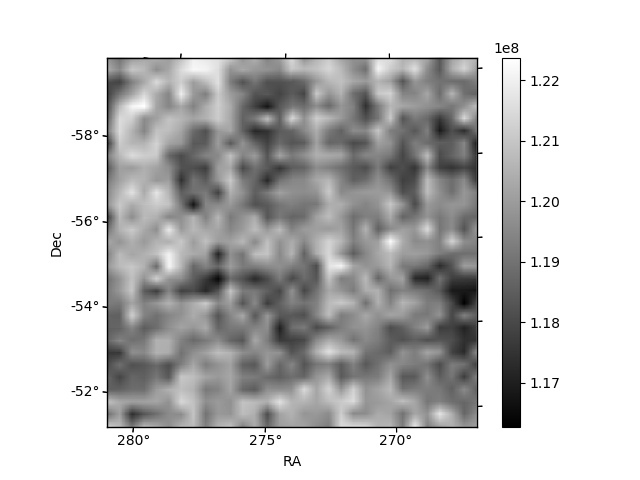
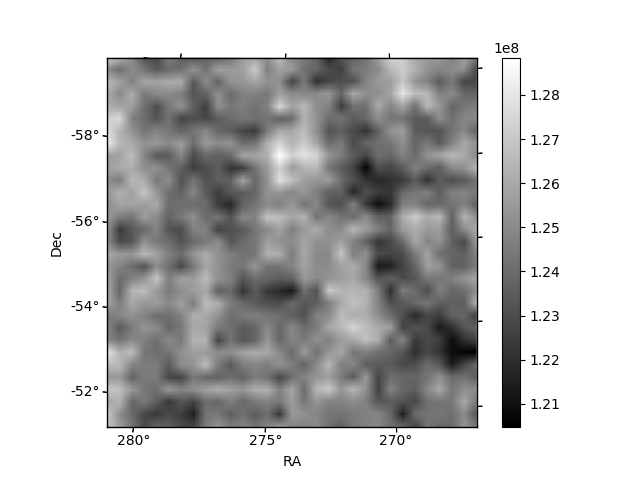
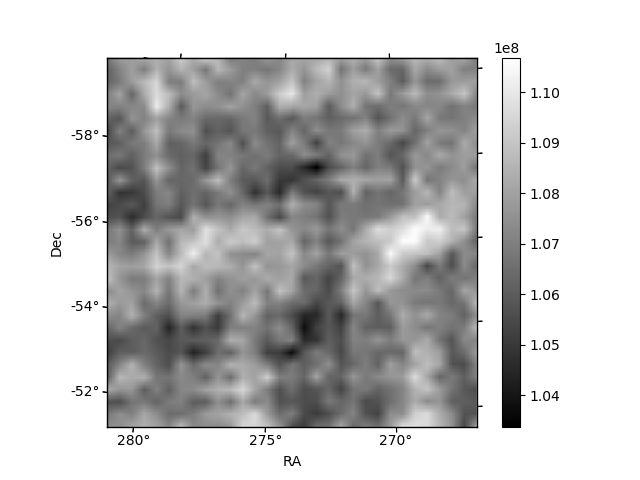
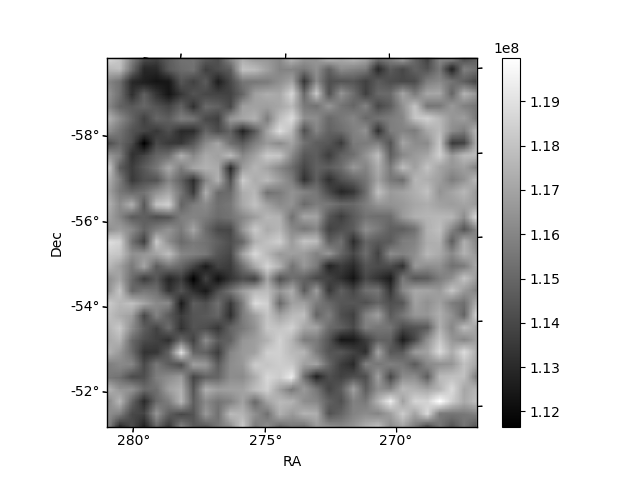
Histogram calculated using DETX and DETY for each event in the final _common_clean file
| Quadrant A | 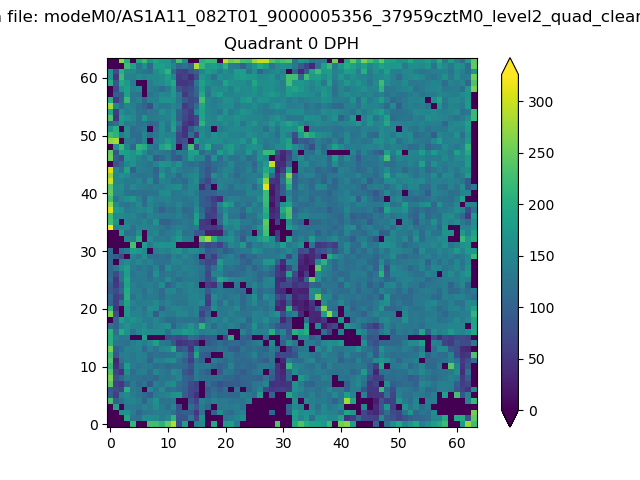 |
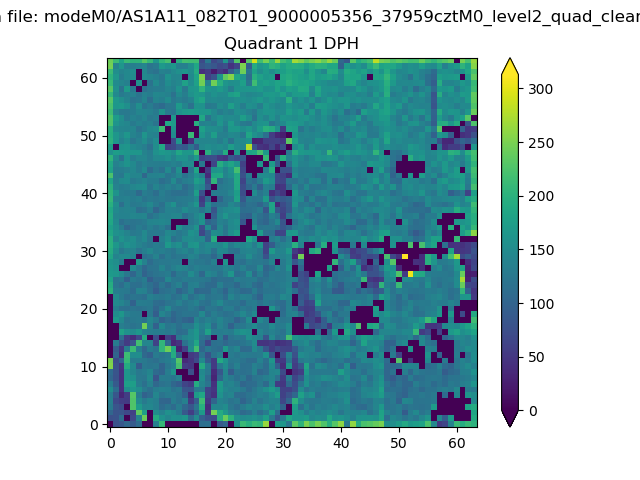 |
Quadrant B |
|---|---|---|---|
| Quadrant D | 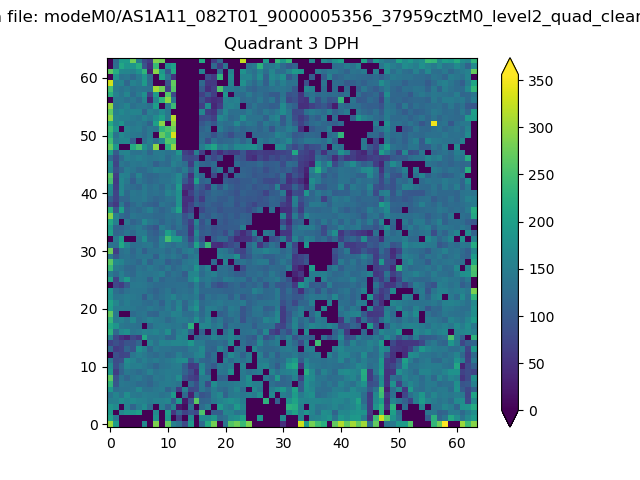 |
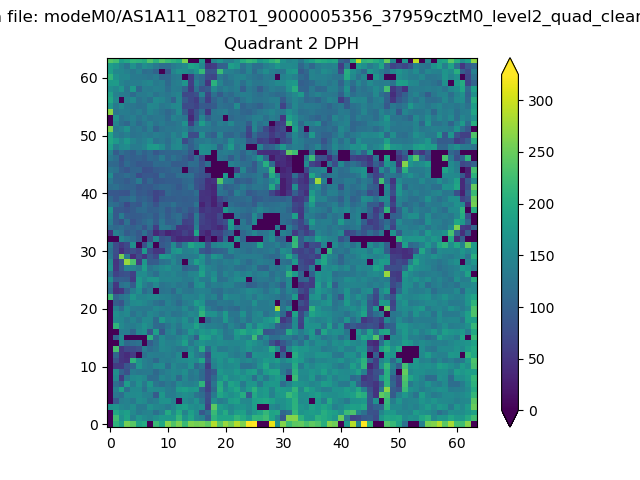 |
Quadrant C |
| Plot type | Count rate plots | Images |
|---|---|---|
| Comparison with Poisson distribution Blue bars denote a histogram of data divided into 1 sec bins. Red curve is a Poisson curve with rate = median count rate of data. |
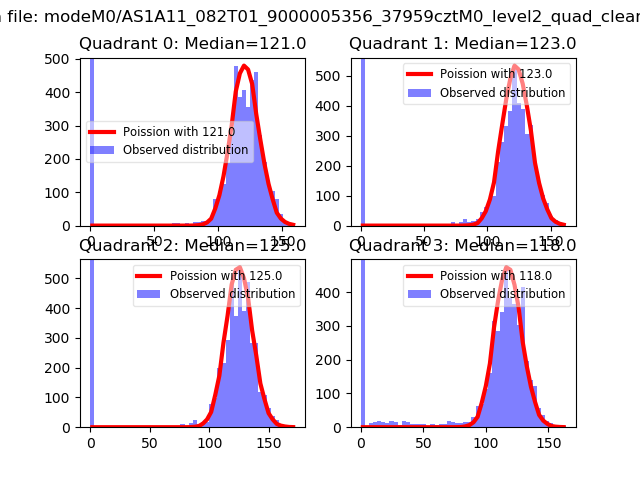 |
 |
| Quadrant-wise count rates Data is divided into 100 sec bins |
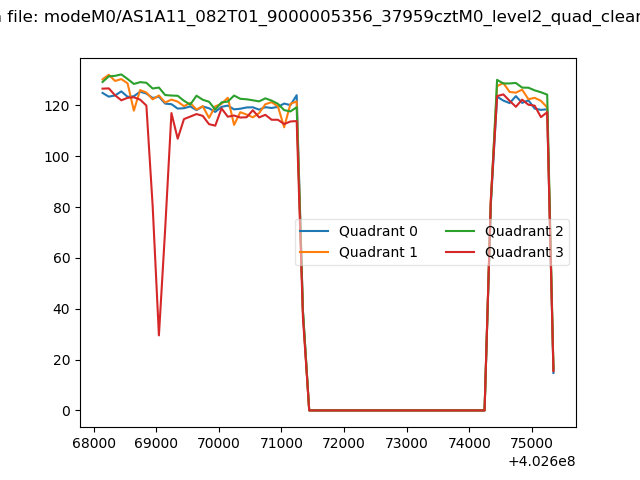 |
|
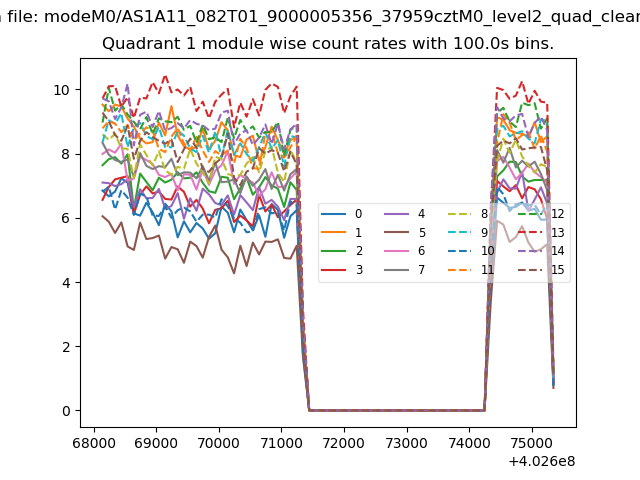
| Module-wise count rates for Quadrant A Data is divided into 100 sec bins |
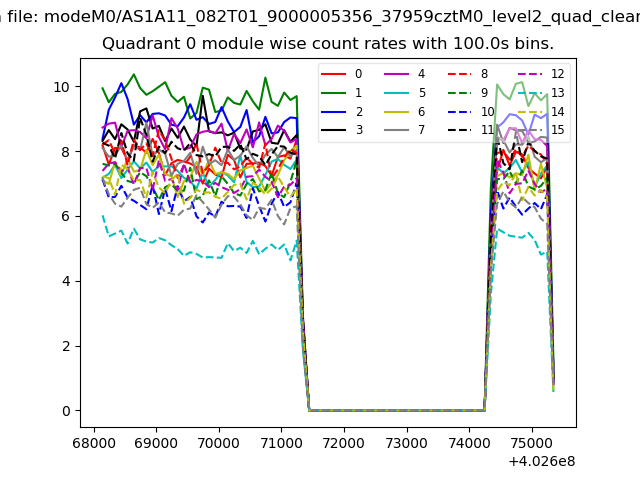 |
 |
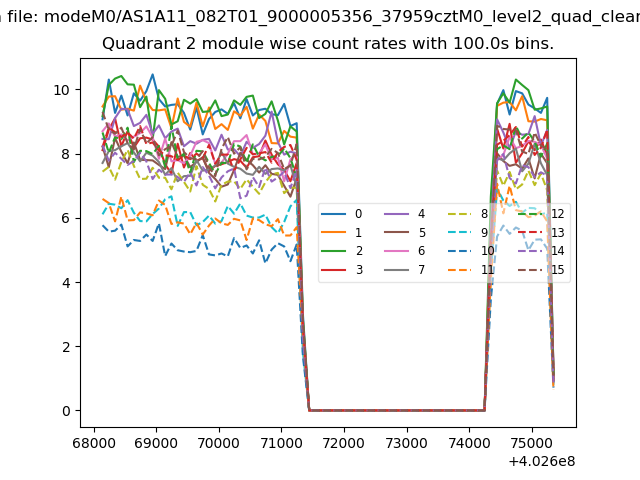
| Module-wise count rates for Quadrant B Data is divided into 100 sec bins |
 |
 |
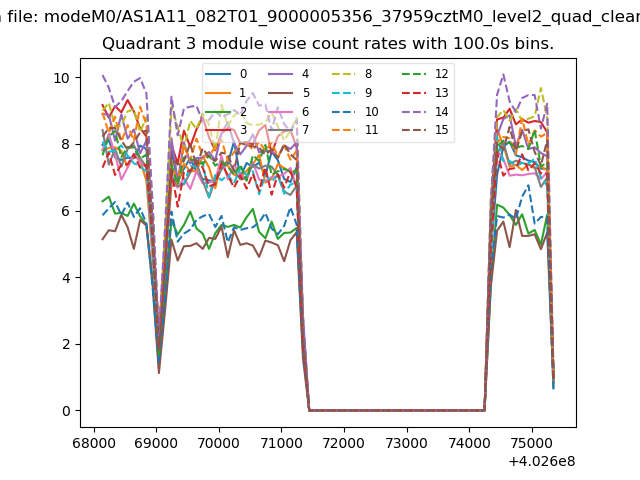
| Module-wise count rates for Quadrant C Data is divided into 100 sec bins |
 |
 |
| Module-wise count rates for Quadrant D Data is divided into 100 sec bins |
 |
 |
| Parameter | Plot |
|---|---|
| CZT HV Monitor | 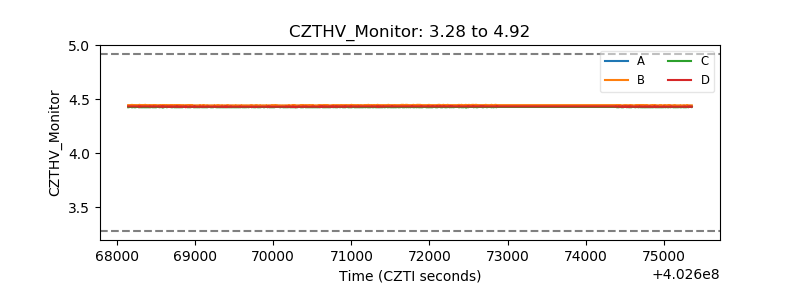 |
| D_VDD | 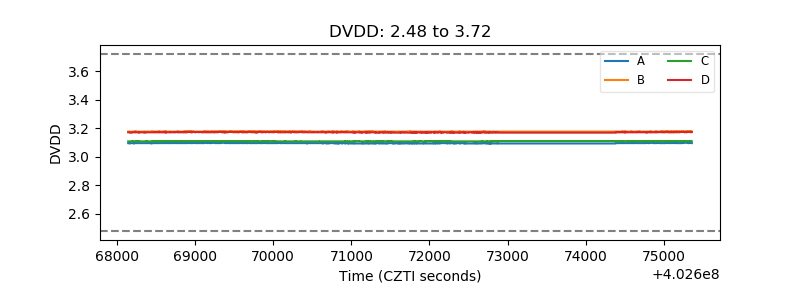 |
| Temperature 1 | 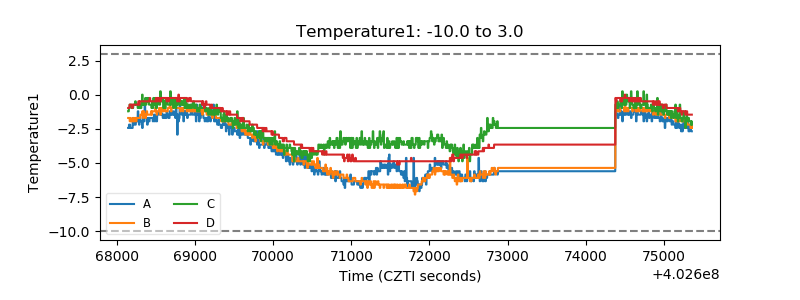 |
| Veto HV Monitor | 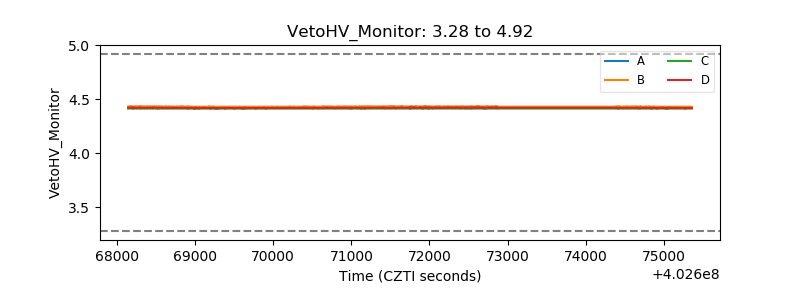 |
| Veto LLD | 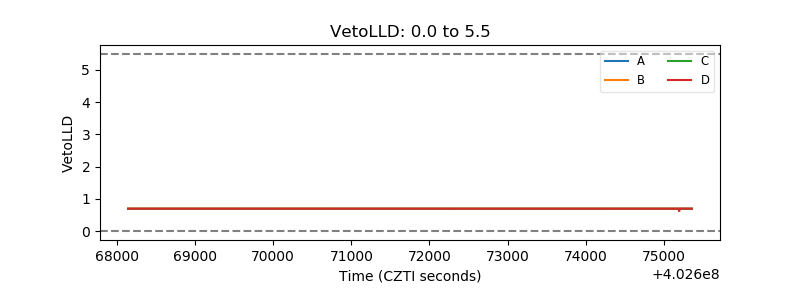 |
| Alpha Counter | 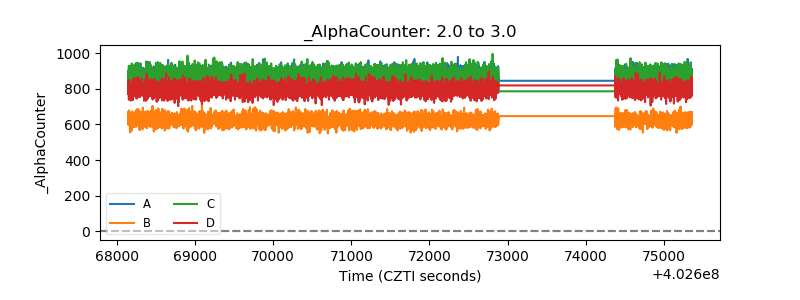 |
| _CPM_Rate | 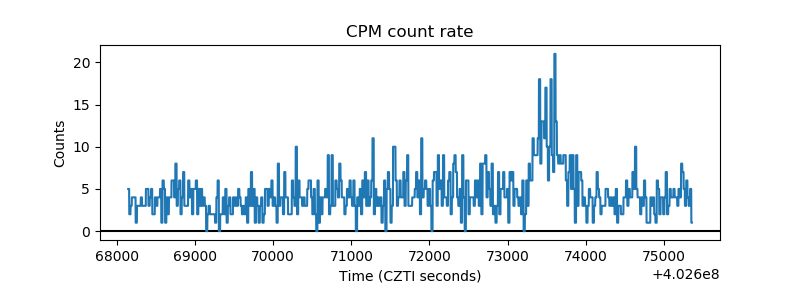 |
| CZT Counter | 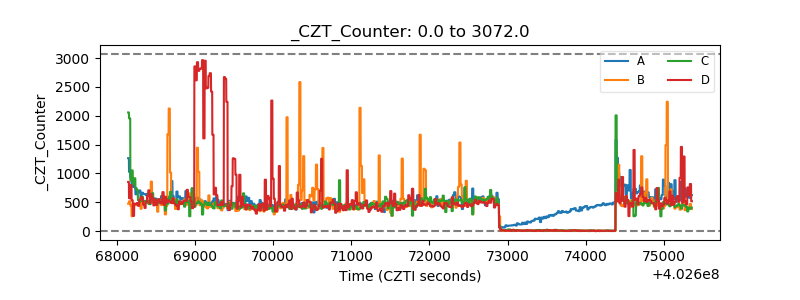 |
| +2.5 Volts monitor | 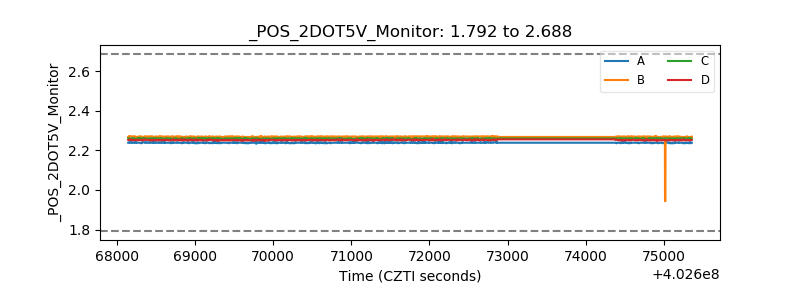 |
| +5 Volts monitor | 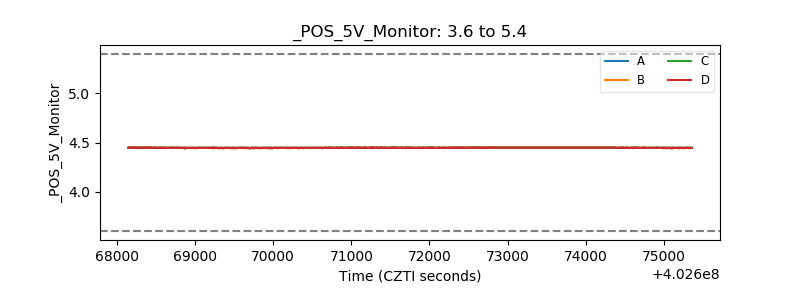 |
| _ROLL_ROT | 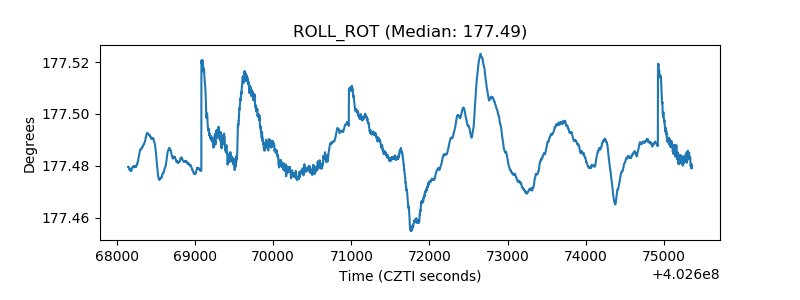 |
| _Roll_DEC | 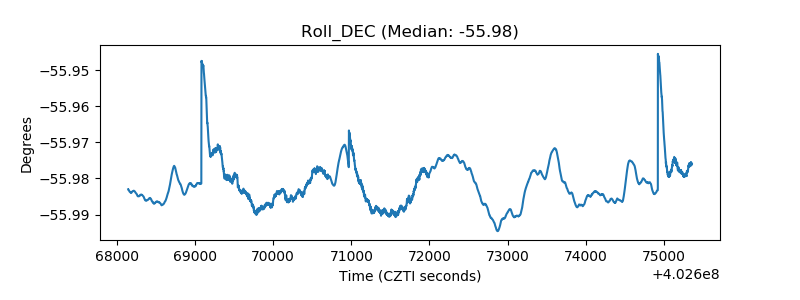 |
| _Roll_RA | 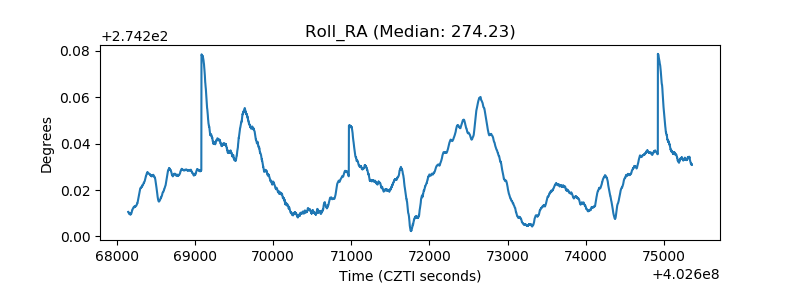 |
| Veto Counter | 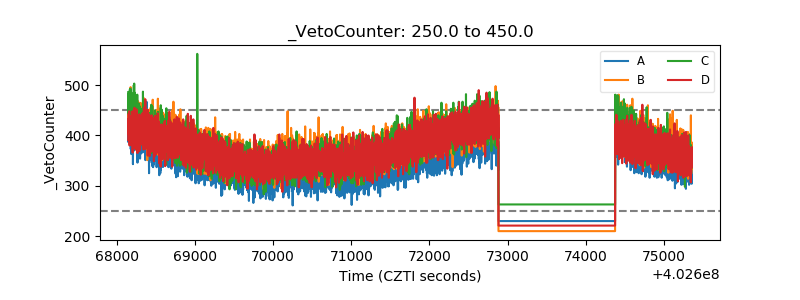 |