| Param | Original file | Final file |
|---|---|---|
| Filename | modeM0/AS1A11_082T01_9000005356_37960cztM0_level2.evt | modeM0/AS1A11_082T01_9000005356_37960cztM0_level2_quad_clean.evt |
| Size (bytes) | 439,945,920 | 69,324,480 |
| Size | 419.6 MB | 66.1 MB |
| Events in quadrant A | 3,426,247 | 436,459 |
| Events in quadrant B | 3,554,554 | 426,512 |
| Events in quadrant C | 2,788,138 | 437,746 |
| Events in quadrant D | 3,168,002 | 400,009 |
| Mode M0 | |||
|---|---|---|---|
| Quadrant | BADHDUFLAG | Total packets | Discarded packets |
| A | 0 | 13847 | 2 |
| B | 0 | 14290 | 1 |
| C | 0 | 11940 | 1 |
| D | 0 | 13277 | 1 |
| Mode SS | |||
|---|---|---|---|
| Quadrant | BADHDUFLAG | Total packets | Discarded packets |
| A | 0 | 116 | 0 |
| B | 0 | 116 | 0 |
| C | 0 | 116 | 0 |
| D | 0 | 116 | 0 |
| Mode M9 | |||
|---|---|---|---|
| Quadrant | BADHDUFLAG | Total packets | Discarded packets |
| A | 0 | 13 | 0 |
| B | 0 | 13 | 0 |
| C | 0 | 13 | 0 |
| D | 0 | 13 | 0 |
| Quadrant | Total seconds | Saturated seconds | Saturation percentage |
|---|---|---|---|
| A | 5692 | 37 | 0.650035% |
| B | 5692 | 283 | 4.971890% |
| C | 5692 | 14 | 0.245959% |
| D | 5692 | 55 | 0.966268% |
Noise dominated data is calculated using 1-second bins in cleaned event files. If a bin has >2000 counts, and if more than 50% of those come from <1% of pixels, then it is considered to be noise-dominated and hence unusable.
| Quadrant | # 1 sec bins | Bins with >0 counts | Bins with >2000 counts | High rate bins dominated by noise | Noise dominated (total time) | Noise dominated (detector-on time) | Marked lightcurve |
|---|---|---|---|---|---|---|---|
| A | 7005 | 5693 | 16 | 16 | 0.23% | 0.28% | 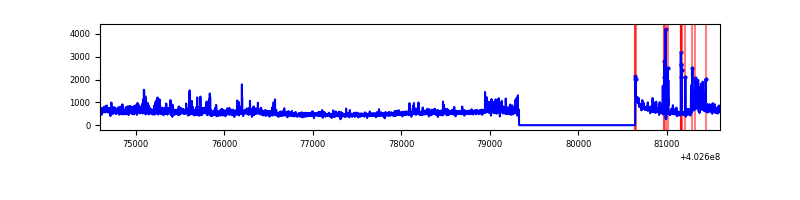 |
| B | 7005 | 5693 | 240 | 240 | 3.43% | 4.22% | 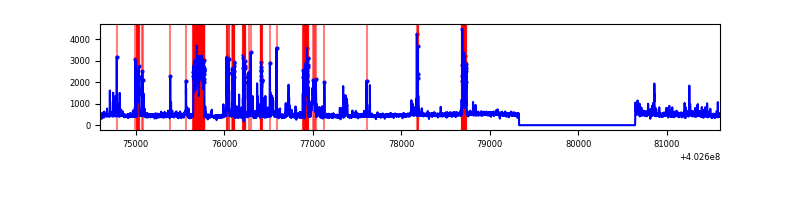 |
| C | 7005 | 5693 | 7 | 7 | 0.10% | 0.12% | 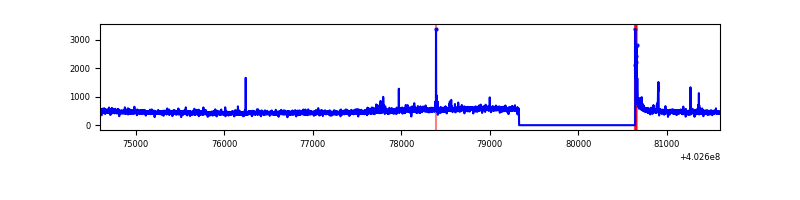 |
| D | 7005 | 5693 | 47 | 47 | 0.67% | 0.83% | 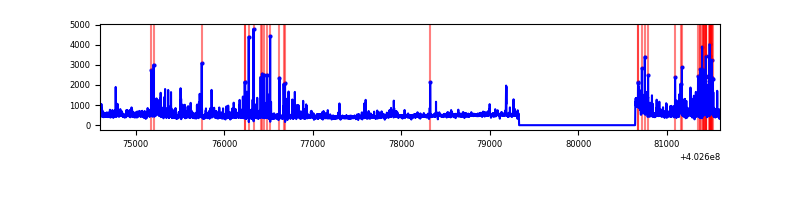 |
Top three noisy pixels from each quadrant. If the there are fewer than three noisy pixels in the level2.evt file, extra rows are filled as -1
| Pixel properties | Quadrant properties | ||||||
|---|---|---|---|---|---|---|---|
| Quadrant | DetID | PixID | Counts | Sigma | Mean | Median | Sigma |
| A | 15 | 222 | 462356 | 3603.47 | 634 | 624 | 128.1 |
| A | 10 | 83 | 349994 | 2726.57 | 634 | 624 | 128.1 |
| A | 15 | 235 | 62011 | 479.08 | 634 | 624 | 128.1 |
| B | 5 | 184 | 560699 | 4666.31 | 625 | 608 | 120.0 |
| B | 5 | 172 | 444511 | 3698.31 | 625 | 608 | 120.0 |
| B | 0 | 197 | 20076 | 162.19 | 625 | 608 | 120.0 |
| C | 15 | 214 | 239690 | 1665.49 | 619 | 623 | 143.5 |
| C | 0 | 10 | 80397 | 555.75 | 619 | 623 | 143.5 |
| C | 14 | 254 | 31605 | 215.84 | 619 | 623 | 143.5 |
| D | 1 | 52 | 284373 | 1876.25 | 615 | 598 | 151.2 |
| D | 12 | 233 | 196775 | 1297.07 | 615 | 598 | 151.2 |
| D | 2 | 249 | 113643 | 747.43 | 615 | 598 | 151.2 |
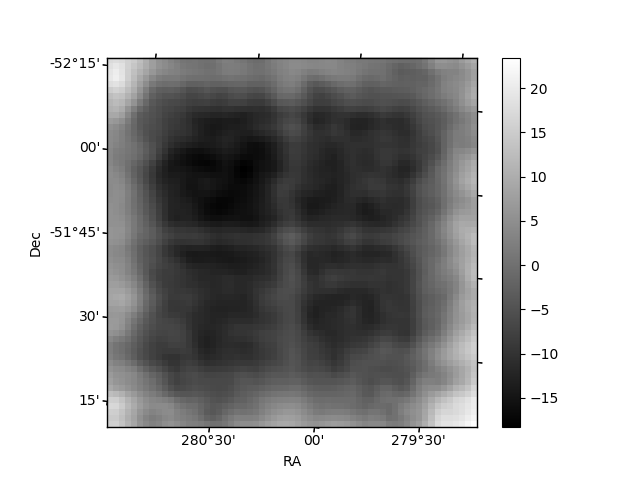
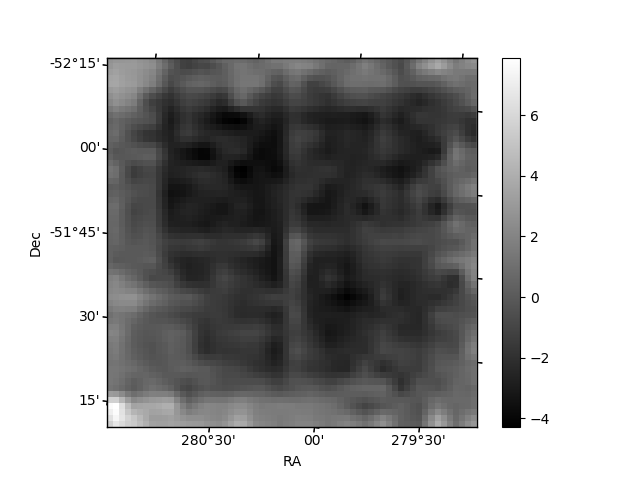
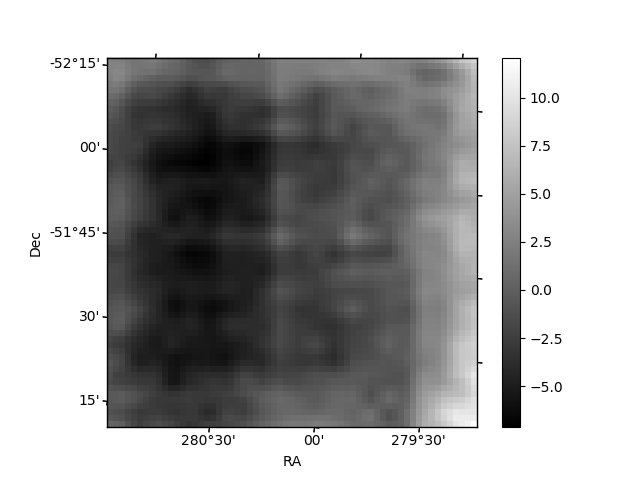
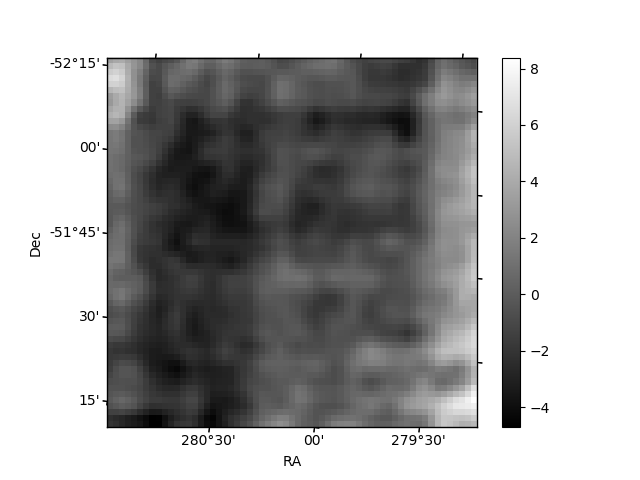
Histogram calculated using DETX and DETY for each event in the final _common_clean file
| Quadrant A | 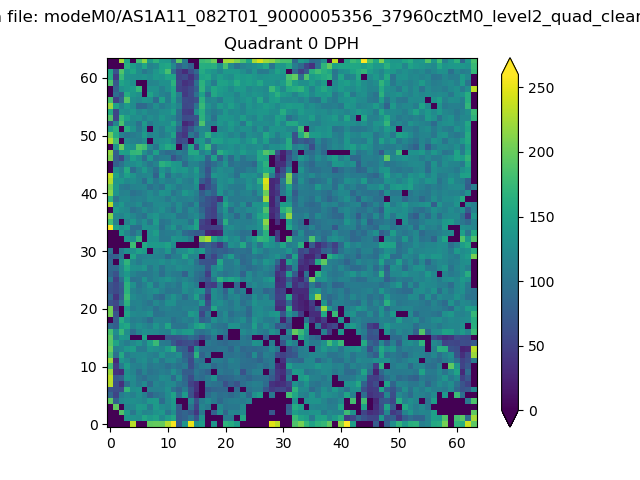 |
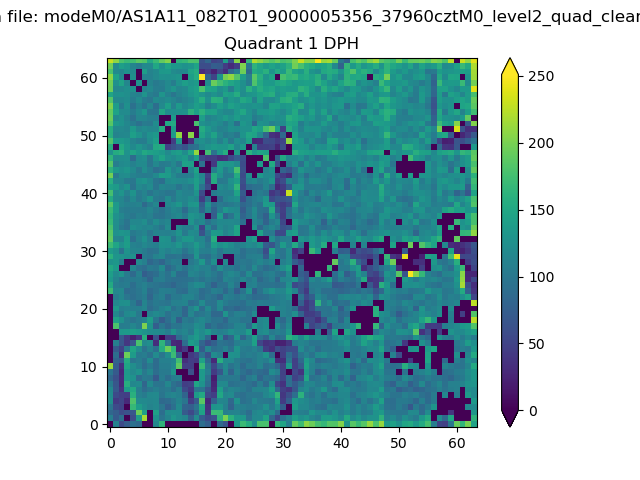 |
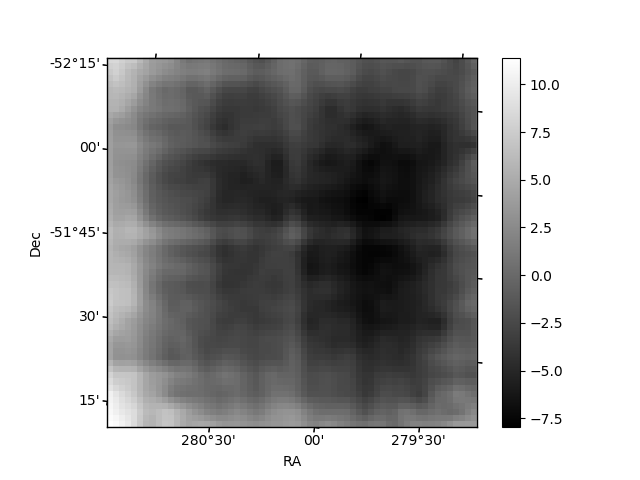
Quadrant B |
|---|---|---|---|
| Quadrant D | 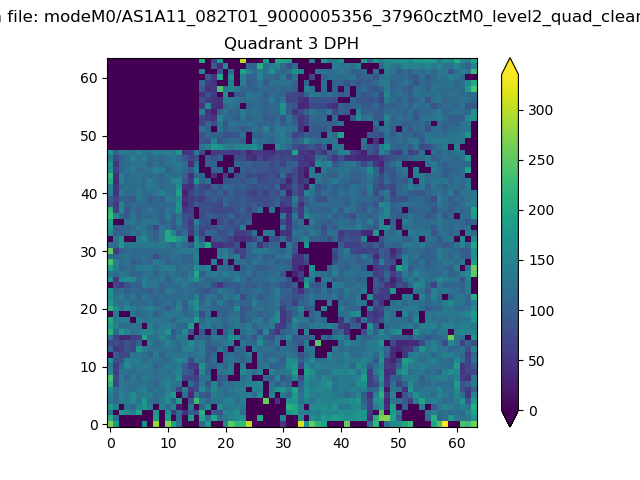 |
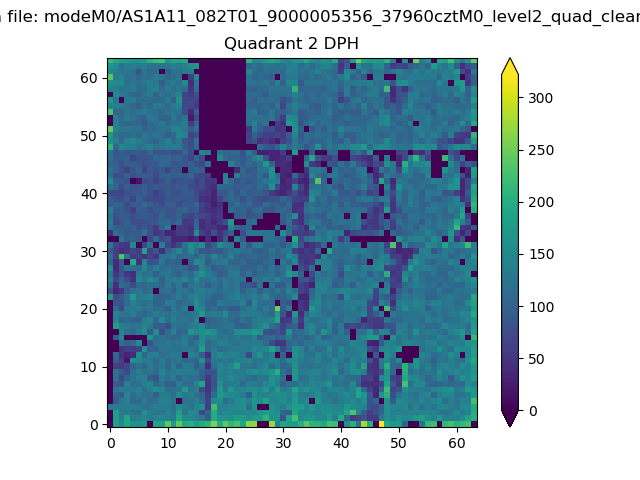 |
Quadrant C |
| Plot type | Count rate plots | Images |
|---|---|---|
| Comparison with Poisson distribution Blue bars denote a histogram of data divided into 1 sec bins. Red curve is a Poisson curve with rate = median count rate of data. |
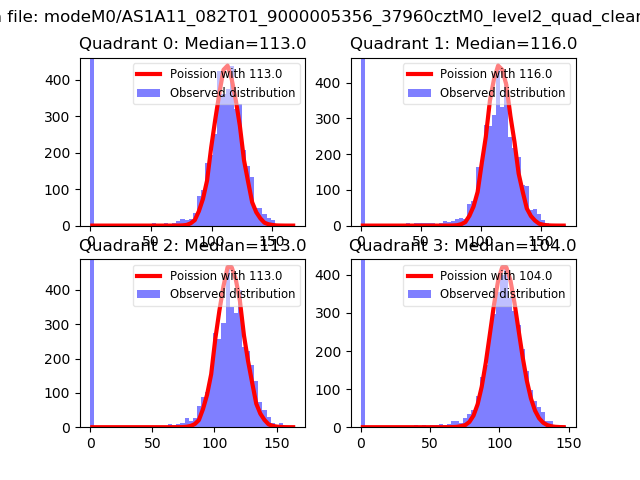 |
 |
| Quadrant-wise count rates Data is divided into 100 sec bins |
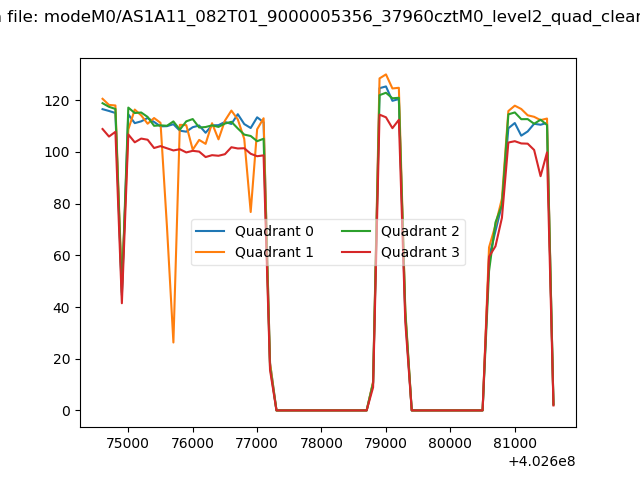 |
|
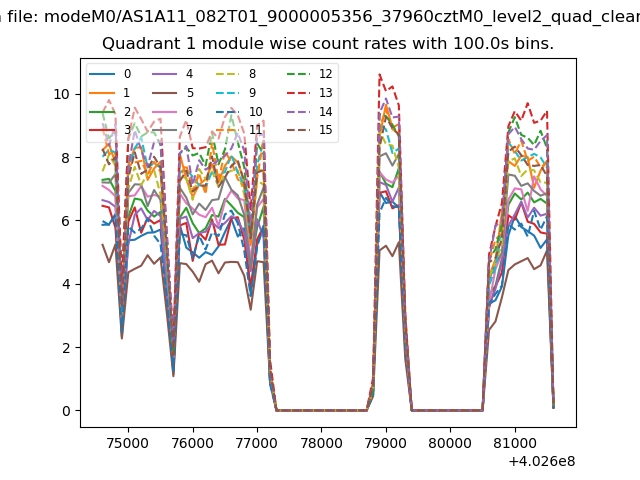
| Module-wise count rates for Quadrant A Data is divided into 100 sec bins |
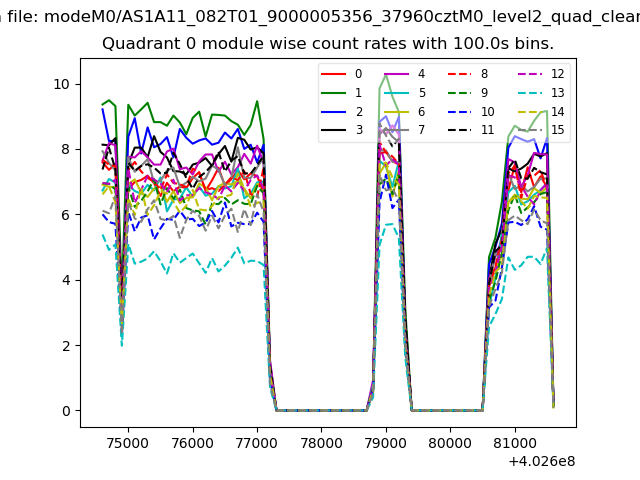 |
 |
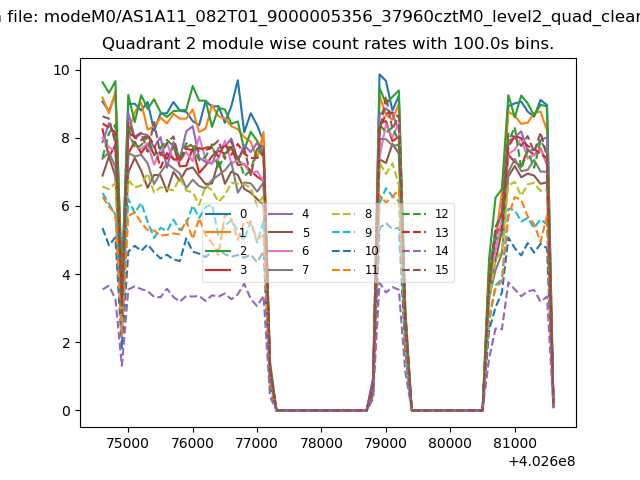
| Module-wise count rates for Quadrant B Data is divided into 100 sec bins |
 |
 |
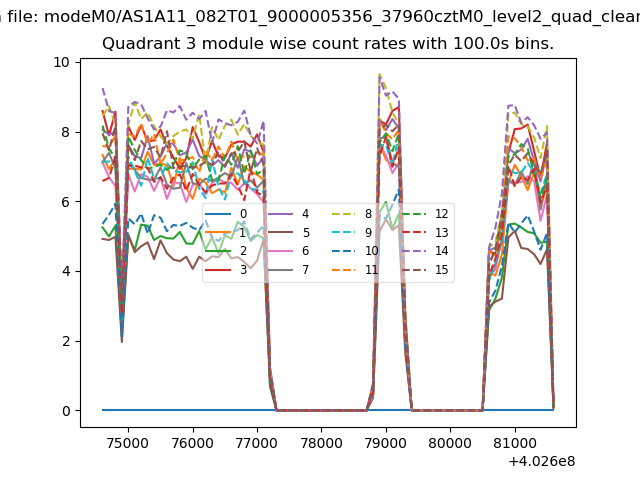
| Module-wise count rates for Quadrant C Data is divided into 100 sec bins |
 |
 |
| Module-wise count rates for Quadrant D Data is divided into 100 sec bins |
 |
 |
| Parameter | Plot |
|---|---|
| CZT HV Monitor |  |
| D_VDD |  |
| Temperature 1 | 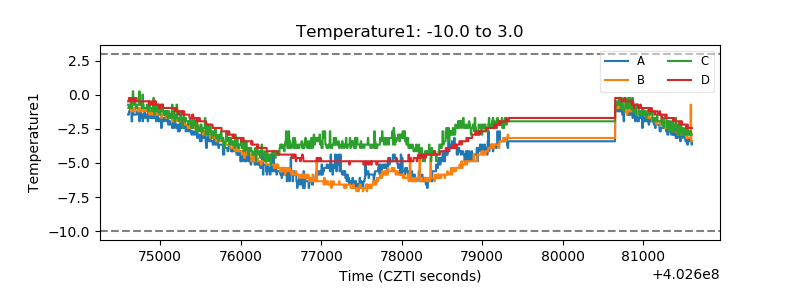 |
| Veto HV Monitor | 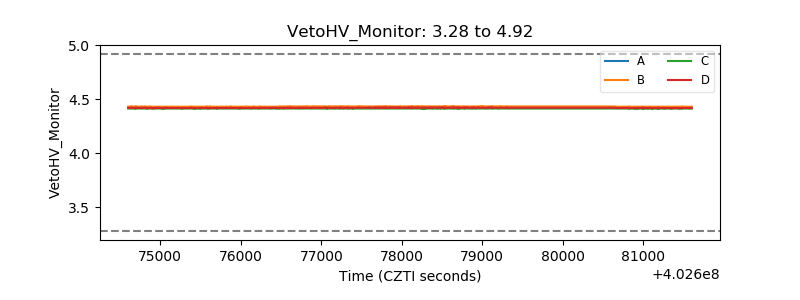 |
| Veto LLD | 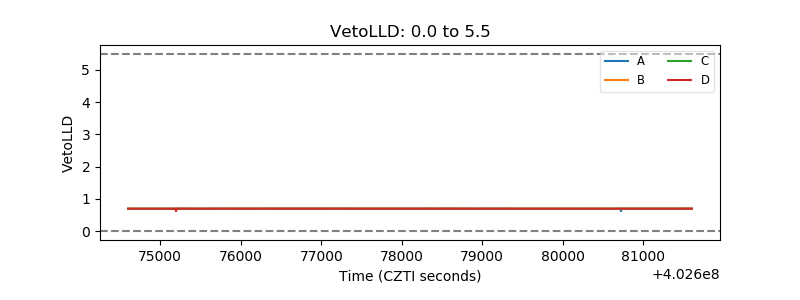 |
| Alpha Counter | 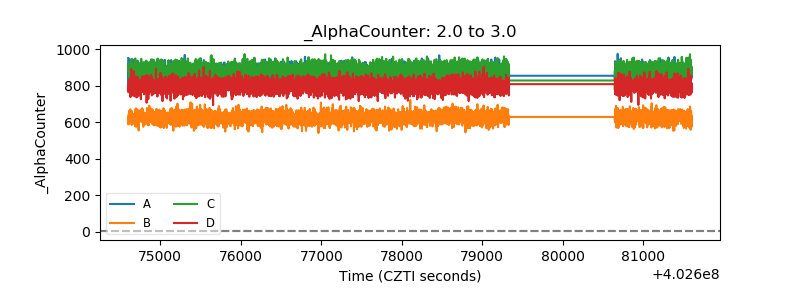 |
| _CPM_Rate | 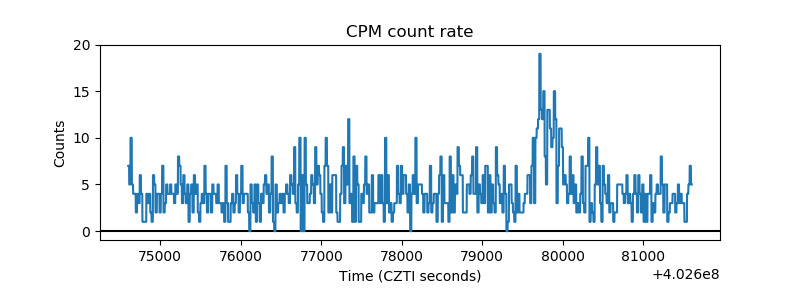 |
| CZT Counter | 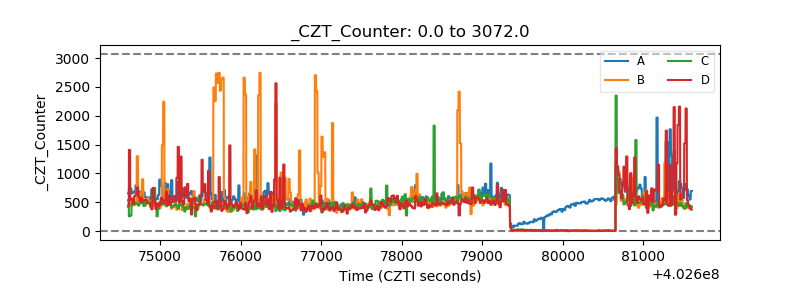 |
| +2.5 Volts monitor | 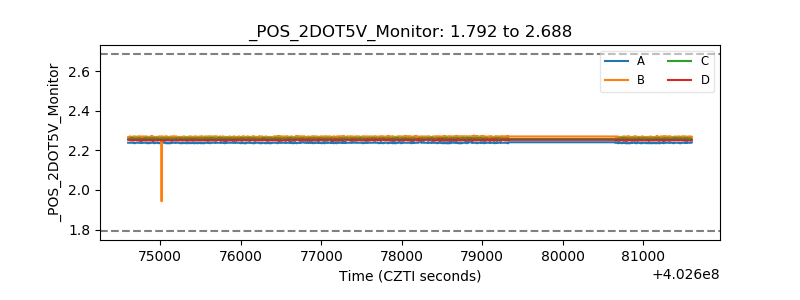 |
| +5 Volts monitor | 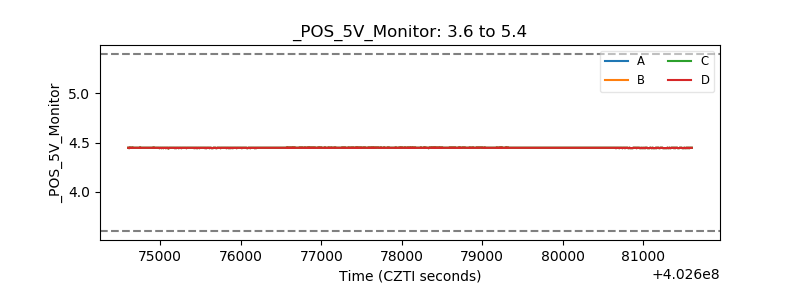 |
| _ROLL_ROT | 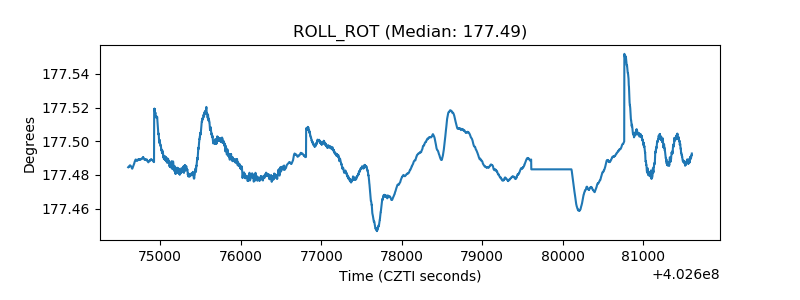 |
| _Roll_DEC | 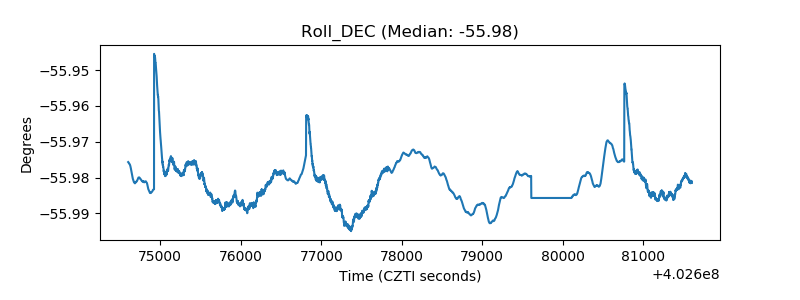 |
| _Roll_RA | 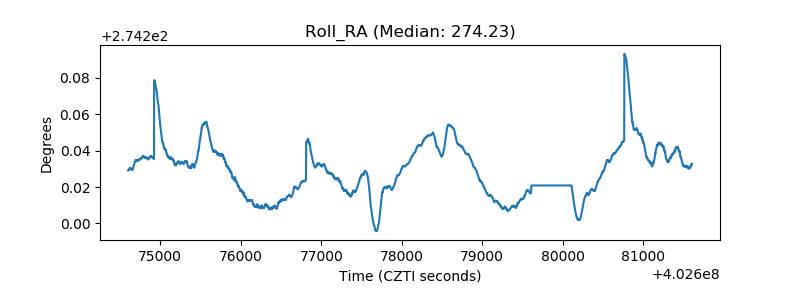 |
| Veto Counter | 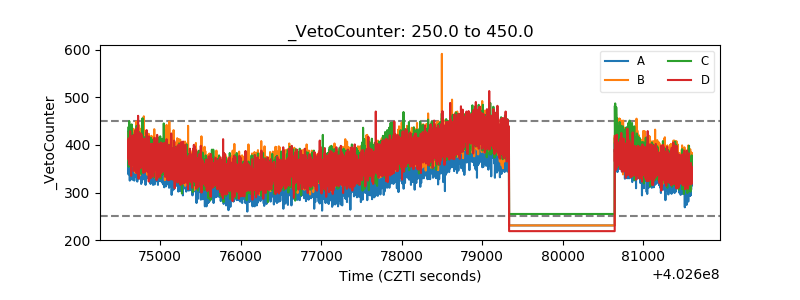 |