| Param | Original file | Final file |
|---|---|---|
| Filename | modeM0/AS1A11_082T01_9000005356_37961cztM0_level2.evt | modeM0/AS1A11_082T01_9000005356_37961cztM0_level2_quad_clean.evt |
| Size (bytes) | 479,376,000 | 73,684,800 |
| Size | 457.2 MB | 70.3 MB |
| Events in quadrant A | 3,916,641 | 462,574 |
| Events in quadrant B | 3,344,280 | 470,170 |
| Events in quadrant C | 2,985,642 | 465,770 |
| Events in quadrant D | 3,869,470 | 418,442 |
| Mode M0 | |||
|---|---|---|---|
| Quadrant | BADHDUFLAG | Total packets | Discarded packets |
| A | 0 | 15403 | 3 |
| B | 0 | 13943 | 2 |
| C | 0 | 12604 | 2 |
| D | 0 | 15606 | 2 |
| Mode SS | |||
|---|---|---|---|
| Quadrant | BADHDUFLAG | Total packets | Discarded packets |
| A | 0 | 122 | 0 |
| B | 0 | 122 | 0 |
| C | 0 | 122 | 0 |
| D | 0 | 122 | 0 |
| Mode M9 | |||
|---|---|---|---|
| Quadrant | BADHDUFLAG | Total packets | Discarded packets |
| A | 0 | 17 | 0 |
| B | 0 | 17 | 0 |
| C | 0 | 17 | 0 |
| D | 0 | 18 | 0 |
| Quadrant | Total seconds | Saturated seconds | Saturation percentage |
|---|---|---|---|
| A | 5919 | 94 | 1.588106% |
| B | 5919 | 159 | 2.686265% |
| C | 5919 | 47 | 0.794053% |
| D | 5919 | 203 | 3.429633% |
Noise dominated data is calculated using 1-second bins in cleaned event files. If a bin has >2000 counts, and if more than 50% of those come from <1% of pixels, then it is considered to be noise-dominated and hence unusable.
| Quadrant | # 1 sec bins | Bins with >0 counts | Bins with >2000 counts | High rate bins dominated by noise | Noise dominated (total time) | Noise dominated (detector-on time) | Marked lightcurve |
|---|---|---|---|---|---|---|---|
| A | 7202 | 5920 | 59 | 59 | 0.82% | 1.00% | 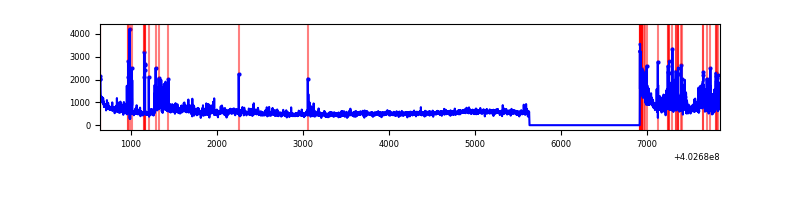 |
| B | 7202 | 5920 | 103 | 103 | 1.43% | 1.74% | 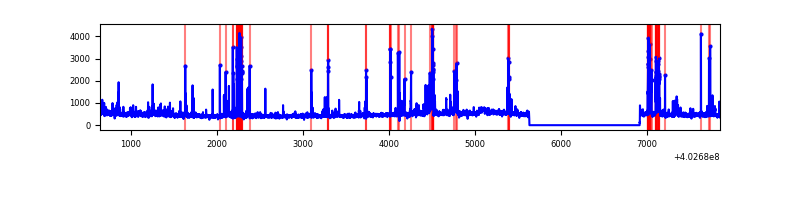 |
| C | 7202 | 5920 | 35 | 35 | 0.49% | 0.59% | 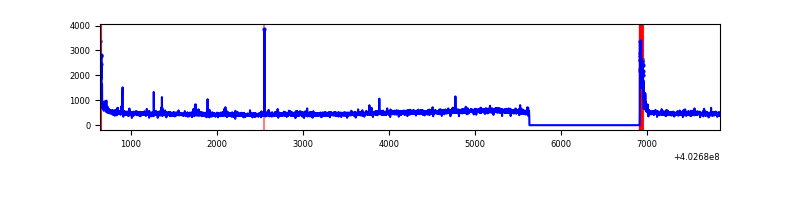 |
| D | 7202 | 5920 | 196 | 196 | 2.72% | 3.31% | 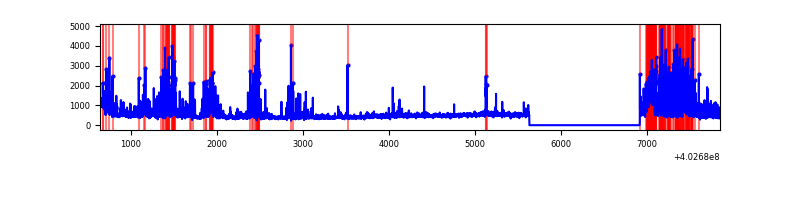 |
Top three noisy pixels from each quadrant. If the there are fewer than three noisy pixels in the level2.evt file, extra rows are filled as -1
| Pixel properties | Quadrant properties | ||||||
|---|---|---|---|---|---|---|---|
| Quadrant | DetID | PixID | Counts | Sigma | Mean | Median | Sigma |
| A | 15 | 222 | 706589 | 5250.08 | 661 | 650 | 134.5 |
| A | 10 | 83 | 416054 | 3089.37 | 661 | 650 | 134.5 |
| A | 13 | 248 | 125248 | 926.64 | 661 | 650 | 134.5 |
| B | 5 | 172 | 522497 | 4147.86 | 657 | 640 | 125.8 |
| B | 5 | 184 | 77275 | 609.12 | 657 | 640 | 125.8 |
| B | 4 | 81 | 34466 | 268.86 | 657 | 640 | 125.8 |
| C | 15 | 214 | 250229 | 1658.21 | 646 | 652 | 150.5 |
| C | 0 | 10 | 162942 | 1078.27 | 646 | 652 | 150.5 |
| C | 14 | 254 | 22254 | 143.53 | 646 | 652 | 150.5 |
| D | 2 | 249 | 638669 | 4064.21 | 637 | 619 | 157.0 |
| D | 1 | 52 | 223833 | 1421.81 | 637 | 619 | 157.0 |
| D | 12 | 233 | 198997 | 1263.61 | 637 | 619 | 157.0 |
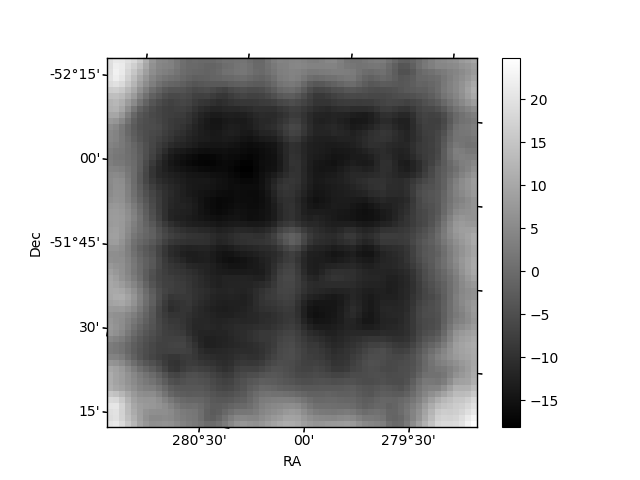
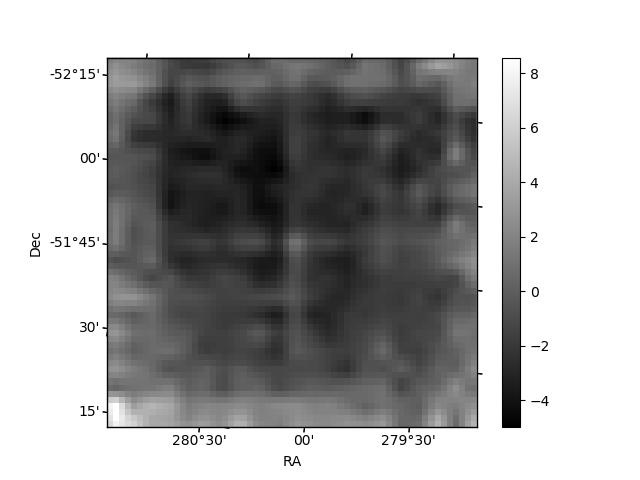
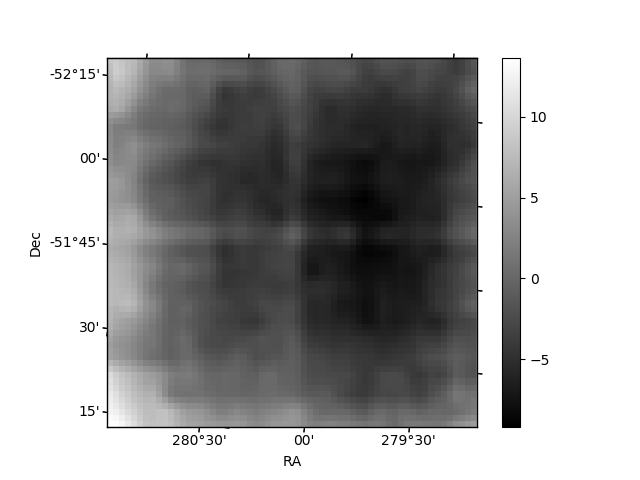
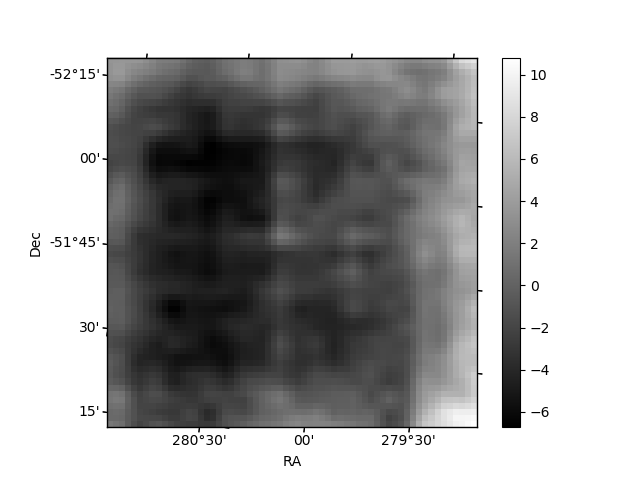
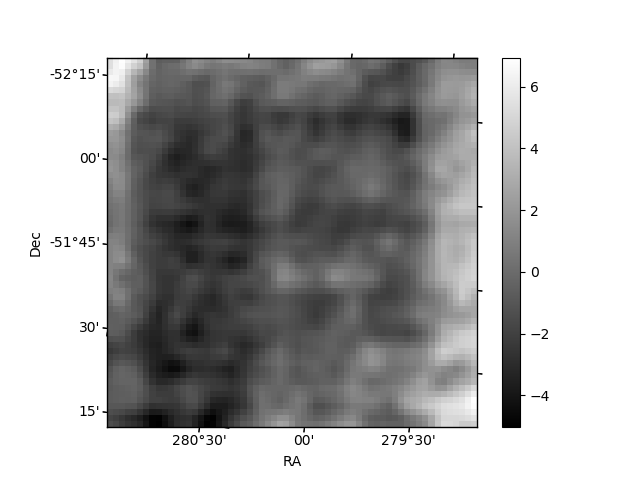
Histogram calculated using DETX and DETY for each event in the final _common_clean file
| Quadrant A | 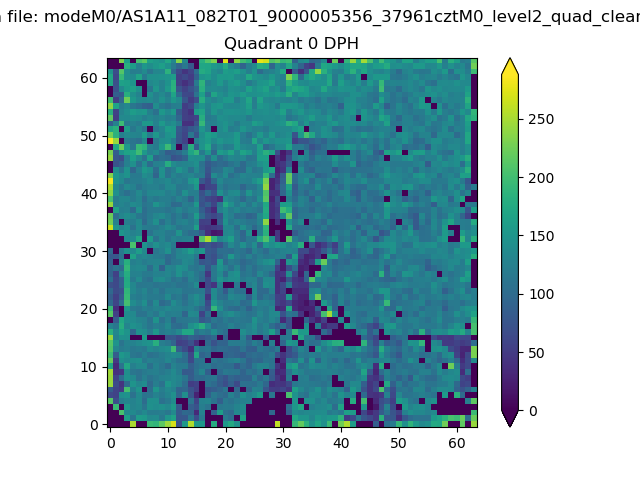 |
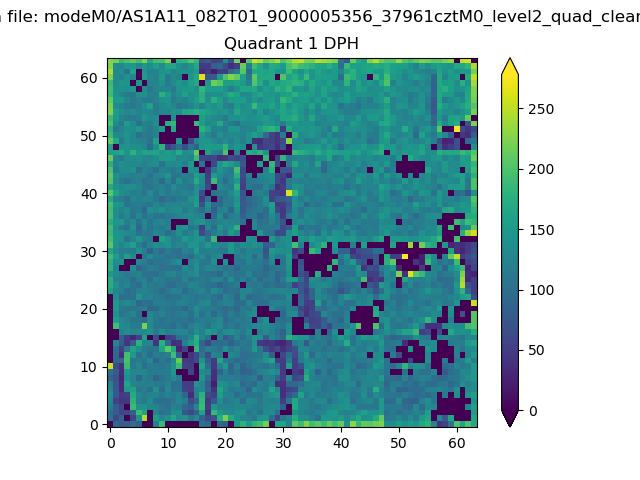 |
Quadrant B |
|---|---|---|---|
| Quadrant D | 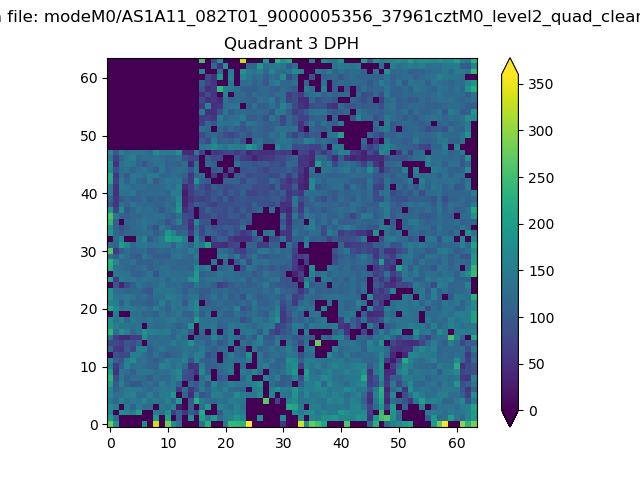 |
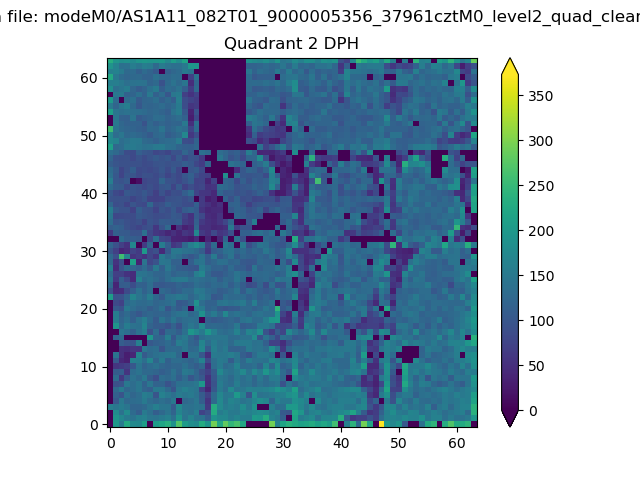 |
Quadrant C |
| Plot type | Count rate plots | Images |
|---|---|---|
| Comparison with Poisson distribution Blue bars denote a histogram of data divided into 1 sec bins. Red curve is a Poisson curve with rate = median count rate of data. |
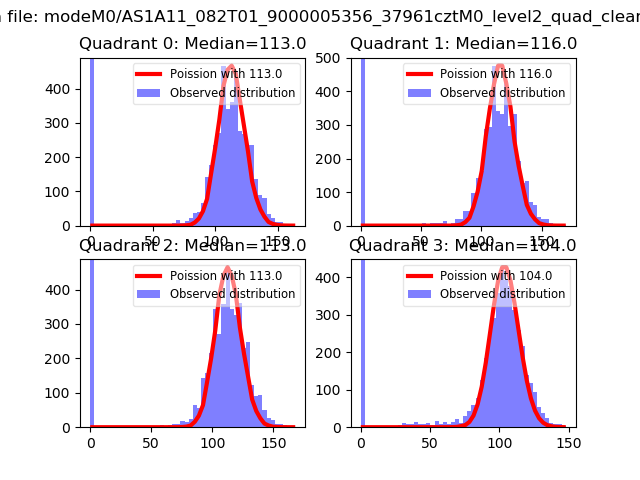 |
 |
| Quadrant-wise count rates Data is divided into 100 sec bins |
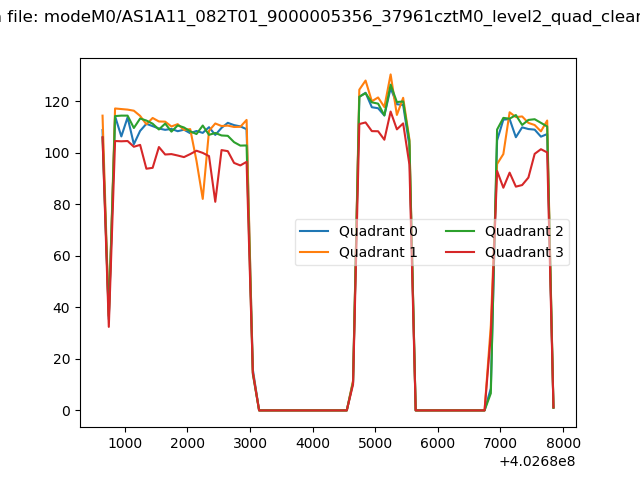 |
|
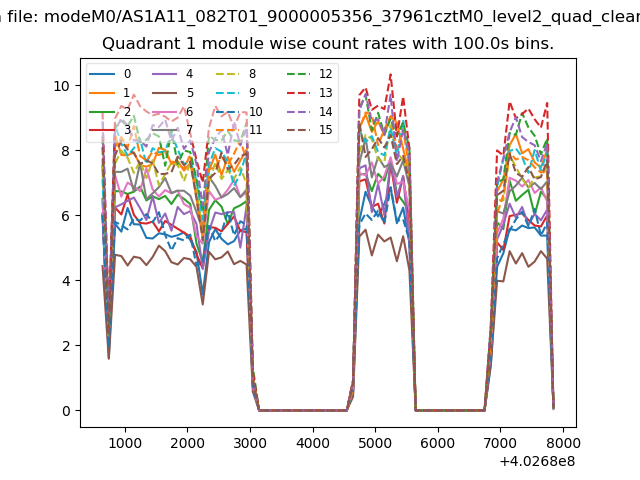
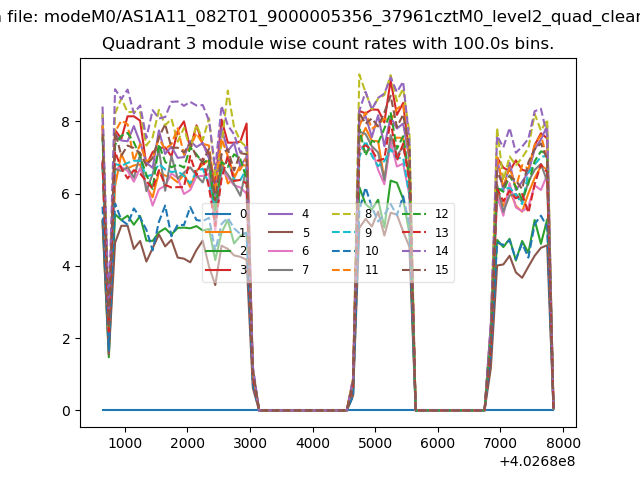
| Module-wise count rates for Quadrant A Data is divided into 100 sec bins |
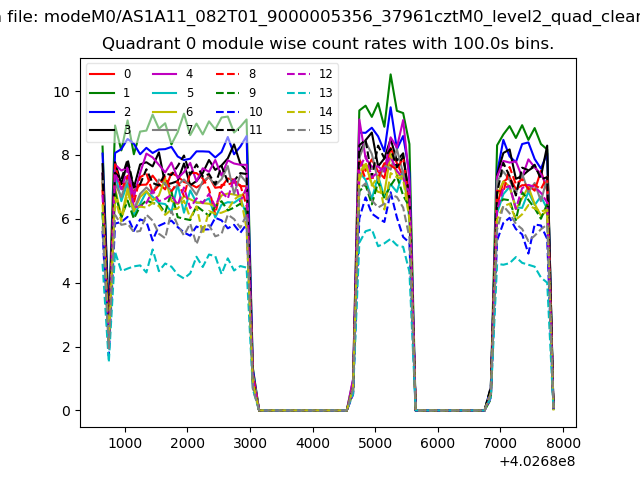 |
 |
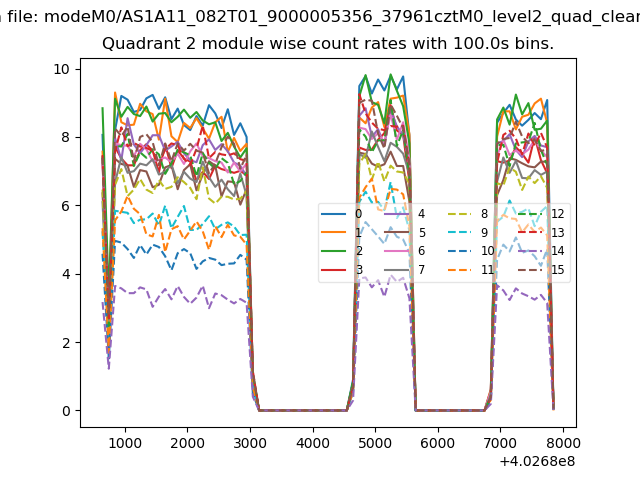
| Module-wise count rates for Quadrant B Data is divided into 100 sec bins |
 |
 |
| Module-wise count rates for Quadrant C Data is divided into 100 sec bins |
 |
 |
| Module-wise count rates for Quadrant D Data is divided into 100 sec bins |
 |
 |
| Parameter | Plot |
|---|---|
| CZT HV Monitor | 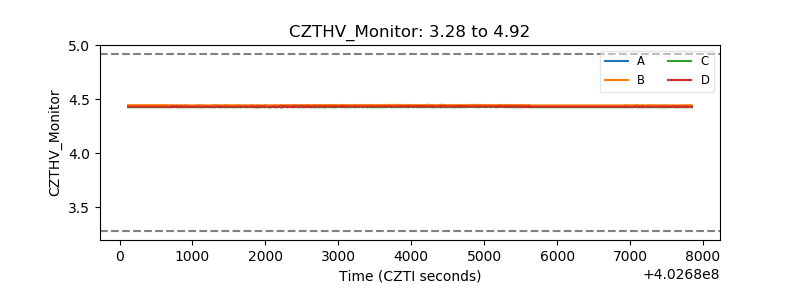 |
| D_VDD | 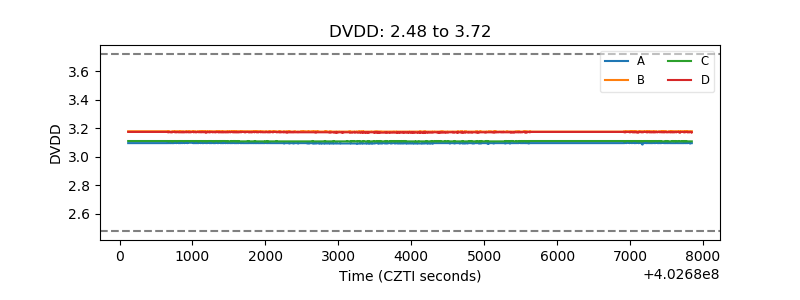 |
| Temperature 1 | 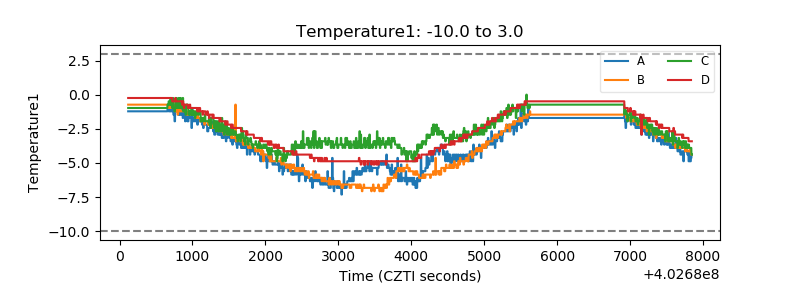 |
| Veto HV Monitor | 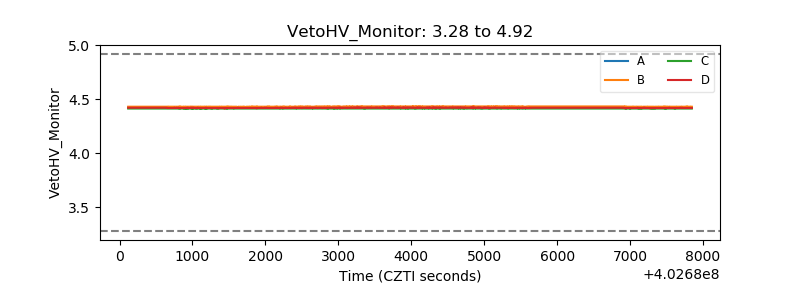 |
| Veto LLD | 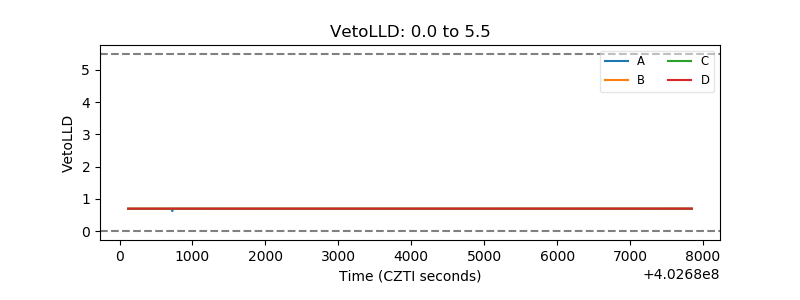 |
| Alpha Counter | 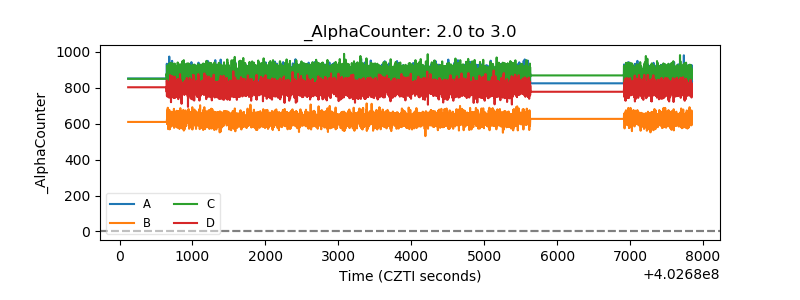 |
| _CPM_Rate | 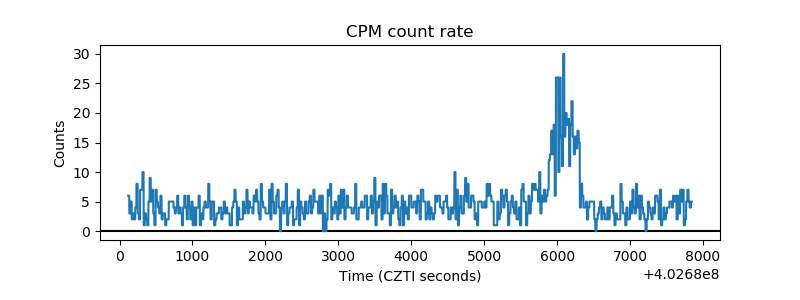 |
| CZT Counter | 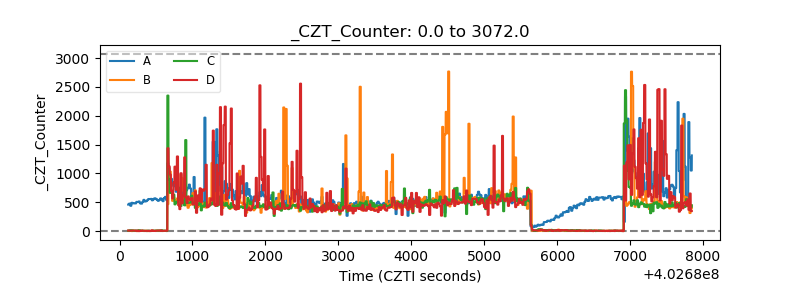 |
| +2.5 Volts monitor | 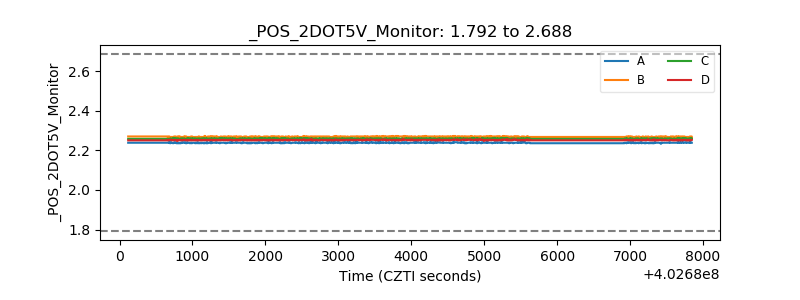 |
| +5 Volts monitor | 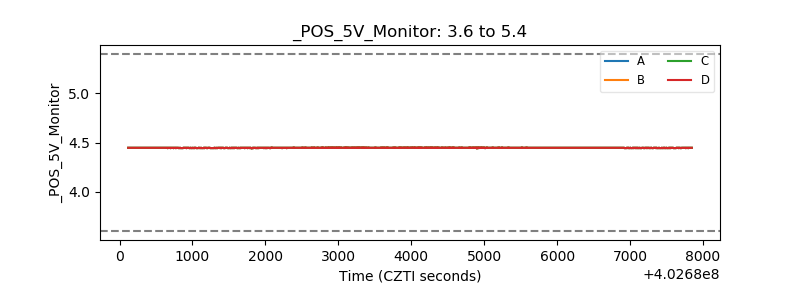 |
| _ROLL_ROT | 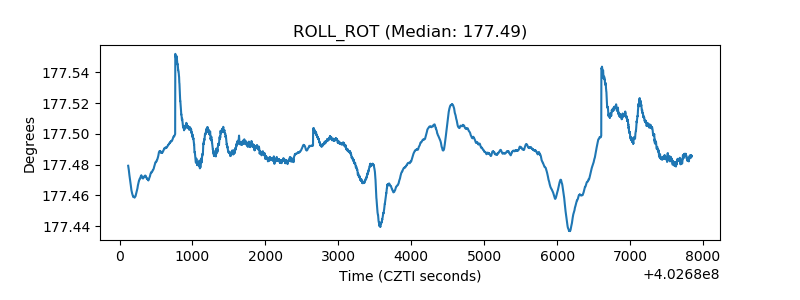 |
| _Roll_DEC | 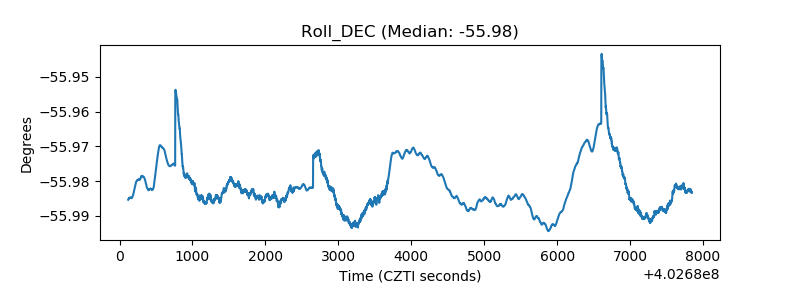 |
| _Roll_RA | 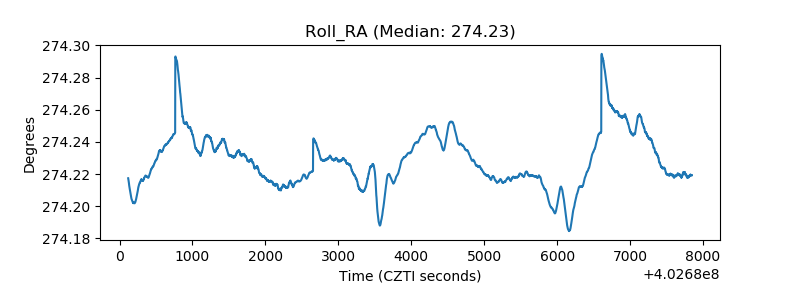 |
| Veto Counter | 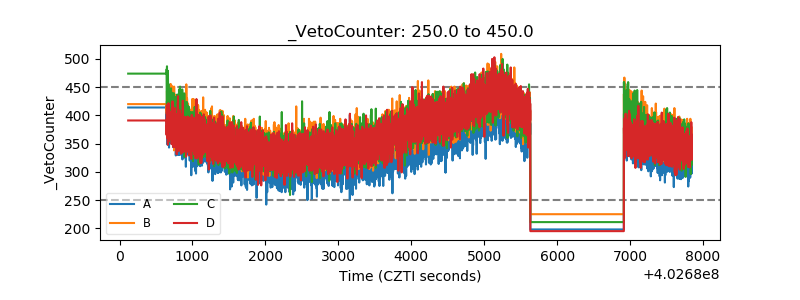 |