| Param | Original file | Final file |
|---|---|---|
| Filename | modeM0/AS1A11_082T01_9000005356_37963cztM0_level2.evt | modeM0/AS1A11_082T01_9000005356_37963cztM0_level2_quad_clean.evt |
| Size (bytes) | 869,840,640 | 133,727,040 |
| Size | 829.5 MB | 127.5 MB |
| Events in quadrant A | 8,124,544 | 839,887 |
| Events in quadrant B | 5,819,719 | 854,654 |
| Events in quadrant C | 5,517,075 | 841,533 |
| Events in quadrant D | 6,150,987 | 763,635 |
| Mode M0 | |||
|---|---|---|---|
| Quadrant | BADHDUFLAG | Total packets | Discarded packets |
| A | 0 | 31783 | 4 |
| B | 0 | 24421 | 3 |
| C | 0 | 23075 | 3 |
| D | 0 | 25940 | 3 |
| Mode SS | |||
|---|---|---|---|
| Quadrant | BADHDUFLAG | Total packets | Discarded packets |
| A | 0 | 222 | 0 |
| B | 0 | 222 | 0 |
| C | 0 | 222 | 0 |
| D | 0 | 222 | 0 |
| Mode M9 | |||
|---|---|---|---|
| Quadrant | BADHDUFLAG | Total packets | Discarded packets |
| A | 0 | 29 | 0 |
| B | 0 | 29 | 0 |
| C | 0 | 29 | 0 |
| D | 0 | 30 | 0 |
| Quadrant | Total seconds | Saturated seconds | Saturation percentage |
|---|---|---|---|
| A | 10811 | 140 | 1.294977% |
| B | 10811 | 191 | 1.766719% |
| C | 10811 | 86 | 0.795486% |
| D | 10811 | 235 | 2.173712% |
Noise dominated data is calculated using 1-second bins in cleaned event files. If a bin has >2000 counts, and if more than 50% of those come from <1% of pixels, then it is considered to be noise-dominated and hence unusable.
| Quadrant | # 1 sec bins | Bins with >0 counts | Bins with >2000 counts | High rate bins dominated by noise | Noise dominated (total time) | Noise dominated (detector-on time) | Marked lightcurve |
|---|---|---|---|---|---|---|---|
| A | 13587 | 10813 | 90 | 90 | 0.66% | 0.83% | 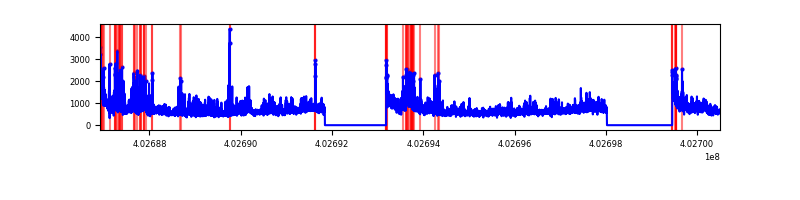 |
| B | 13587 | 10813 | 128 | 128 | 0.94% | 1.18% | 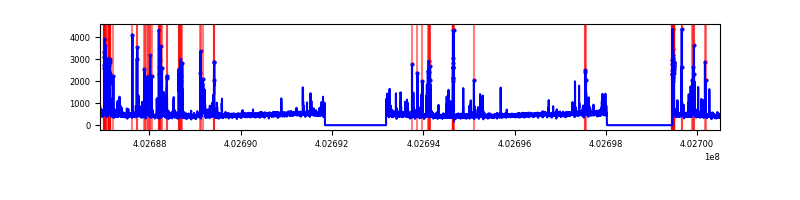 |
| C | 13587 | 10813 | 60 | 60 | 0.44% | 0.55% | 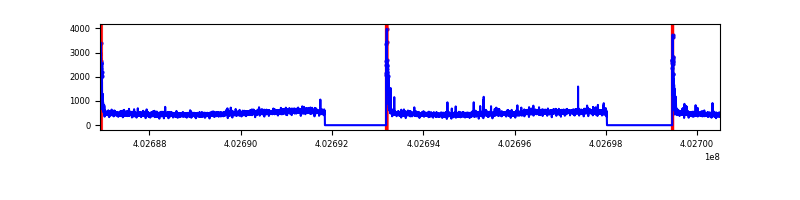 |
| D | 13587 | 10813 | 202 | 202 | 1.49% | 1.87% | 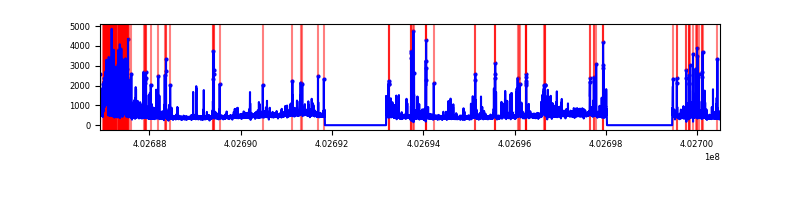 |
Top three noisy pixels from each quadrant. If the there are fewer than three noisy pixels in the level2.evt file, extra rows are filled as -1
| Pixel properties | Quadrant properties | ||||||
|---|---|---|---|---|---|---|---|
| Quadrant | DetID | PixID | Counts | Sigma | Mean | Median | Sigma |
| A | 15 | 222 | 2449627 | 10031.92 | 1207 | 1183 | 244.1 |
| A | 10 | 83 | 669399 | 2737.86 | 1207 | 1183 | 244.1 |
| A | 15 | 254 | 100296 | 406.09 | 1207 | 1183 | 244.1 |
| B | 5 | 172 | 447536 | 1952.99 | 1209 | 1179 | 228.6 |
| B | 5 | 184 | 300297 | 1308.76 | 1209 | 1179 | 228.6 |
| B | 4 | 81 | 156131 | 677.98 | 1209 | 1179 | 228.6 |
| C | 15 | 214 | 452661 | 1645.0 | 1186 | 1194 | 274.4 |
| C | 0 | 10 | 366460 | 1330.91 | 1186 | 1194 | 274.4 |
| C | 14 | 254 | 39484 | 139.52 | 1186 | 1194 | 274.4 |
| D | 2 | 249 | 517922 | 1812.39 | 1174 | 1140 | 285.1 |
| D | 13 | 249 | 475276 | 1662.83 | 1174 | 1140 | 285.1 |
| D | 1 | 52 | 243458 | 849.82 | 1174 | 1140 | 285.1 |
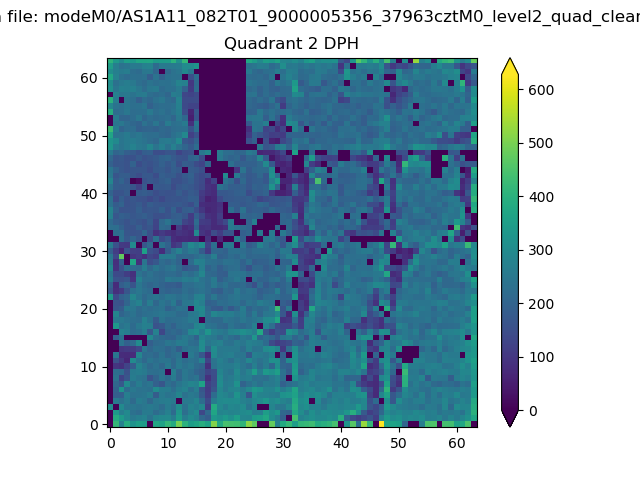
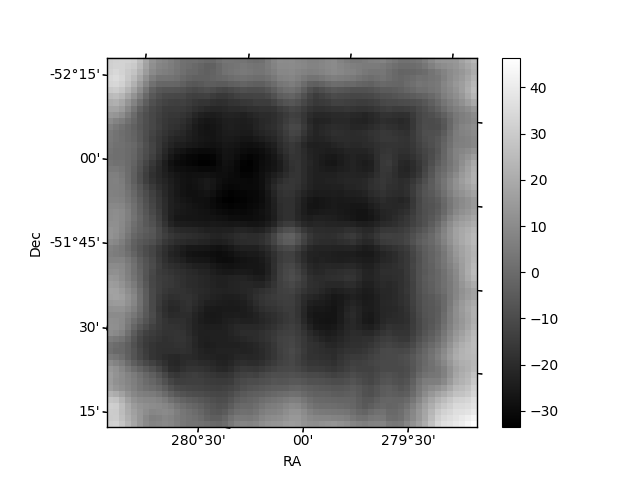
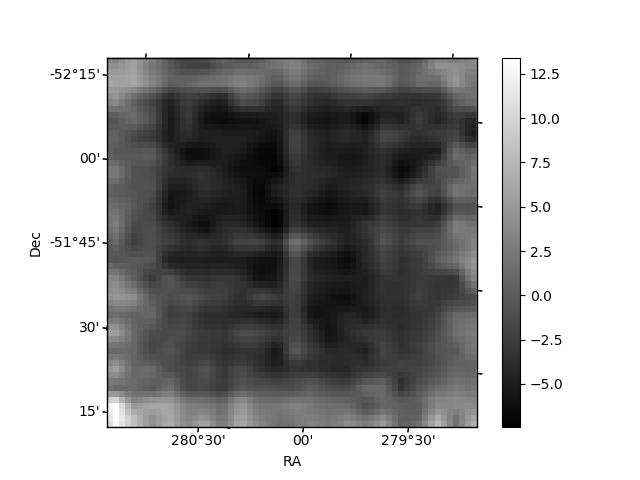
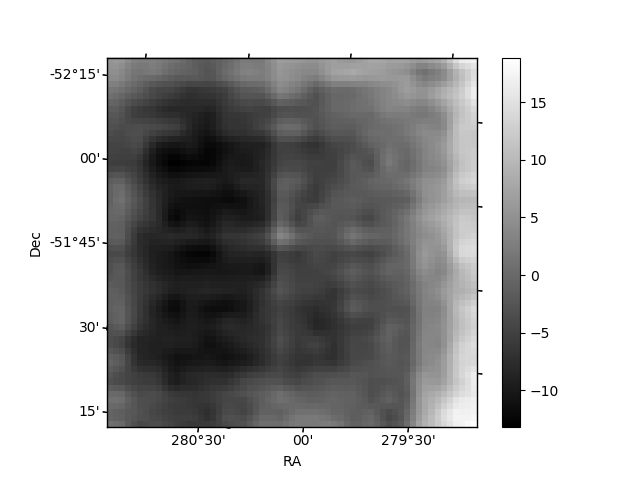
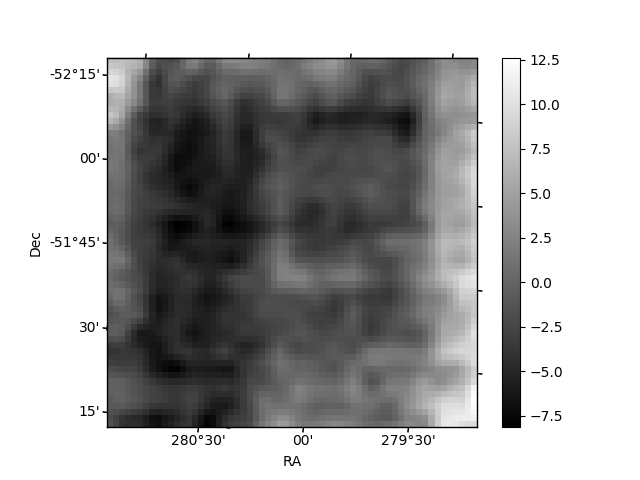
Histogram calculated using DETX and DETY for each event in the final _common_clean file
| Quadrant A | 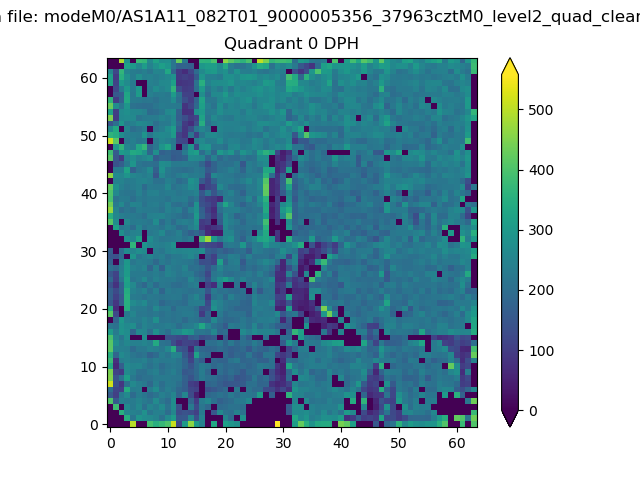 |
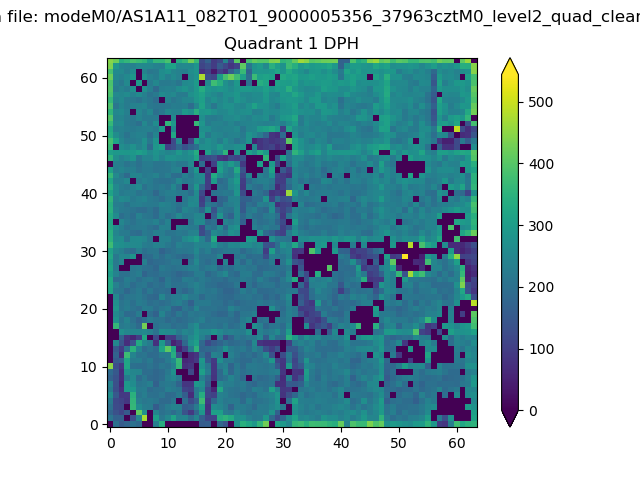 |
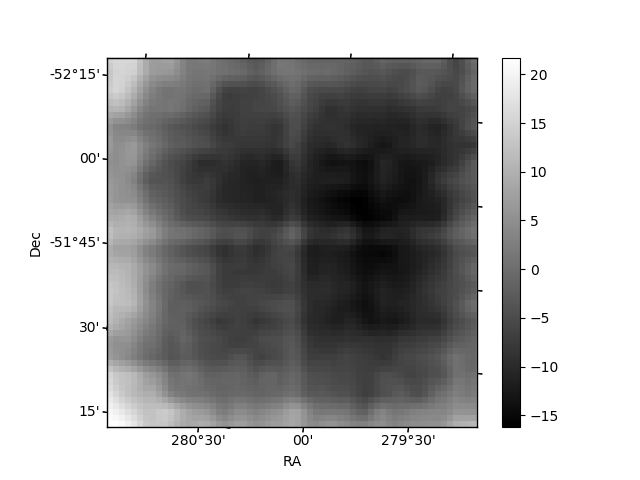
Quadrant B |
|---|---|---|---|
| Quadrant D | 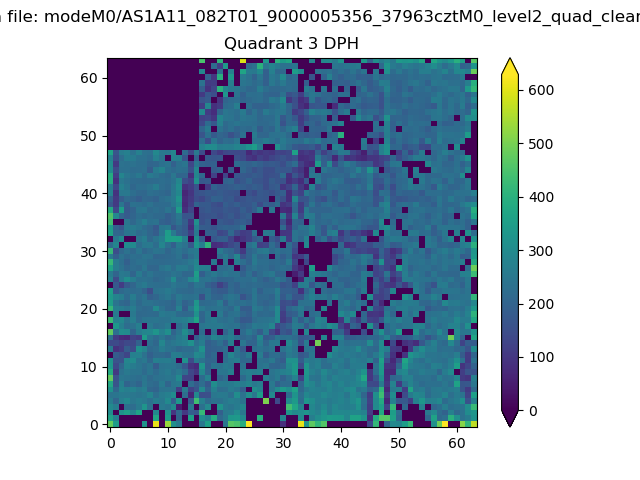 |
 |
Quadrant C |
| Plot type | Count rate plots | Images |
|---|---|---|
| Comparison with Poisson distribution Blue bars denote a histogram of data divided into 1 sec bins. Red curve is a Poisson curve with rate = median count rate of data. |
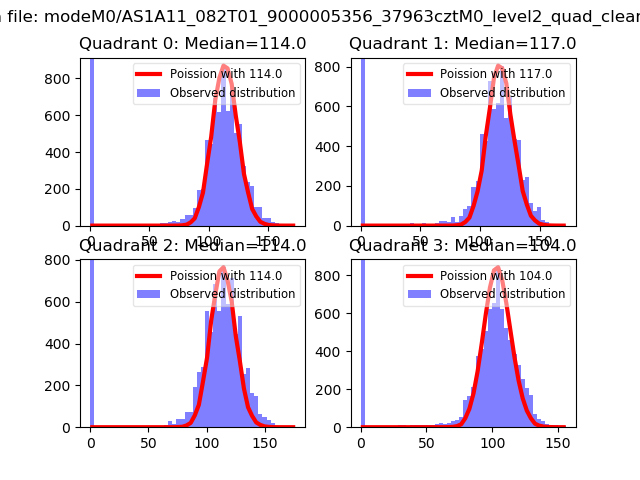 |
 |
| Quadrant-wise count rates Data is divided into 100 sec bins |
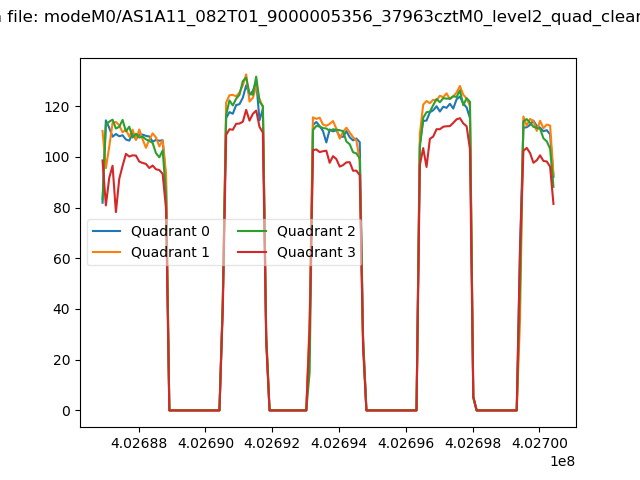 |
|
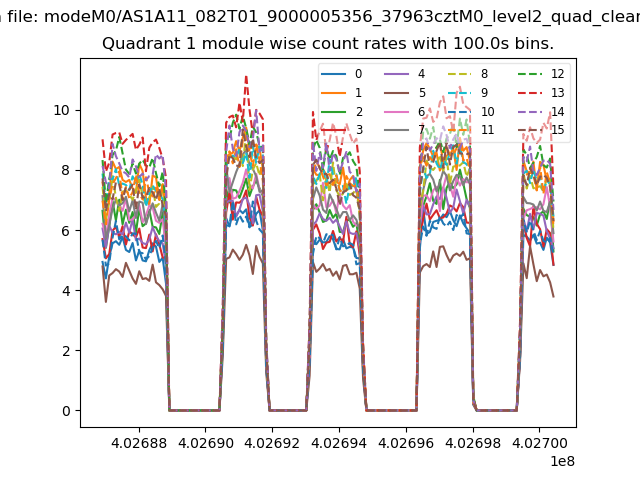
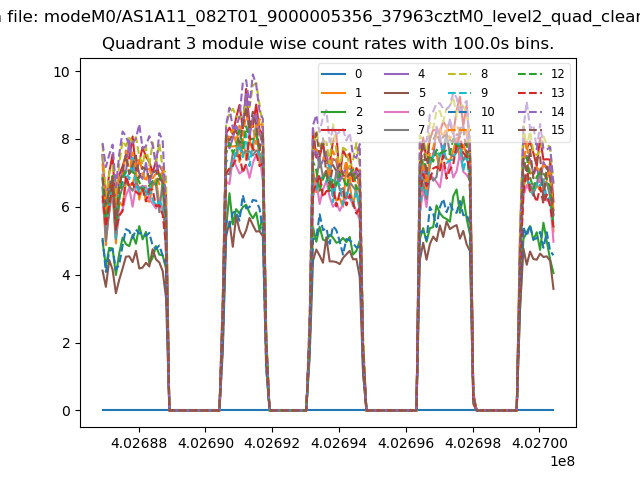
| Module-wise count rates for Quadrant A Data is divided into 100 sec bins |
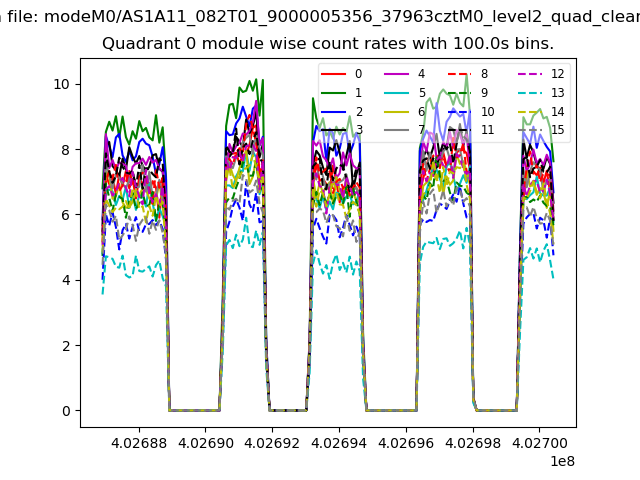 |
 |
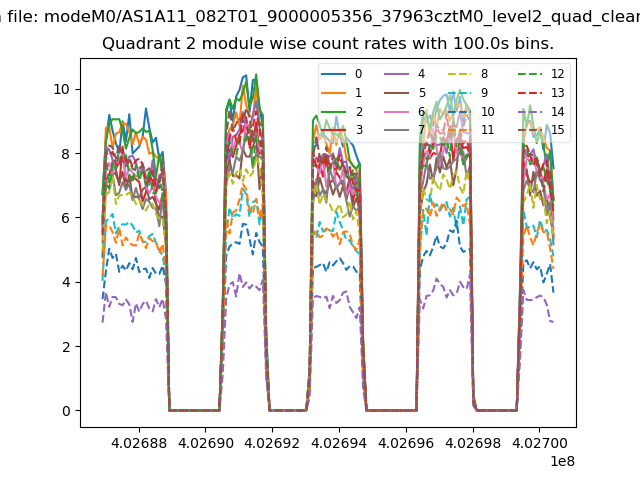
| Module-wise count rates for Quadrant B Data is divided into 100 sec bins |
 |
 |
| Module-wise count rates for Quadrant C Data is divided into 100 sec bins |
 |
 |
| Module-wise count rates for Quadrant D Data is divided into 100 sec bins |
 |
 |
| Parameter | Plot |
|---|---|
| CZT HV Monitor | 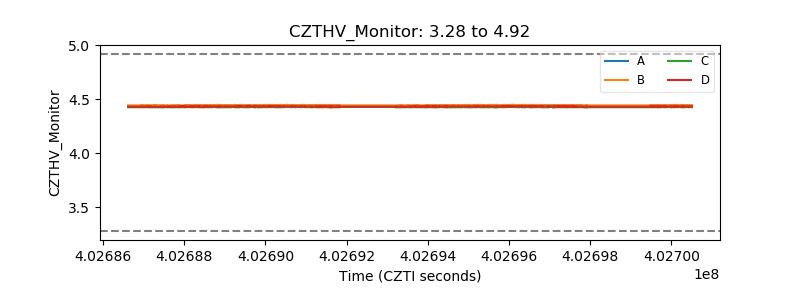 |
| D_VDD | 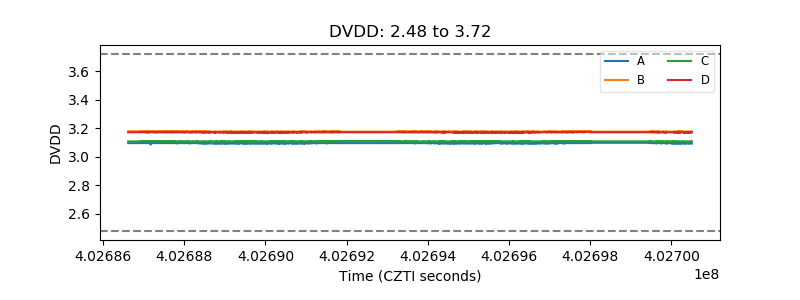 |
| Temperature 1 | 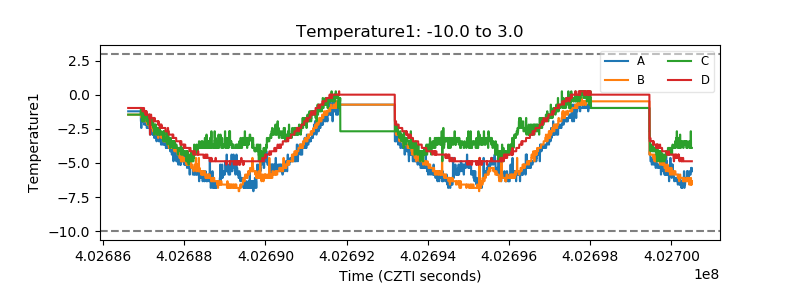 |
| Veto HV Monitor | 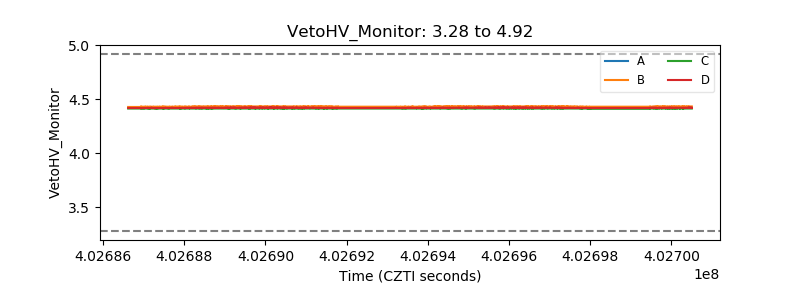 |
| Veto LLD | 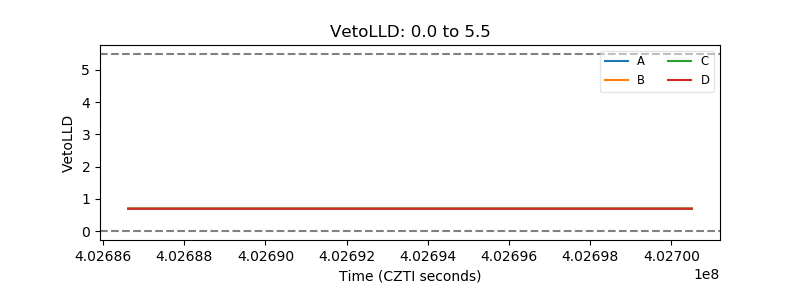 |
| Alpha Counter | 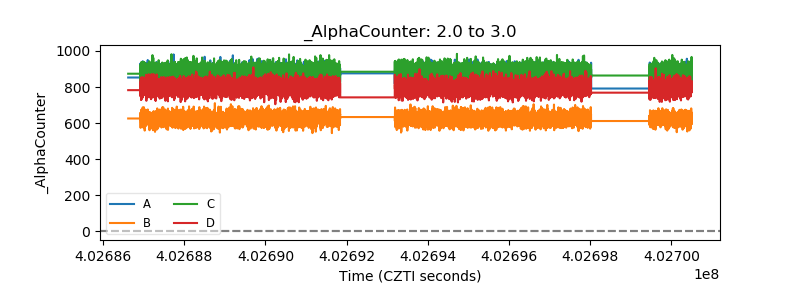 |
| _CPM_Rate | 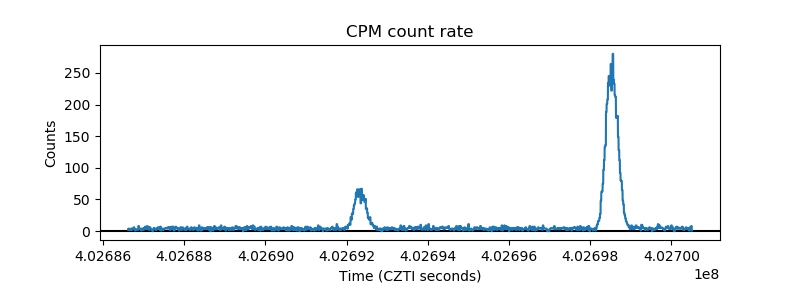 |
| CZT Counter | 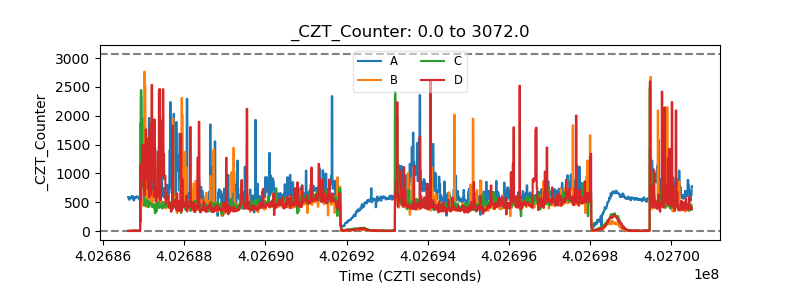 |
| +2.5 Volts monitor | 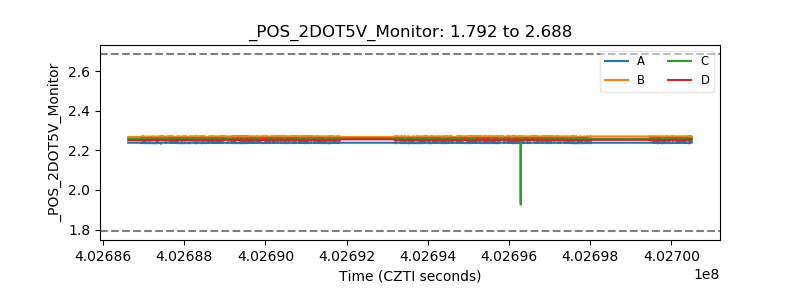 |
| +5 Volts monitor | 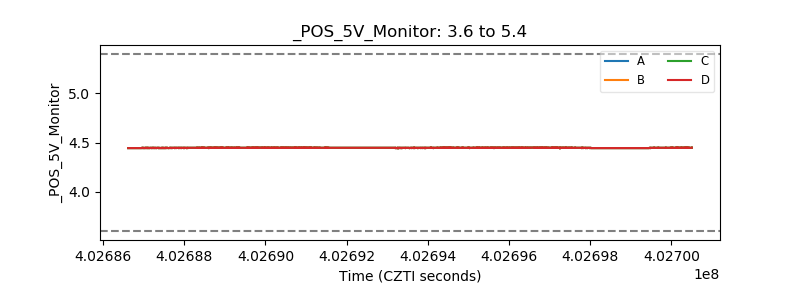 |
| _ROLL_ROT | 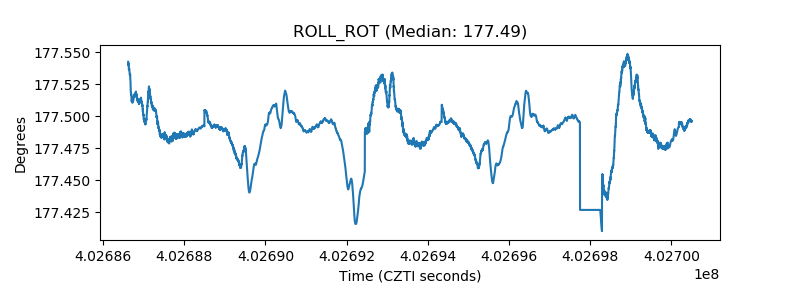 |
| _Roll_DEC | 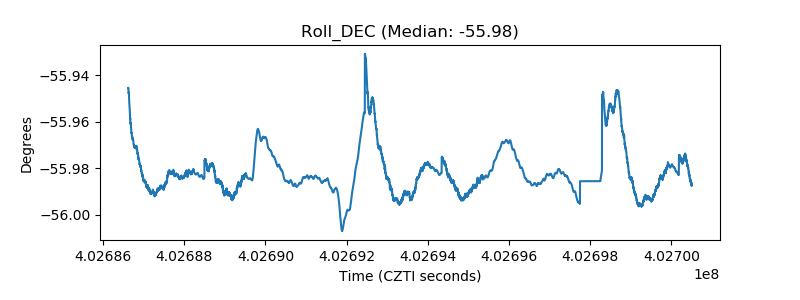 |
| _Roll_RA | 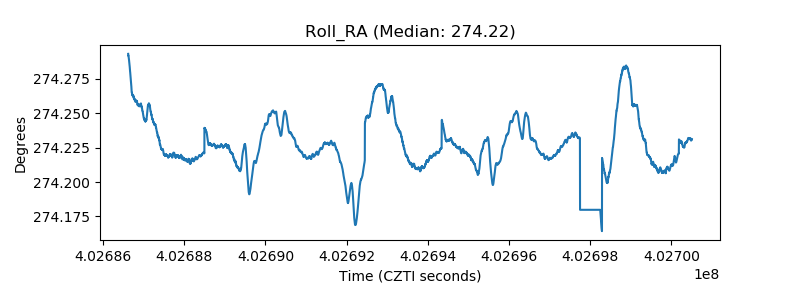 |
| Veto Counter | 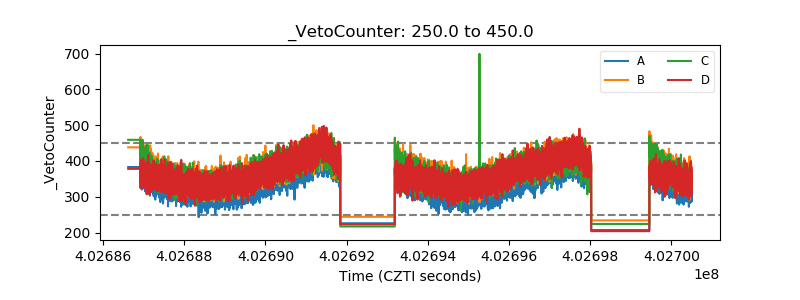 |