| Param | Original file | Final file |
|---|---|---|
| Filename | modeM0/AS1A11_082T01_9000005356_37964cztM0_level2.evt | modeM0/AS1A11_082T01_9000005356_37964cztM0_level2_quad_clean.evt |
| Size (bytes) | 436,236,480 | 68,345,280 |
| Size | 416.0 MB | 65.2 MB |
| Events in quadrant A | 4,119,383 | 427,807 |
| Events in quadrant B | 3,033,354 | 436,756 |
| Events in quadrant C | 2,815,564 | 427,690 |
| Events in quadrant D | 2,867,414 | 389,765 |
| Mode M0 | |||
|---|---|---|---|
| Quadrant | BADHDUFLAG | Total packets | Discarded packets |
| A | 0 | 16071 | 3 |
| B | 0 | 12702 | 2 |
| C | 0 | 11713 | 2 |
| D | 0 | 12478 | 2 |
| Mode SS | |||
|---|---|---|---|
| Quadrant | BADHDUFLAG | Total packets | Discarded packets |
| A | 0 | 112 | 0 |
| B | 0 | 112 | 0 |
| C | 0 | 112 | 0 |
| D | 0 | 112 | 0 |
| Mode M9 | |||
|---|---|---|---|
| Quadrant | BADHDUFLAG | Total packets | Discarded packets |
| A | 0 | 27 | 0 |
| B | 0 | 27 | 0 |
| C | 0 | 27 | 0 |
| D | 0 | 28 | 0 |
| Quadrant | Total seconds | Saturated seconds | Saturation percentage |
|---|---|---|---|
| A | 5536 | 68 | 1.228324% |
| B | 5536 | 90 | 1.625723% |
| C | 5536 | 33 | 0.596098% |
| D | 5536 | 63 | 1.138006% |
Noise dominated data is calculated using 1-second bins in cleaned event files. If a bin has >2000 counts, and if more than 50% of those come from <1% of pixels, then it is considered to be noise-dominated and hence unusable.
| Quadrant | # 1 sec bins | Bins with >0 counts | Bins with >2000 counts | High rate bins dominated by noise | Noise dominated (total time) | Noise dominated (detector-on time) | Marked lightcurve |
|---|---|---|---|---|---|---|---|
| A | 7119 | 5537 | 28 | 28 | 0.39% | 0.51% | 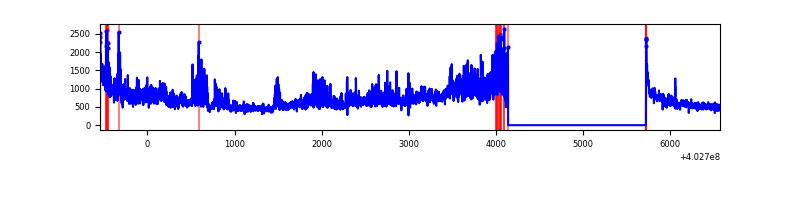 |
| B | 7119 | 5537 | 61 | 61 | 0.86% | 1.10% | 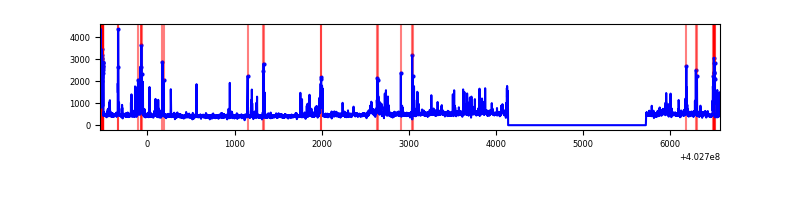 |
| C | 7119 | 5537 | 20 | 20 | 0.28% | 0.36% | 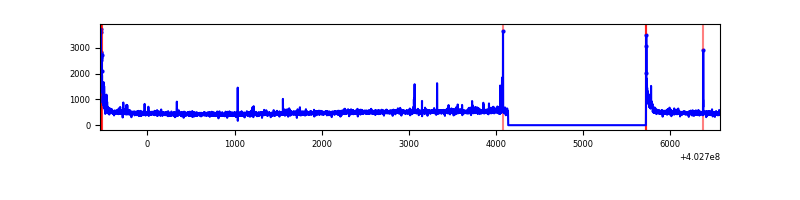 |
| D | 7119 | 5537 | 58 | 58 | 0.81% | 1.05% | 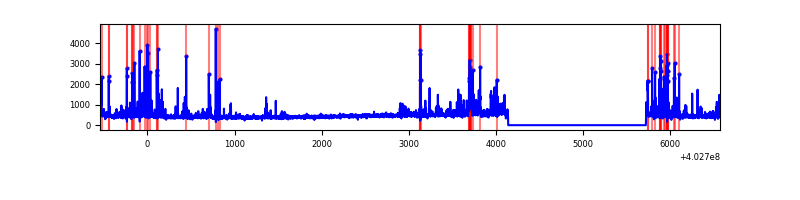 |
Top three noisy pixels from each quadrant. If the there are fewer than three noisy pixels in the level2.evt file, extra rows are filled as -1
| Pixel properties | Quadrant properties | ||||||
|---|---|---|---|---|---|---|---|
| Quadrant | DetID | PixID | Counts | Sigma | Mean | Median | Sigma |
| A | 15 | 222 | 1297770 | 10222.4 | 620 | 607 | 126.9 |
| A | 10 | 83 | 371264 | 2920.99 | 620 | 607 | 126.9 |
| A | 12 | 189 | 17167 | 130.5 | 620 | 607 | 126.9 |
| B | 5 | 172 | 211812 | 1778.31 | 620 | 603 | 118.8 |
| B | 5 | 184 | 92719 | 775.58 | 620 | 603 | 118.8 |
| B | 4 | 81 | 87098 | 728.26 | 620 | 603 | 118.8 |
| C | 15 | 214 | 233581 | 1635.06 | 610 | 612 | 142.5 |
| C | 0 | 10 | 135962 | 949.93 | 610 | 612 | 142.5 |
| C | 14 | 254 | 43001 | 297.5 | 610 | 612 | 142.5 |
| D | 13 | 249 | 225744 | 1530.03 | 604 | 588 | 147.2 |
| D | 1 | 52 | 104044 | 703.03 | 604 | 588 | 147.2 |
| D | 10 | 253 | 45792 | 307.18 | 604 | 588 | 147.2 |
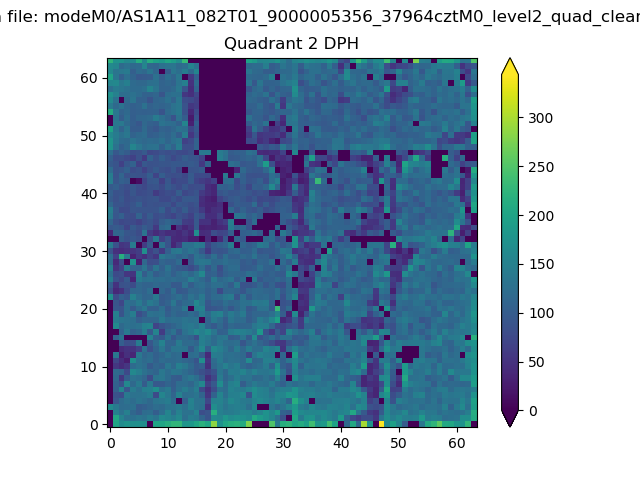
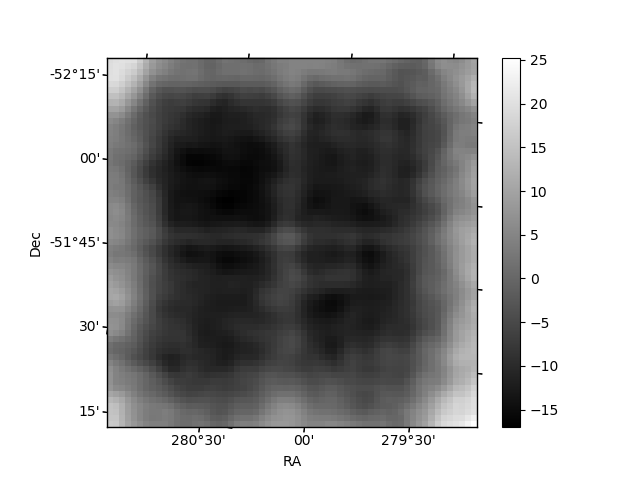
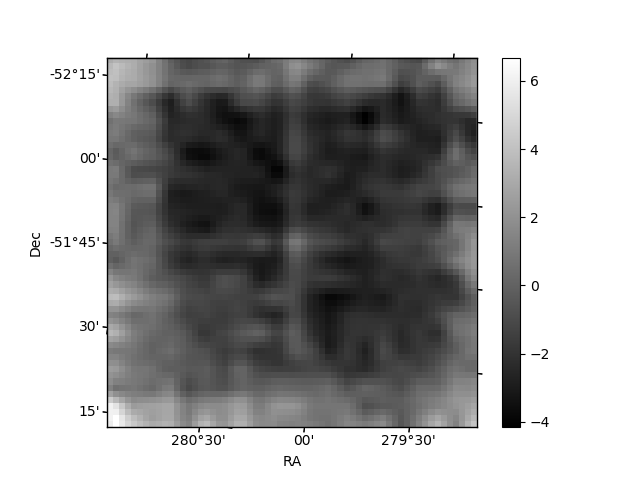
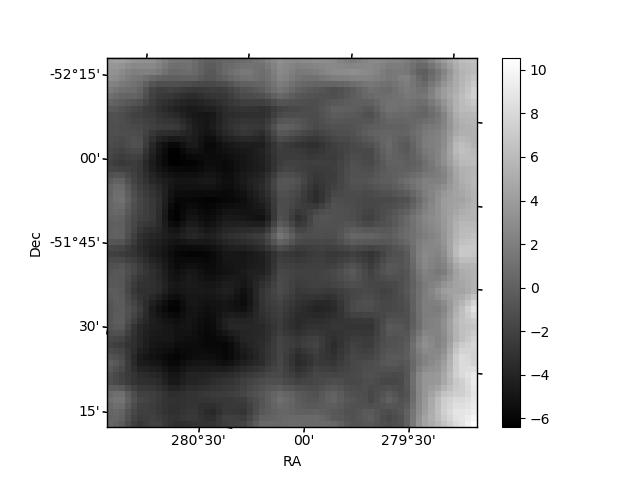
Histogram calculated using DETX and DETY for each event in the final _common_clean file
| Quadrant A | 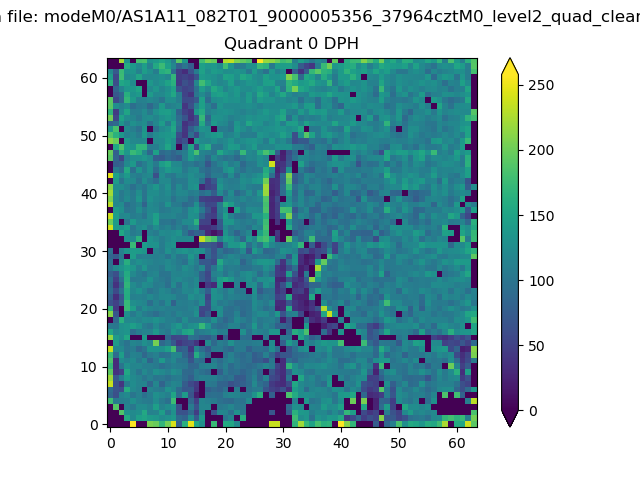 |
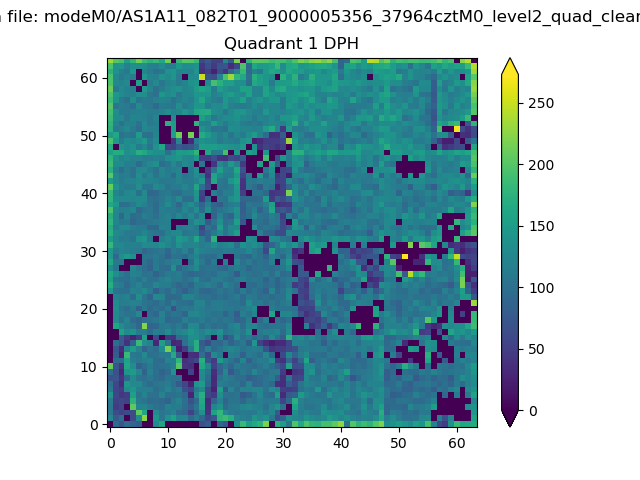 |
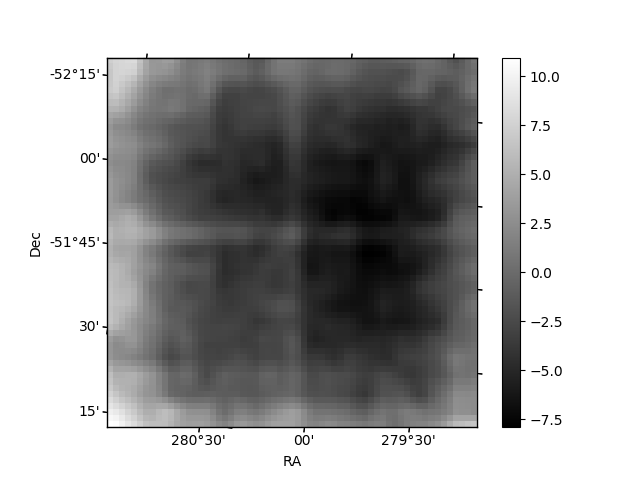
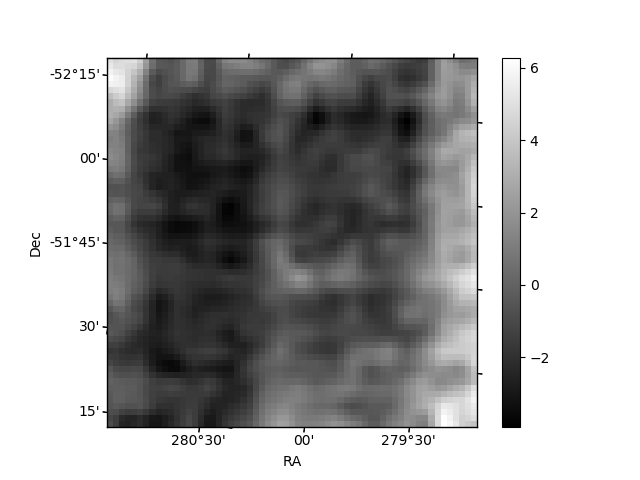
Quadrant B |
|---|---|---|---|
| Quadrant D | 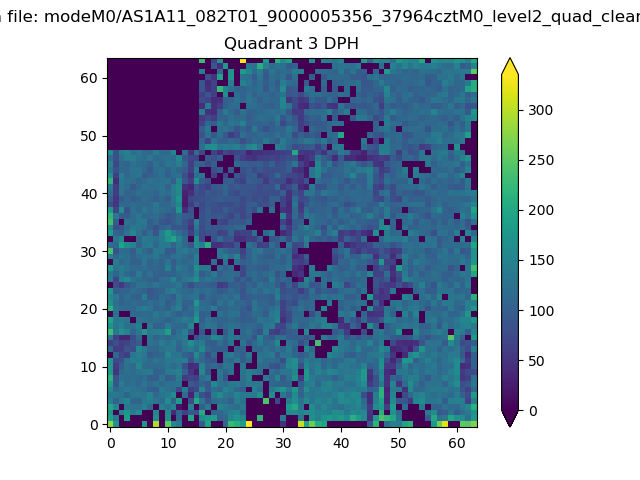 |
 |
Quadrant C |
| Plot type | Count rate plots | Images |
|---|---|---|
| Comparison with Poisson distribution Blue bars denote a histogram of data divided into 1 sec bins. Red curve is a Poisson curve with rate = median count rate of data. |
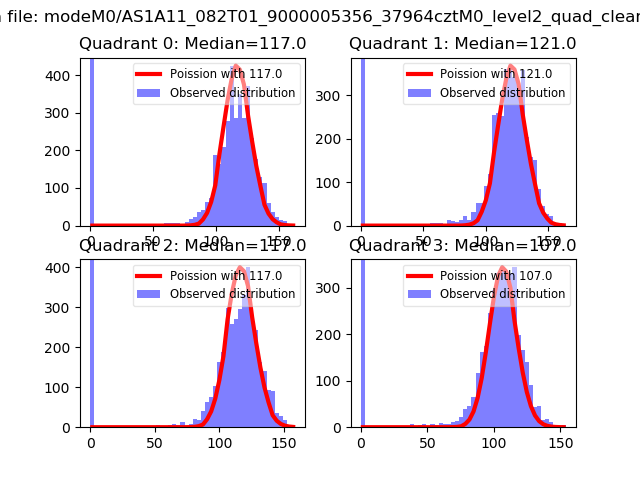 |
 |
| Quadrant-wise count rates Data is divided into 100 sec bins |
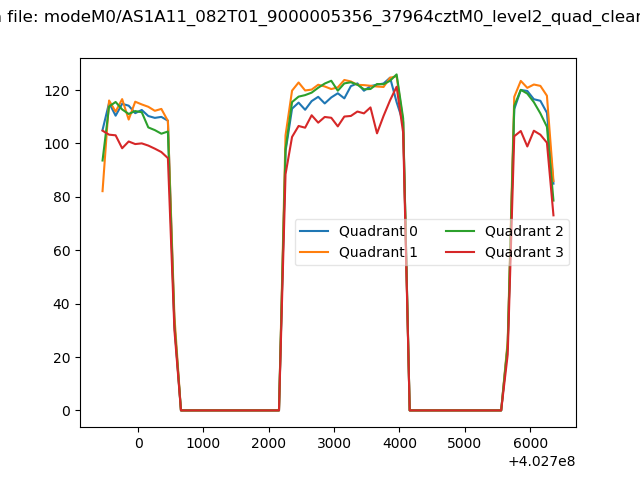 |
|
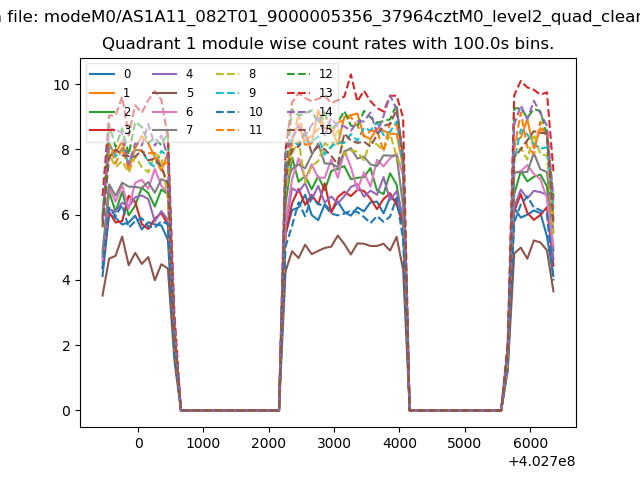
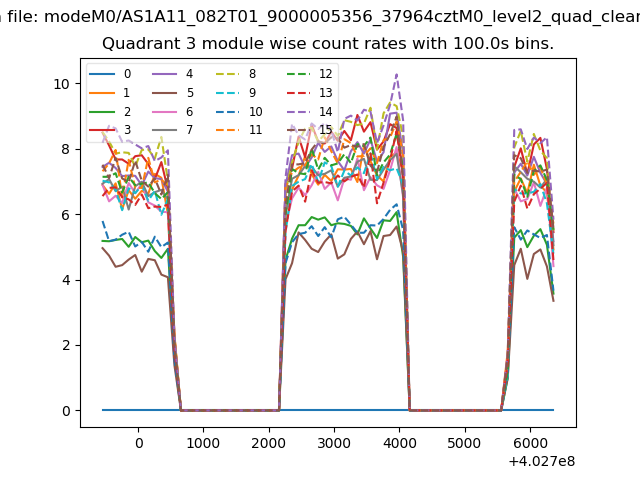
| Module-wise count rates for Quadrant A Data is divided into 100 sec bins |
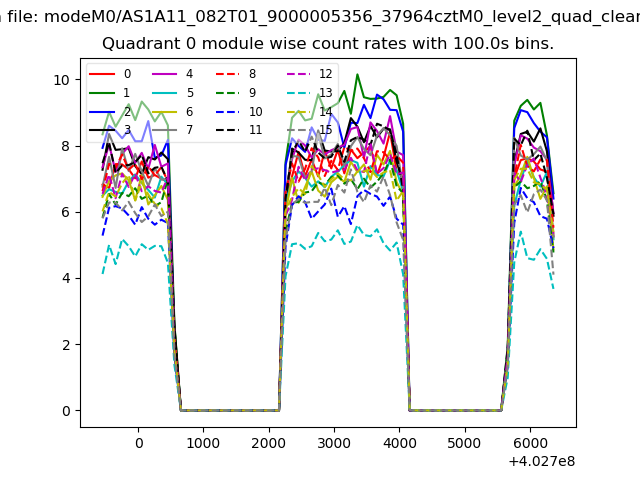 |
 |
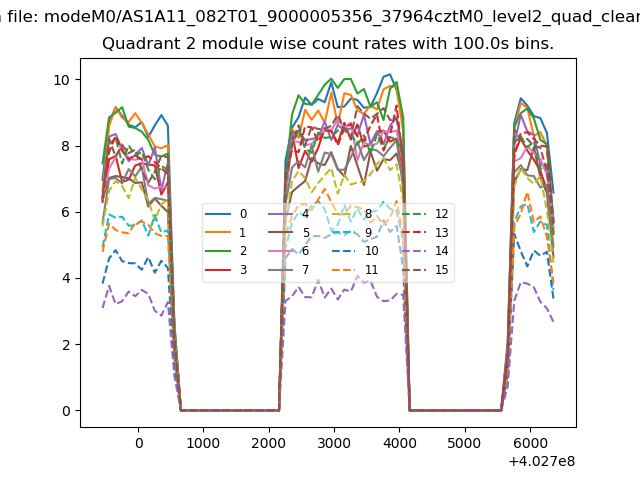
| Module-wise count rates for Quadrant B Data is divided into 100 sec bins |
 |
 |
| Module-wise count rates for Quadrant C Data is divided into 100 sec bins |
 |
 |
| Module-wise count rates for Quadrant D Data is divided into 100 sec bins |
 |
 |
| Parameter | Plot |
|---|---|
| CZT HV Monitor | 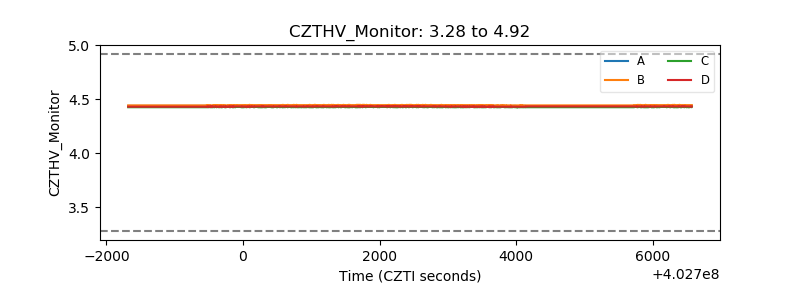 |
| D_VDD | 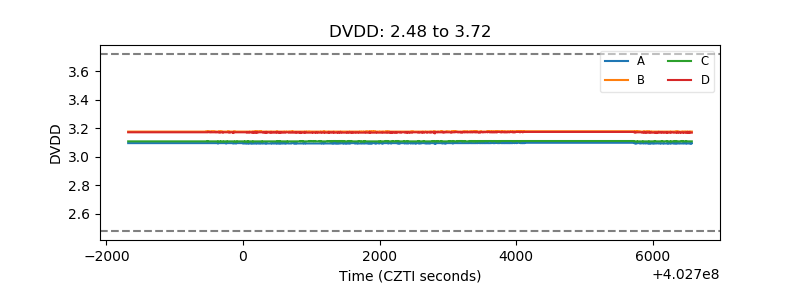 |
| Temperature 1 | 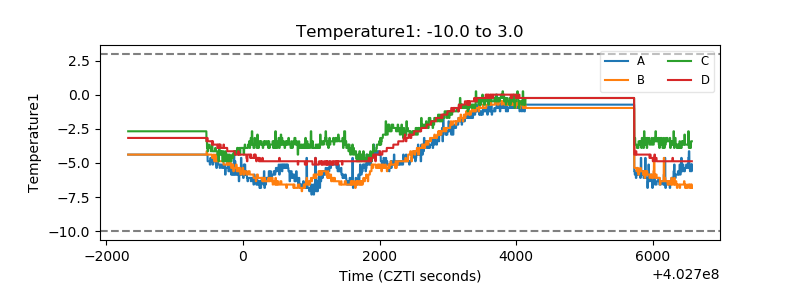 |
| Veto HV Monitor | 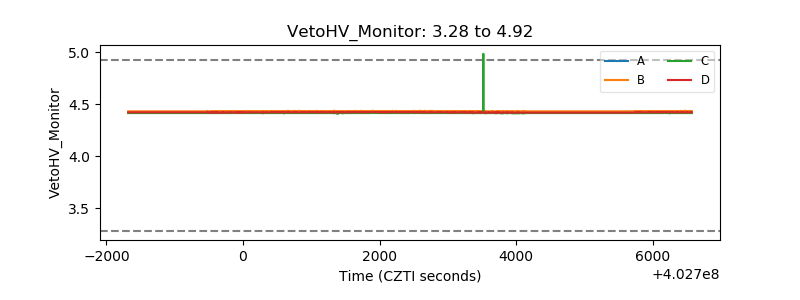 |
| Veto LLD | 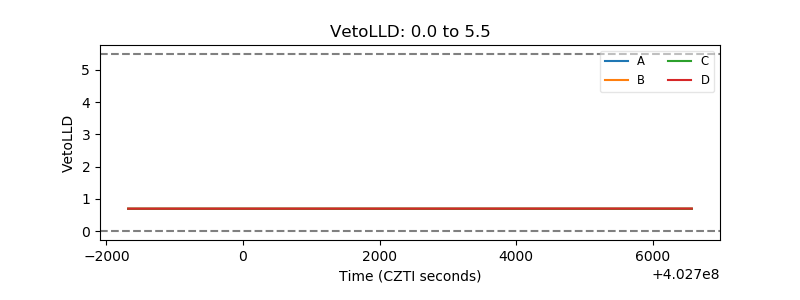 |
| Alpha Counter | 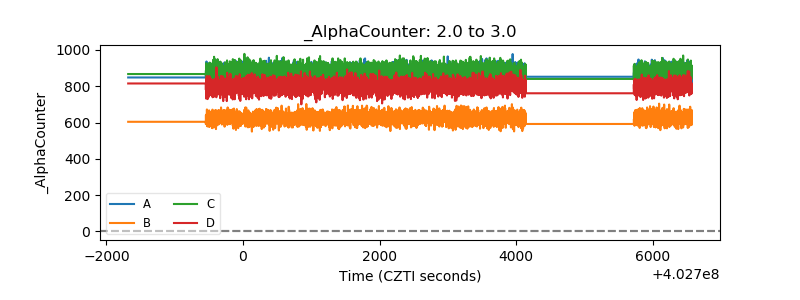 |
| _CPM_Rate | 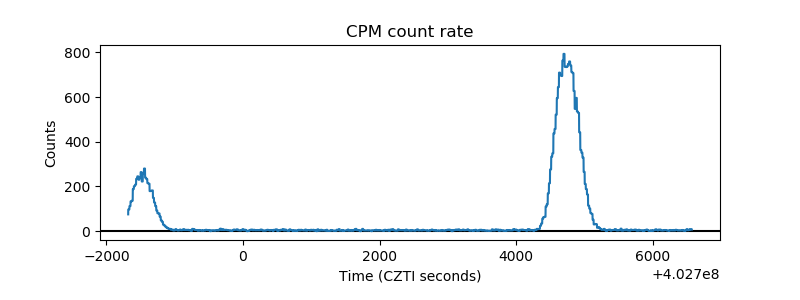 |
| CZT Counter | 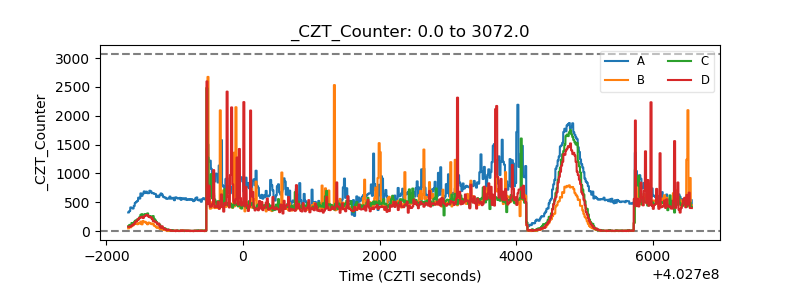 |
| +2.5 Volts monitor | 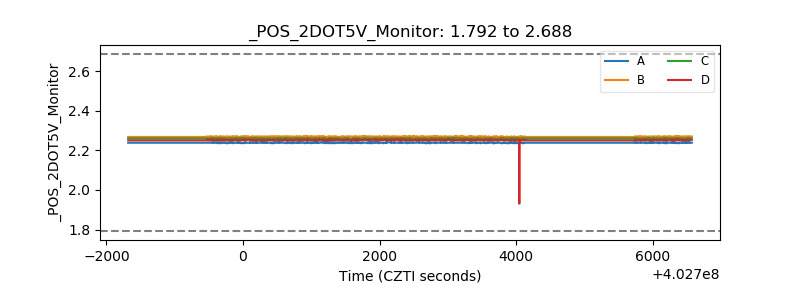 |
| +5 Volts monitor | 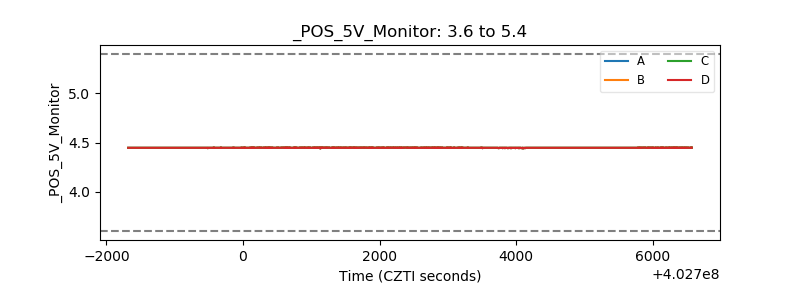 |
| _ROLL_ROT | 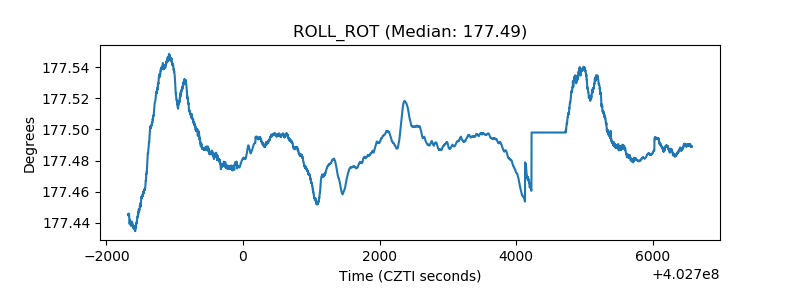 |
| _Roll_DEC | 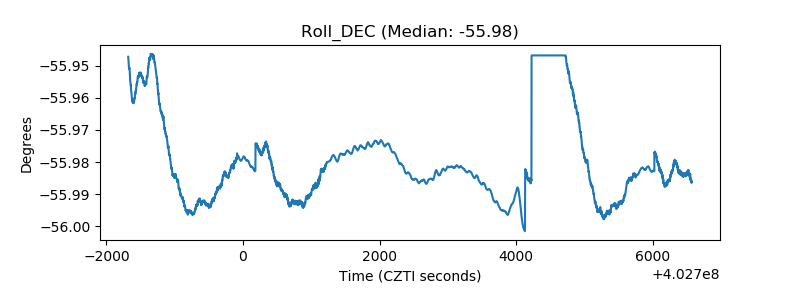 |
| _Roll_RA | 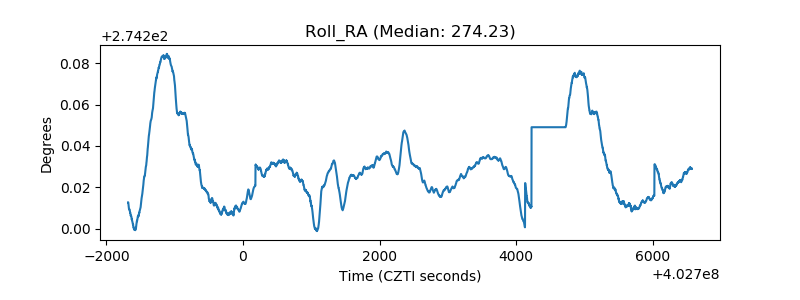 |
| Veto Counter | 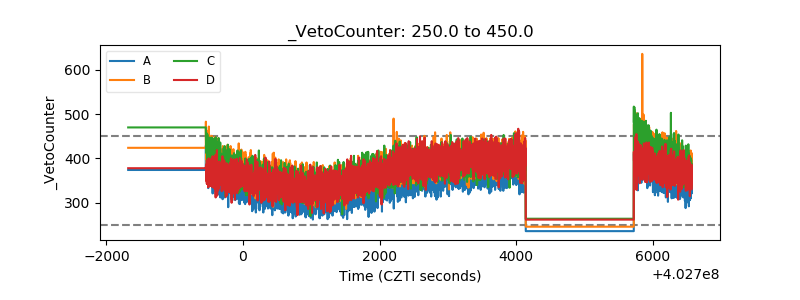 |