| Param | Original file | Final file |
|---|---|---|
| Filename | modeM0/AS1A11_082T01_9000005356_37965cztM0_level2.evt | modeM0/AS1A11_082T01_9000005356_37965cztM0_level2_quad_clean.evt |
| Size (bytes) | 428,382,720 | 57,470,400 |
| Size | 408.5 MB | 54.8 MB |
| Events in quadrant A | 3,410,668 | 341,221 |
| Events in quadrant B | 3,366,527 | 348,091 |
| Events in quadrant C | 2,879,661 | 343,914 |
| Events in quadrant D | 2,932,384 | 311,284 |
| Mode M0 | |||
|---|---|---|---|
| Quadrant | BADHDUFLAG | Total packets | Discarded packets |
| A | 0 | 13744 | 3 |
| B | 0 | 13733 | 2 |
| C | 0 | 11884 | 2 |
| D | 0 | 12685 | 2 |
| Mode SS | |||
|---|---|---|---|
| Quadrant | BADHDUFLAG | Total packets | Discarded packets |
| A | 0 | 114 | 0 |
| B | 0 | 114 | 0 |
| C | 0 | 114 | 0 |
| D | 0 | 114 | 0 |
| Mode M9 | |||
|---|---|---|---|
| Quadrant | BADHDUFLAG | Total packets | Discarded packets |
| A | 0 | 26 | 0 |
| B | 0 | 26 | 0 |
| C | 0 | 26 | 0 |
| D | 0 | 27 | 0 |
| Quadrant | Total seconds | Saturated seconds | Saturation percentage |
|---|---|---|---|
| A | 5660 | 76 | 1.342756% |
| B | 5660 | 124 | 2.190813% |
| C | 5660 | 33 | 0.583039% |
| D | 5660 | 69 | 1.219081% |
Noise dominated data is calculated using 1-second bins in cleaned event files. If a bin has >2000 counts, and if more than 50% of those come from <1% of pixels, then it is considered to be noise-dominated and hence unusable.
| Quadrant | # 1 sec bins | Bins with >0 counts | Bins with >2000 counts | High rate bins dominated by noise | Noise dominated (total time) | Noise dominated (detector-on time) | Marked lightcurve |
|---|---|---|---|---|---|---|---|
| A | 7362 | 5661 | 36 | 36 | 0.49% | 0.64% | 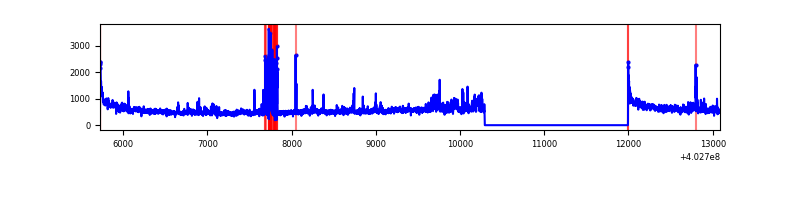 |
| B | 7362 | 5661 | 74 | 74 | 1.01% | 1.31% | 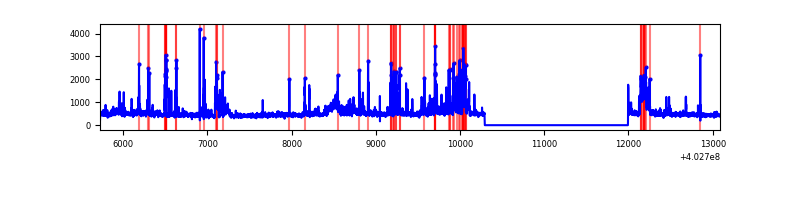 |
| C | 7362 | 5661 | 24 | 24 | 0.33% | 0.42% | 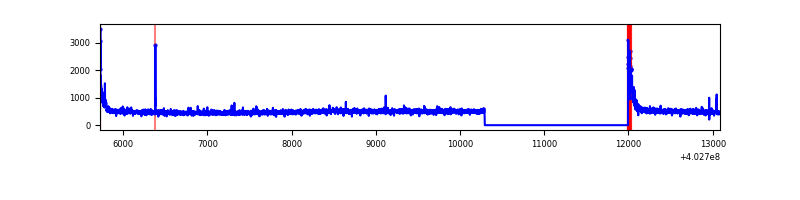 |
| D | 7362 | 5661 | 46 | 46 | 0.62% | 0.81% | 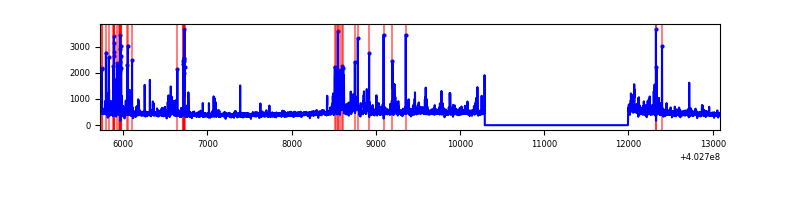 |
Top three noisy pixels from each quadrant. If the there are fewer than three noisy pixels in the level2.evt file, extra rows are filled as -1
| Pixel properties | Quadrant properties | ||||||
|---|---|---|---|---|---|---|---|
| Quadrant | DetID | PixID | Counts | Sigma | Mean | Median | Sigma |
| A | 15 | 222 | 369272 | 2859.95 | 636 | 623 | 128.9 |
| A | 10 | 83 | 368974 | 2857.64 | 636 | 623 | 128.9 |
| A | 9 | 143 | 136508 | 1054.18 | 636 | 623 | 128.9 |
| B | 0 | 229 | 315443 | 2569.87 | 641 | 623 | 122.5 |
| B | 5 | 172 | 221494 | 1802.97 | 641 | 623 | 122.5 |
| B | 5 | 184 | 116594 | 946.67 | 641 | 623 | 122.5 |
| C | 15 | 214 | 238770 | 1627.12 | 631 | 634 | 146.4 |
| C | 0 | 10 | 152679 | 1038.88 | 631 | 634 | 146.4 |
| C | 14 | 254 | 23101 | 153.51 | 631 | 634 | 146.4 |
| D | 13 | 249 | 145638 | 944.42 | 625 | 609 | 153.6 |
| D | 10 | 199 | 91742 | 593.46 | 625 | 609 | 153.6 |
| D | 7 | 55 | 86844 | 561.56 | 625 | 609 | 153.6 |
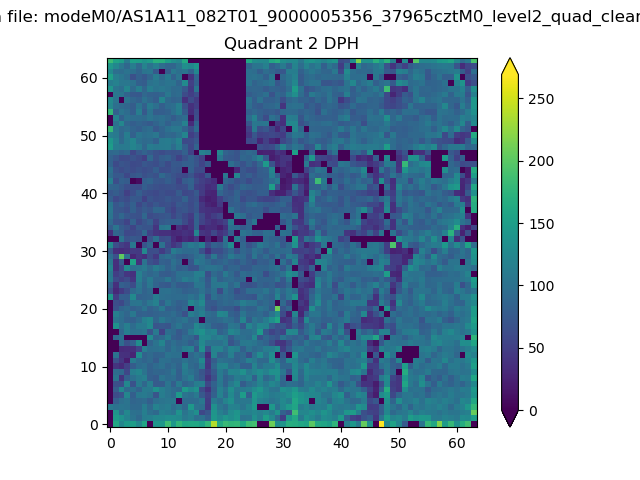
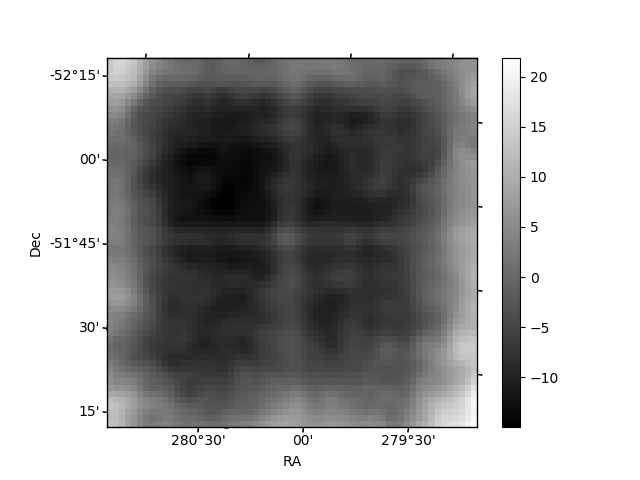
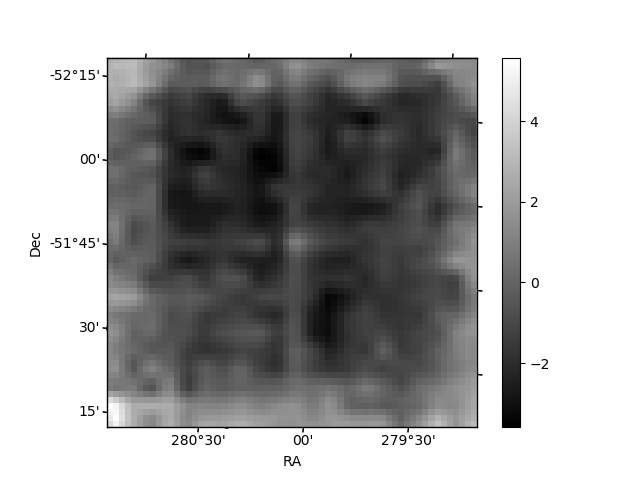
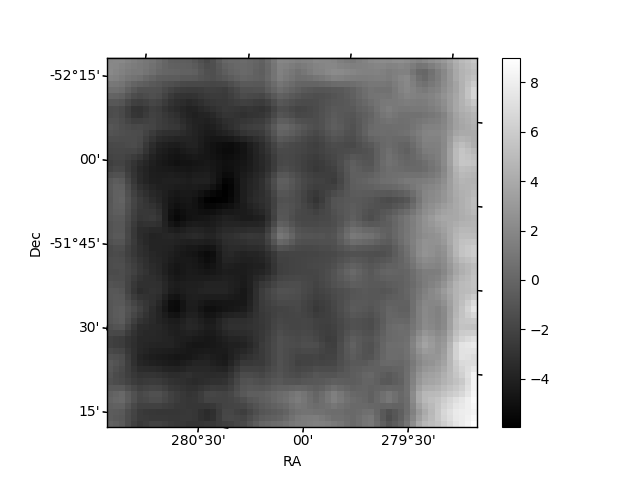
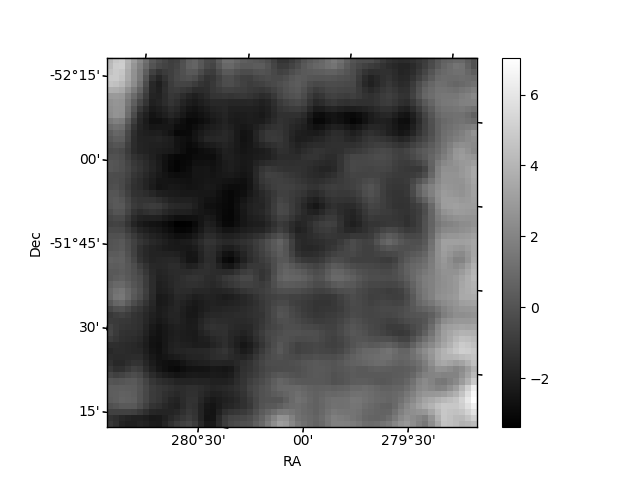
Histogram calculated using DETX and DETY for each event in the final _common_clean file
| Quadrant A | 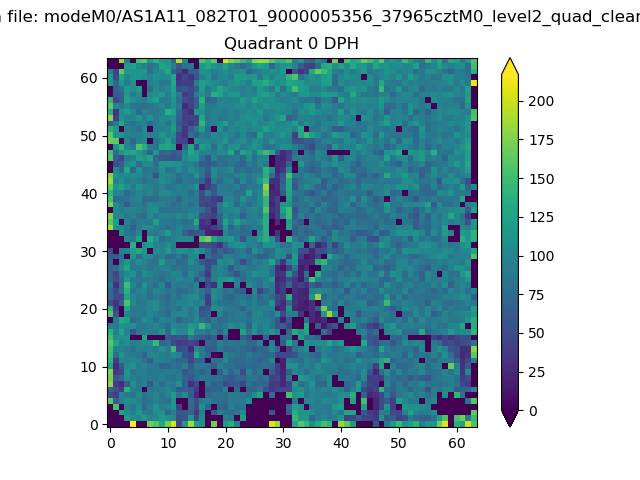 |
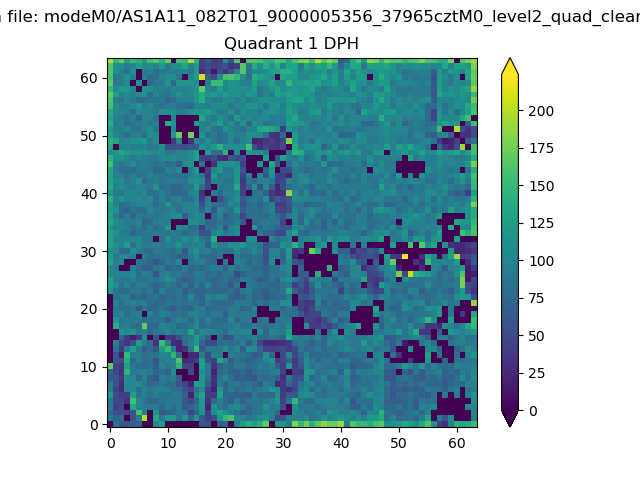 |
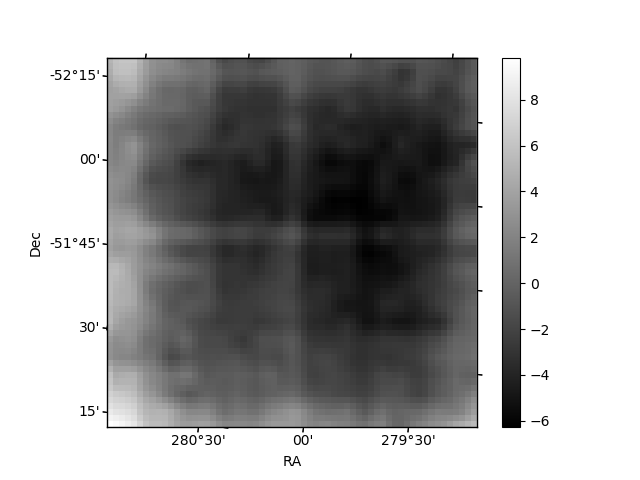
Quadrant B |
|---|---|---|---|
| Quadrant D | 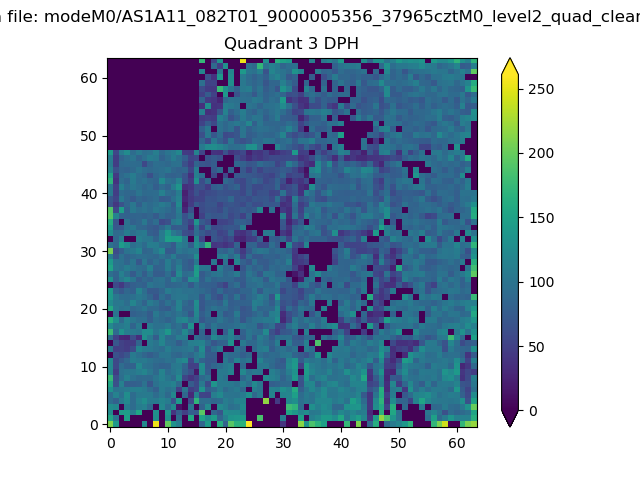 |
 |
Quadrant C |
| Plot type | Count rate plots | Images |
|---|---|---|
| Comparison with Poisson distribution Blue bars denote a histogram of data divided into 1 sec bins. Red curve is a Poisson curve with rate = median count rate of data. |
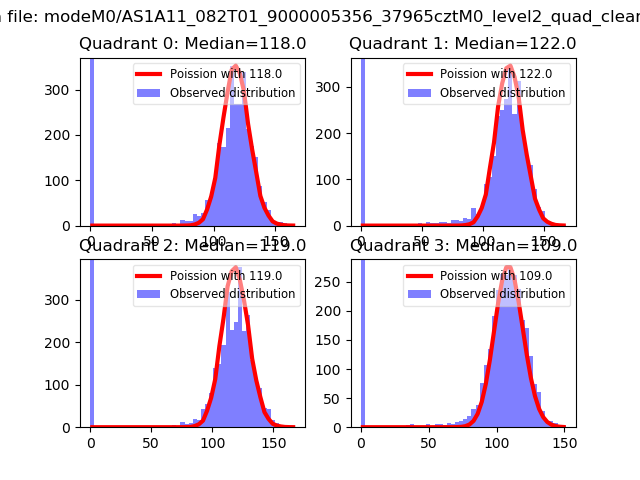 |
 |
| Quadrant-wise count rates Data is divided into 100 sec bins |
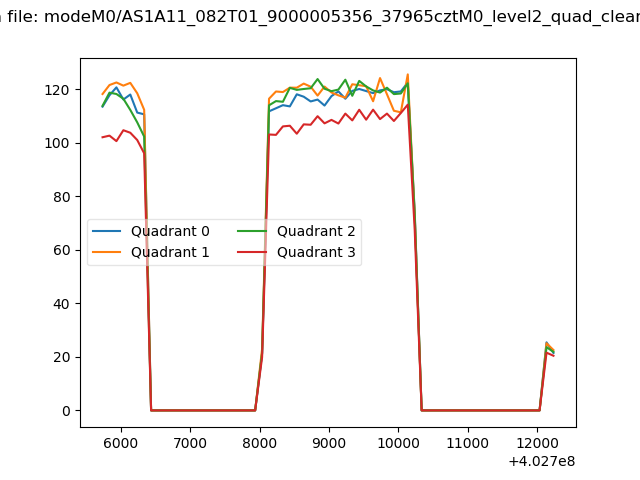 |
|
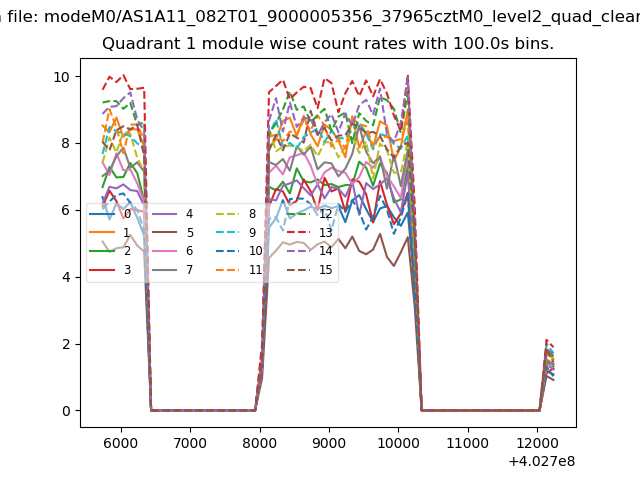
| Module-wise count rates for Quadrant A Data is divided into 100 sec bins |
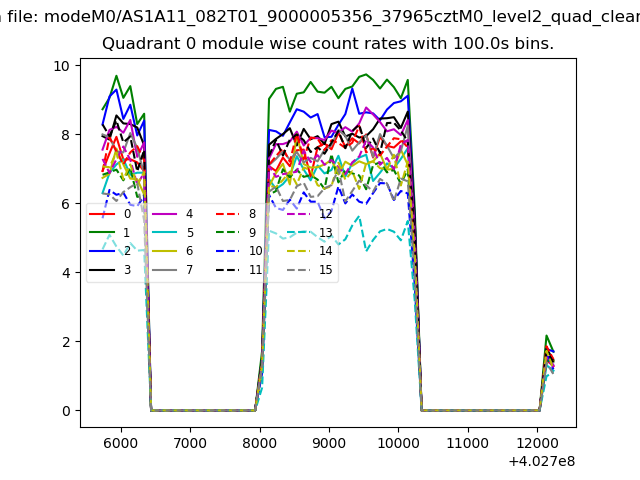 |
 |
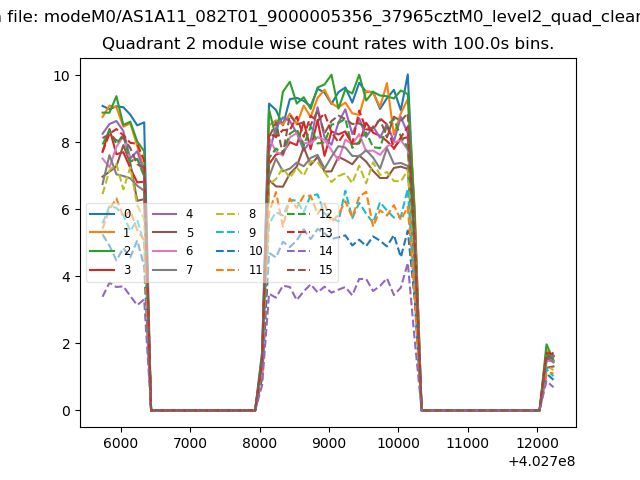
| Module-wise count rates for Quadrant B Data is divided into 100 sec bins |
 |
 |
| Module-wise count rates for Quadrant C Data is divided into 100 sec bins |
 |
 |
| Module-wise count rates for Quadrant D Data is divided into 100 sec bins |
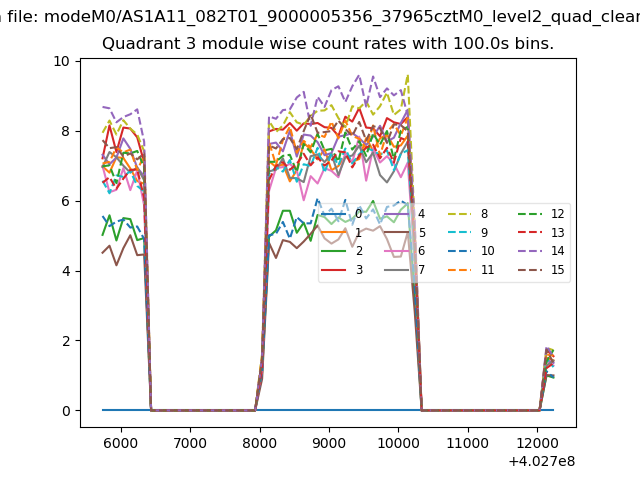 |
 |
| Parameter | Plot |
|---|---|
| CZT HV Monitor | 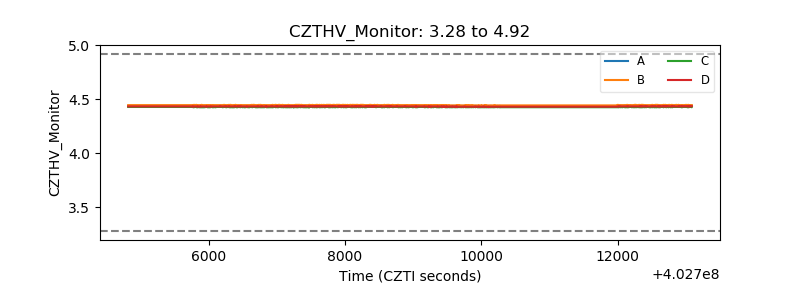 |
| D_VDD | 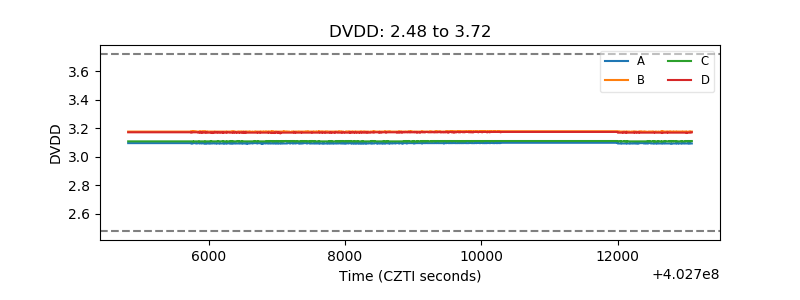 |
| Temperature 1 | 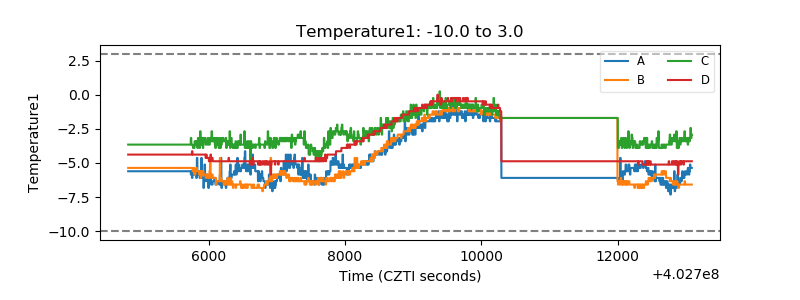 |
| Veto HV Monitor | 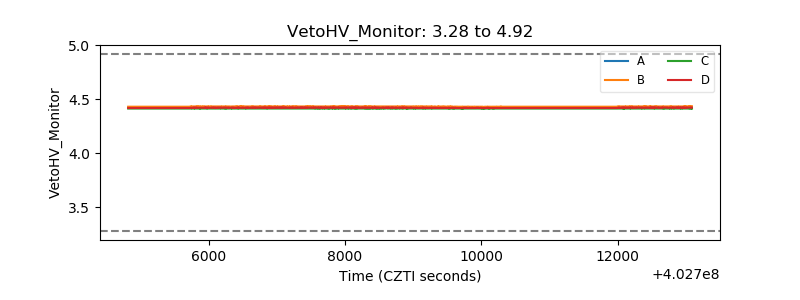 |
| Veto LLD | 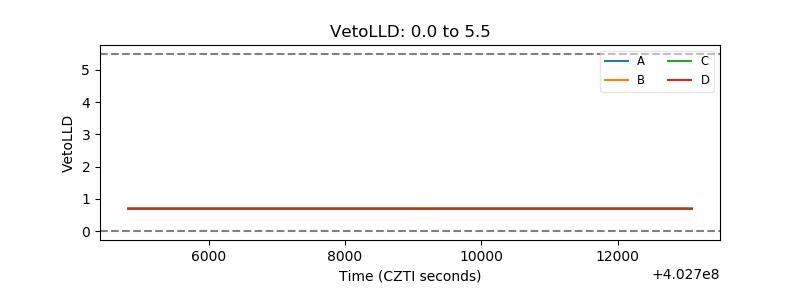 |
| Alpha Counter | 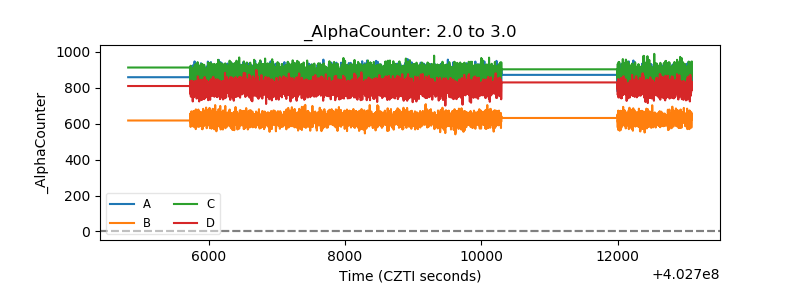 |
| _CPM_Rate | 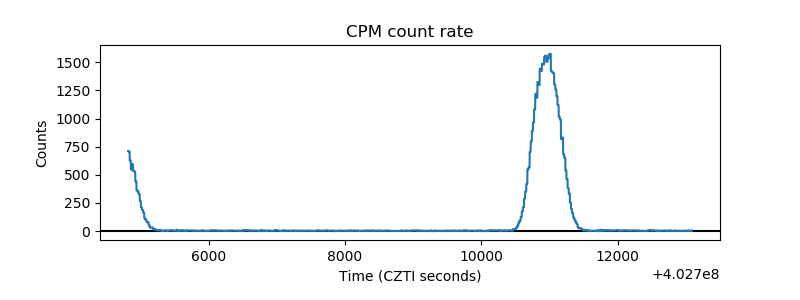 |
| CZT Counter | 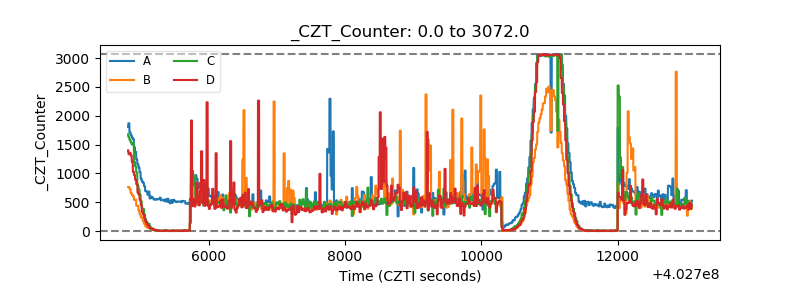 |
| +2.5 Volts monitor | 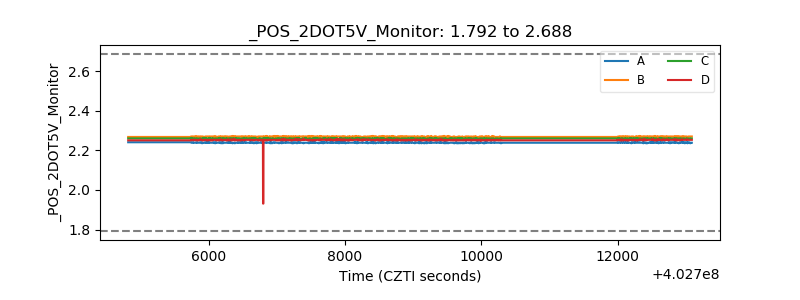 |
| +5 Volts monitor | 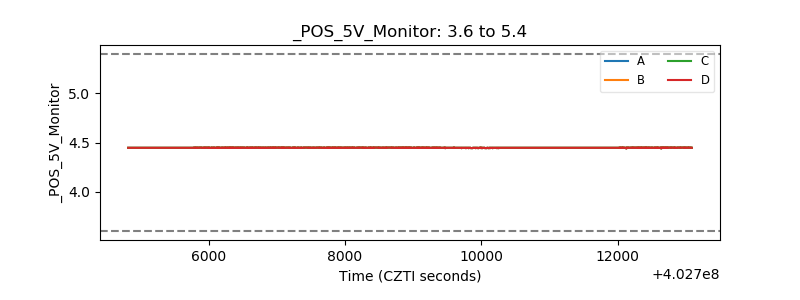 |
| _ROLL_ROT | 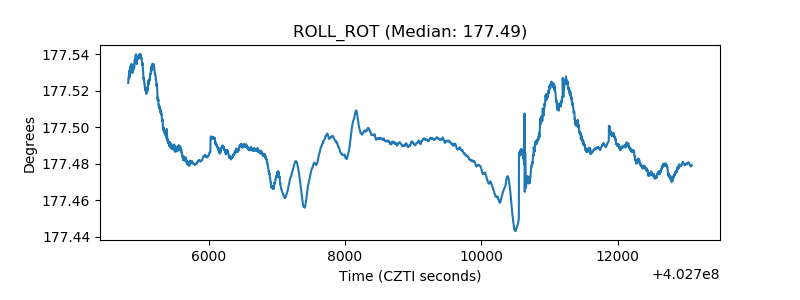 |
| _Roll_DEC | 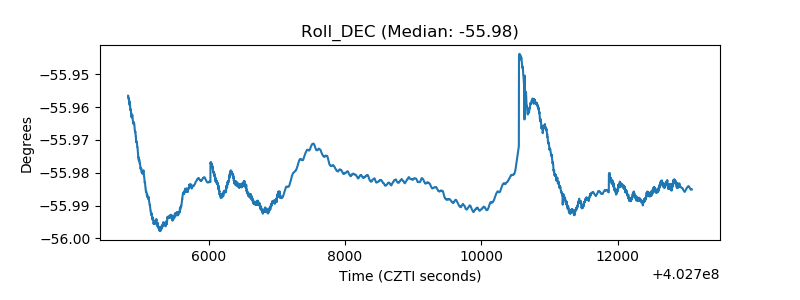 |
| _Roll_RA |  |
| Veto Counter | 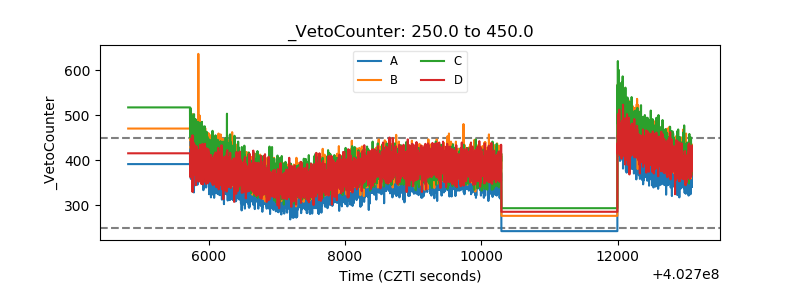 |