| Param | Original file | Final file |
|---|---|---|
| Filename | modeM0/AS1A11_082T01_9000005356_37967cztM0_level2.evt | modeM0/AS1A11_082T01_9000005356_37967cztM0_level2_quad_clean.evt |
| Size (bytes) | 456,952,320 | 50,826,240 |
| Size | 435.8 MB | 48.5 MB |
| Events in quadrant A | 4,678,954 | 275,915 |
| Events in quadrant B | 3,036,917 | 305,094 |
| Events in quadrant C | 2,898,990 | 303,750 |
| Events in quadrant D | 2,854,793 | 273,390 |
| Mode M0 | |||
|---|---|---|---|
| Quadrant | BADHDUFLAG | Total packets | Discarded packets |
| A | 0 | 17720 | 3 |
| B | 0 | 12483 | 2 |
| C | 0 | 11701 | 2 |
| D | 0 | 12130 | 2 |
| Mode SS | |||
|---|---|---|---|
| Quadrant | BADHDUFLAG | Total packets | Discarded packets |
| A | 0 | 112 | 0 |
| B | 0 | 112 | 0 |
| C | 0 | 112 | 0 |
| D | 0 | 112 | 0 |
| Mode M9 | |||
|---|---|---|---|
| Quadrant | BADHDUFLAG | Total packets | Discarded packets |
| A | 0 | 20 | 0 |
| B | 0 | 20 | 0 |
| C | 0 | 20 | 0 |
| D | 0 | 21 | 0 |
| Quadrant | Total seconds | Saturated seconds | Saturation percentage |
|---|---|---|---|
| A | 5435 | 241 | 4.434223% |
| B | 5435 | 79 | 1.453542% |
| C | 5435 | 35 | 0.643974% |
| D | 5435 | 57 | 1.048758% |
Noise dominated data is calculated using 1-second bins in cleaned event files. If a bin has >2000 counts, and if more than 50% of those come from <1% of pixels, then it is considered to be noise-dominated and hence unusable.
| Quadrant | # 1 sec bins | Bins with >0 counts | Bins with >2000 counts | High rate bins dominated by noise | Noise dominated (total time) | Noise dominated (detector-on time) | Marked lightcurve |
|---|---|---|---|---|---|---|---|
| A | 7257 | 5436 | 179 | 179 | 2.47% | 3.29% | 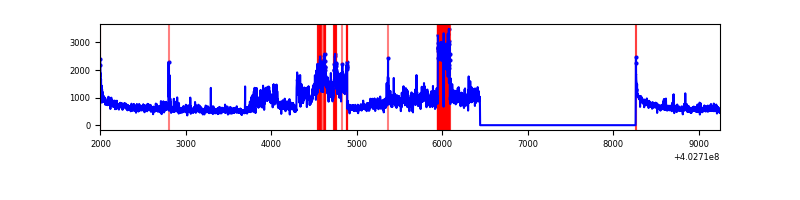 |
| B | 7257 | 5436 | 50 | 50 | 0.69% | 0.92% | 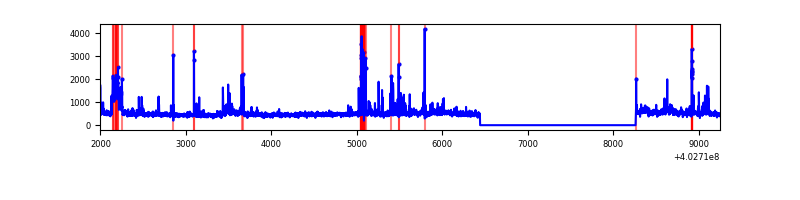 |
| C | 7257 | 5436 | 27 | 27 | 0.37% | 0.50% | 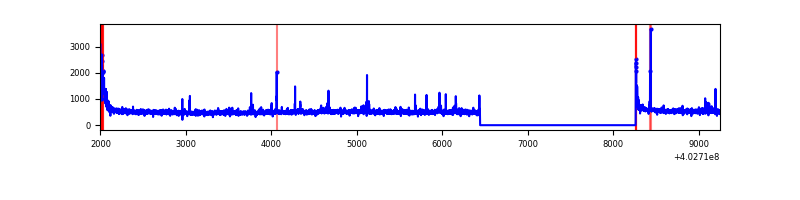 |
| D | 7257 | 5436 | 39 | 39 | 0.54% | 0.72% | 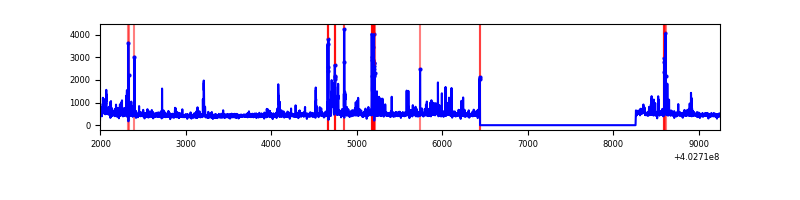 |
Top three noisy pixels from each quadrant. If the there are fewer than three noisy pixels in the level2.evt file, extra rows are filled as -1
| Pixel properties | Quadrant properties | ||||||
|---|---|---|---|---|---|---|---|
| Quadrant | DetID | PixID | Counts | Sigma | Mean | Median | Sigma |
| A | 15 | 222 | 960486 | 7815.12 | 621 | 611 | 122.8 |
| A | 15 | 235 | 905996 | 7371.48 | 621 | 611 | 122.8 |
| A | 10 | 83 | 362508 | 2946.5 | 621 | 611 | 122.8 |
| B | 0 | 229 | 169093 | 1415.97 | 636 | 619 | 119.0 |
| B | 5 | 184 | 160219 | 1341.39 | 636 | 619 | 119.0 |
| B | 5 | 200 | 76941 | 641.46 | 636 | 619 | 119.0 |
| C | 15 | 214 | 229571 | 1570.24 | 630 | 634 | 145.8 |
| C | 0 | 10 | 133182 | 909.12 | 630 | 634 | 145.8 |
| C | 14 | 254 | 77524 | 527.38 | 630 | 634 | 145.8 |
| D | 10 | 199 | 112057 | 741.52 | 622 | 607 | 150.3 |
| D | 1 | 52 | 81859 | 540.6 | 622 | 607 | 150.3 |
| D | 7 | 55 | 70850 | 467.35 | 622 | 607 | 150.3 |
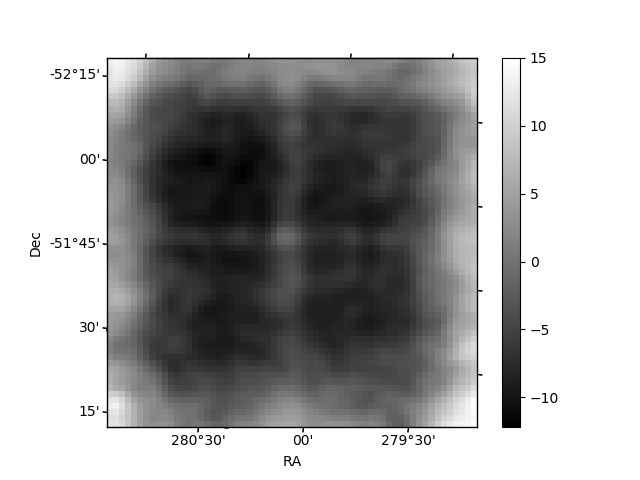
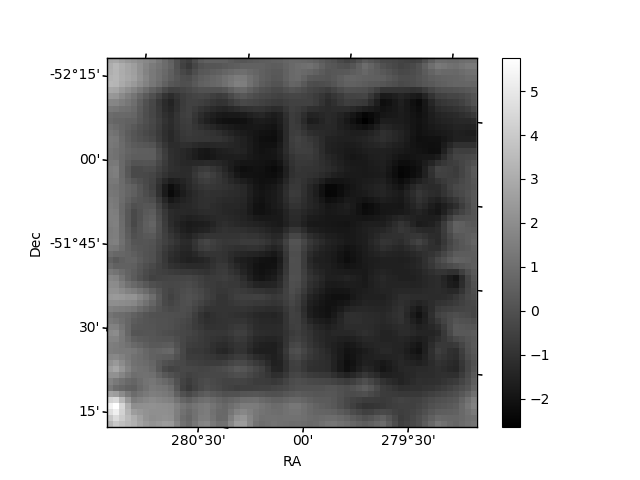
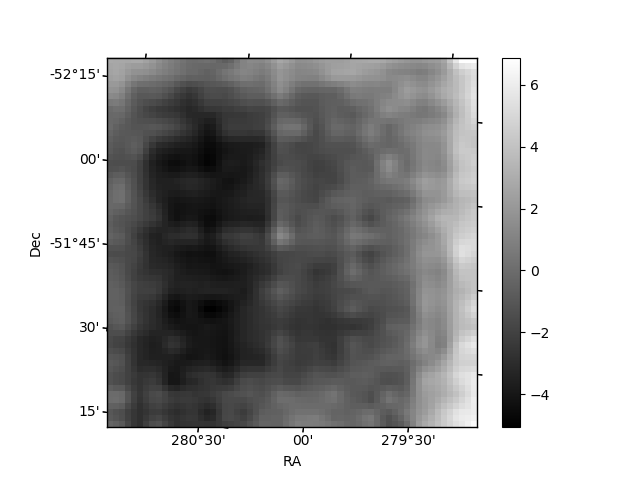
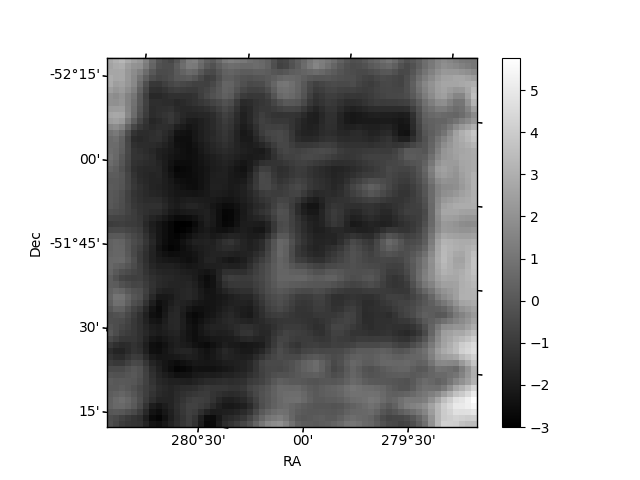
Histogram calculated using DETX and DETY for each event in the final _common_clean file
| Quadrant A | 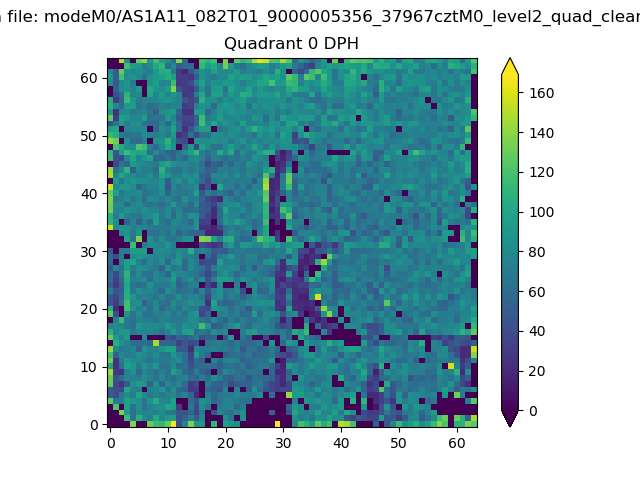 |
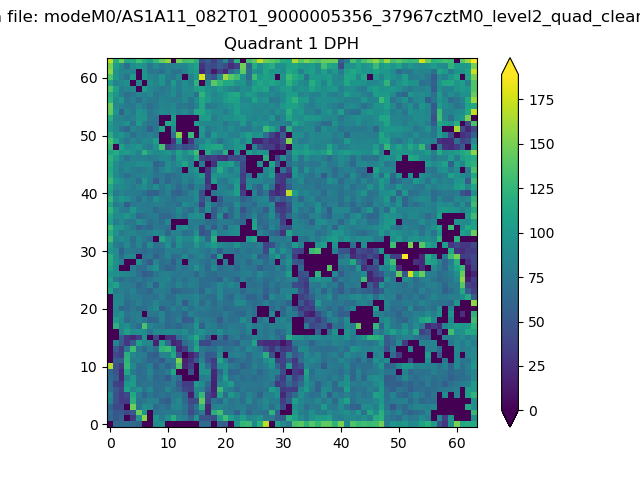 |
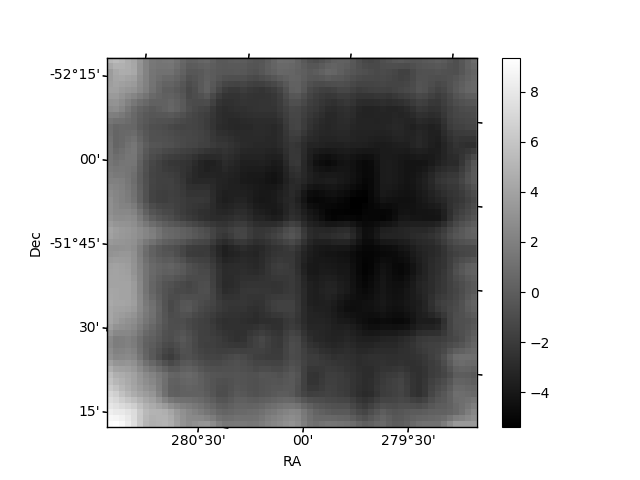
Quadrant B |
|---|---|---|---|
| Quadrant D | 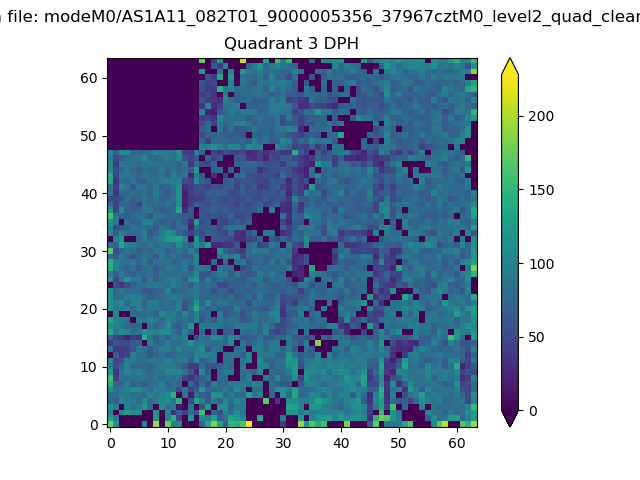 |
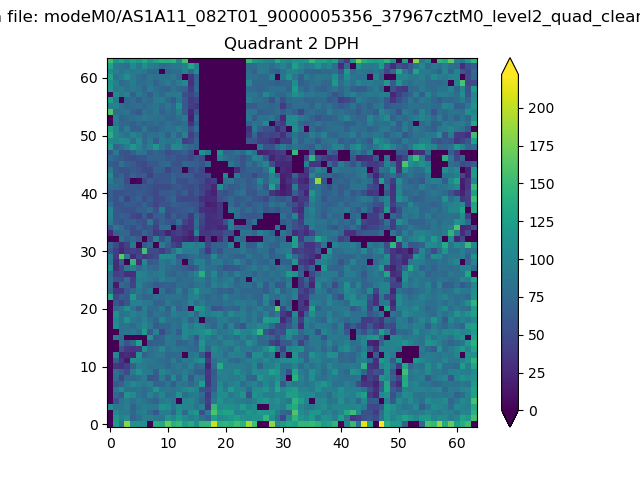 |
Quadrant C |
| Plot type | Count rate plots | Images |
|---|---|---|
| Comparison with Poisson distribution Blue bars denote a histogram of data divided into 1 sec bins. Red curve is a Poisson curve with rate = median count rate of data. |
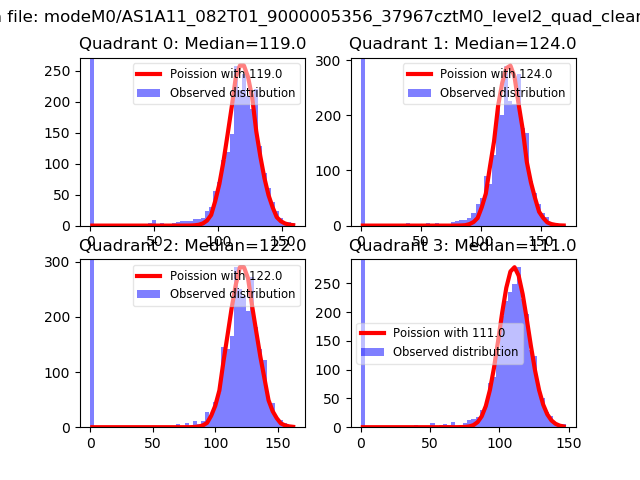 |
 |
| Quadrant-wise count rates Data is divided into 100 sec bins |
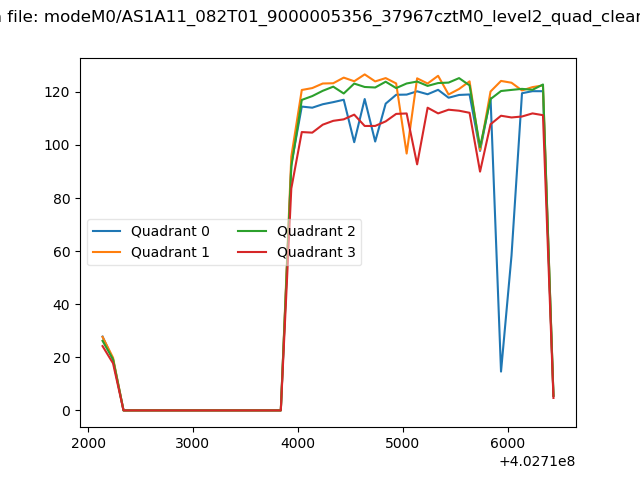 |
|
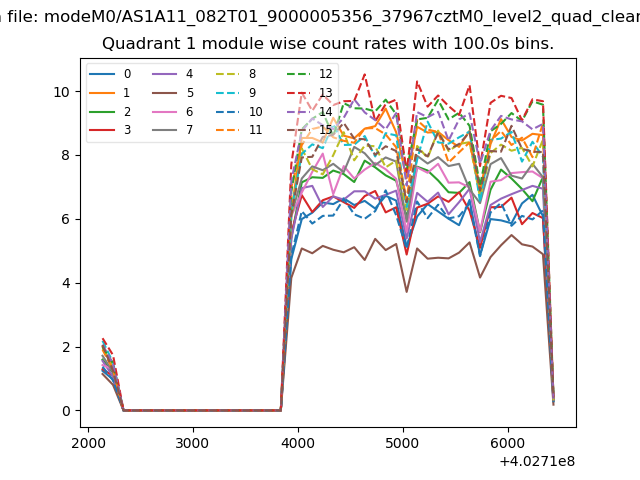
| Module-wise count rates for Quadrant A Data is divided into 100 sec bins |
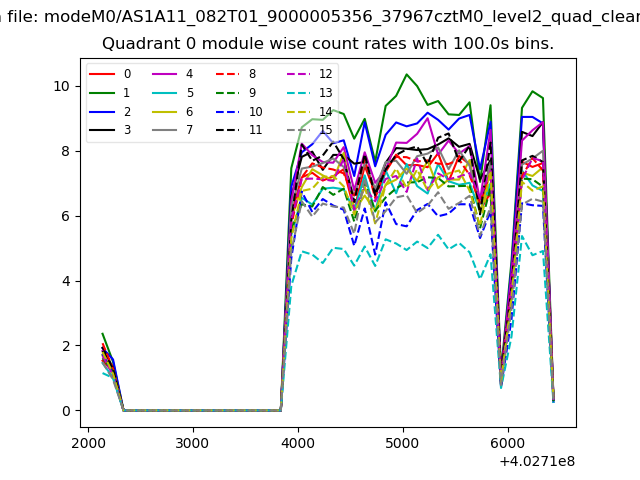 |
 |
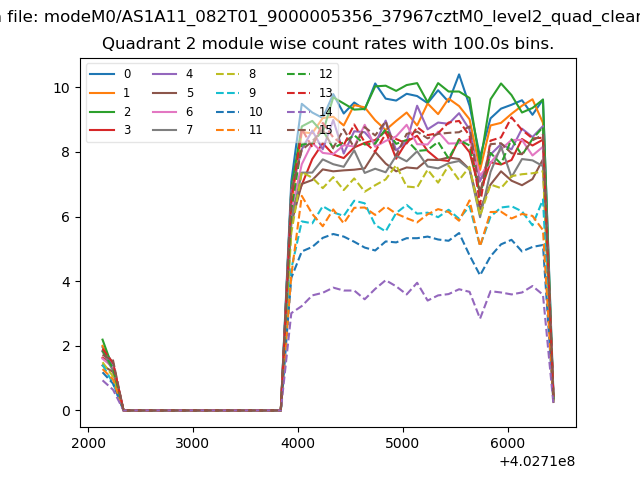
| Module-wise count rates for Quadrant B Data is divided into 100 sec bins |
 |
 |
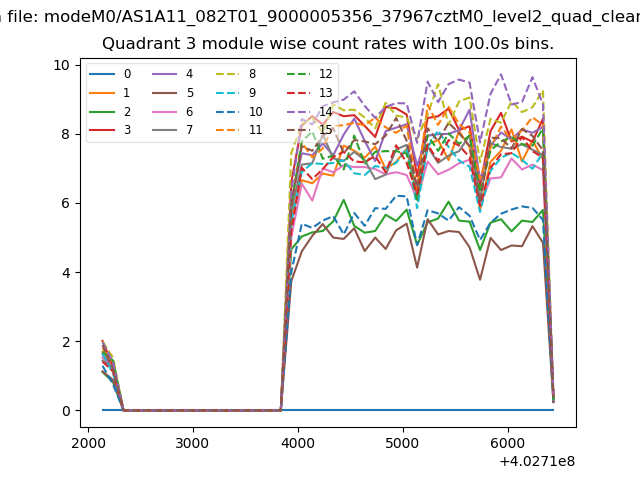
| Module-wise count rates for Quadrant C Data is divided into 100 sec bins |
 |
 |
| Module-wise count rates for Quadrant D Data is divided into 100 sec bins |
 |
 |
| Parameter | Plot |
|---|---|
| CZT HV Monitor | 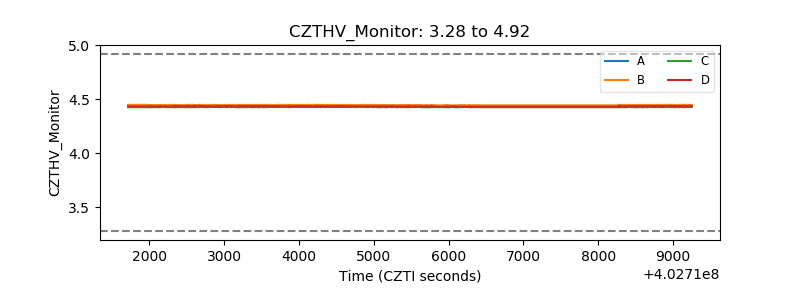 |
| D_VDD | 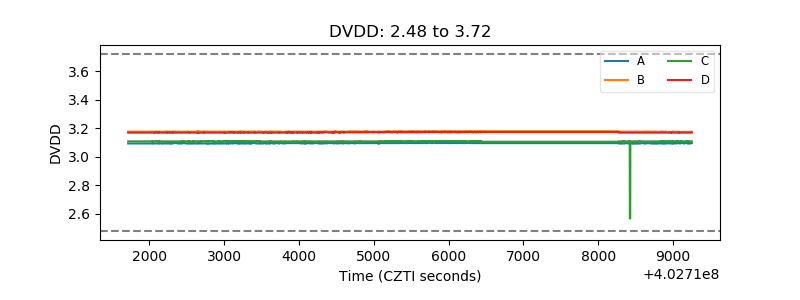 |
| Temperature 1 | 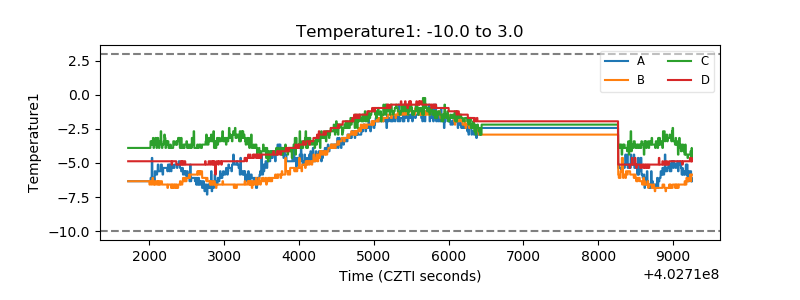 |
| Veto HV Monitor |  |
| Veto LLD | 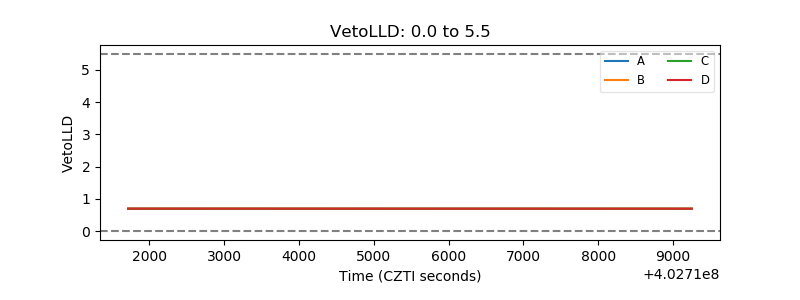 |
| Alpha Counter | 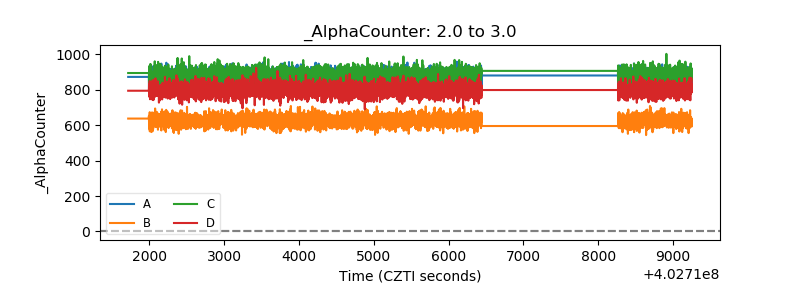 |
| _CPM_Rate | 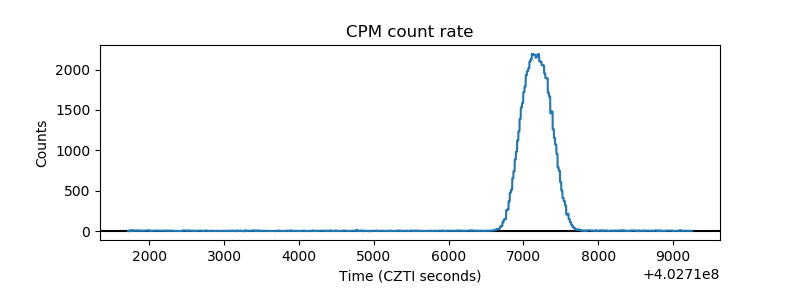 |
| CZT Counter | 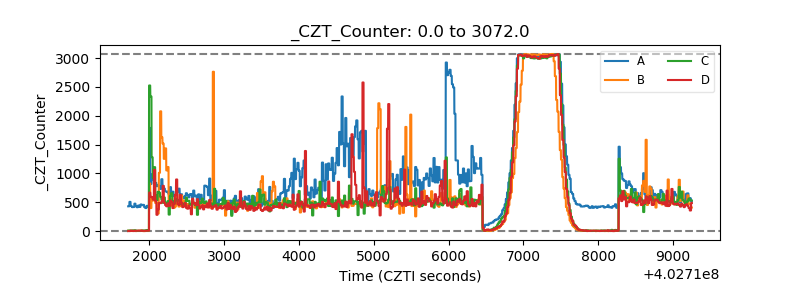 |
| +2.5 Volts monitor | 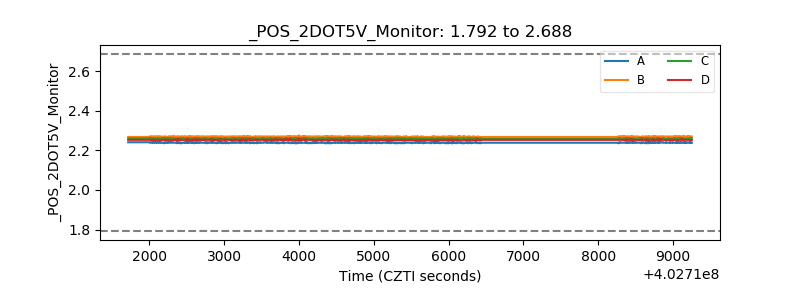 |
| +5 Volts monitor | 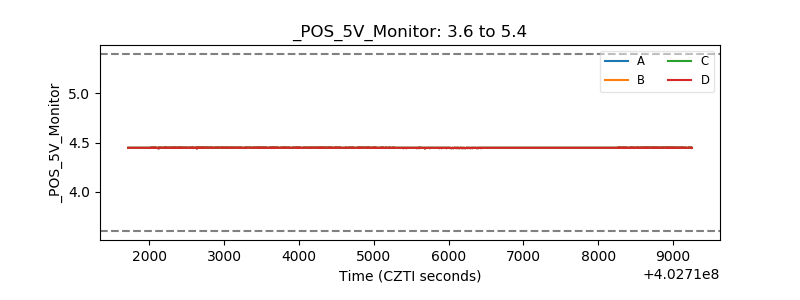 |
| _ROLL_ROT | 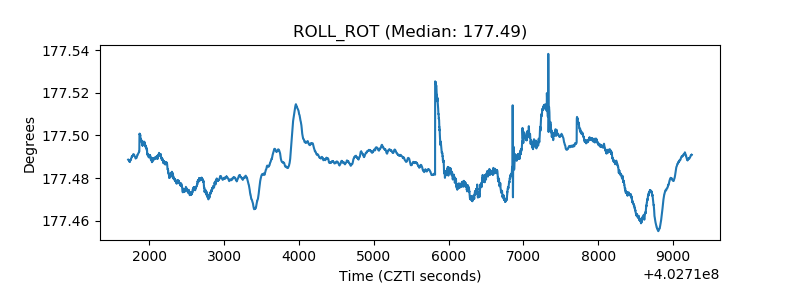 |
| _Roll_DEC | 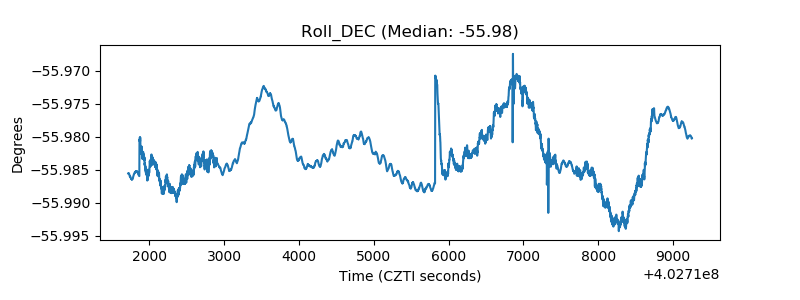 |
| _Roll_RA | 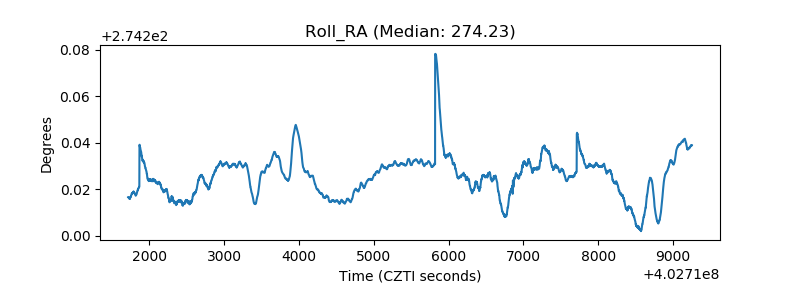 |
| Veto Counter | 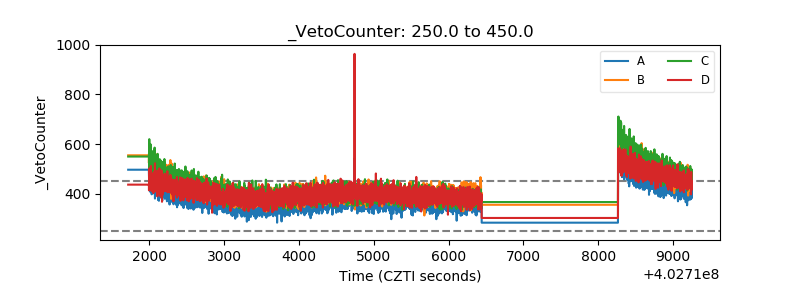 |