| Param | Original file | Final file |
|---|---|---|
| Filename | modeM0/AS1A11_082T01_9000005356_37968cztM0_level2.evt | modeM0/AS1A11_082T01_9000005356_37968cztM0_level2_quad_clean.evt |
| Size (bytes) | 415,091,520 | 55,785,600 |
| Size | 395.9 MB | 53.2 MB |
| Events in quadrant A | 3,692,512 | 334,722 |
| Events in quadrant B | 3,081,846 | 339,691 |
| Events in quadrant C | 2,814,134 | 342,605 |
| Events in quadrant D | 2,632,241 | 310,762 |
| Mode M0 | |||
|---|---|---|---|
| Quadrant | BADHDUFLAG | Total packets | Discarded packets |
| A | 0 | 14724 | 3 |
| B | 0 | 12261 | 2 |
| C | 0 | 11223 | 2 |
| D | 0 | 11007 | 2 |
| Mode SS | |||
|---|---|---|---|
| Quadrant | BADHDUFLAG | Total packets | Discarded packets |
| A | 0 | 104 | 0 |
| B | 0 | 104 | 0 |
| C | 0 | 104 | 0 |
| D | 0 | 104 | 0 |
| Mode M9 | |||
|---|---|---|---|
| Quadrant | BADHDUFLAG | Total packets | Discarded packets |
| A | 0 | 20 | 0 |
| B | 0 | 20 | 0 |
| C | 0 | 20 | 0 |
| D | 0 | 21 | 0 |
| Quadrant | Total seconds | Saturated seconds | Saturation percentage |
|---|---|---|---|
| A | 5162 | 24 | 0.464936% |
| B | 5162 | 106 | 2.053468% |
| C | 5162 | 33 | 0.639287% |
| D | 5162 | 18 | 0.348702% |
Noise dominated data is calculated using 1-second bins in cleaned event files. If a bin has >2000 counts, and if more than 50% of those come from <1% of pixels, then it is considered to be noise-dominated and hence unusable.
| Quadrant | # 1 sec bins | Bins with >0 counts | Bins with >2000 counts | High rate bins dominated by noise | Noise dominated (total time) | Noise dominated (detector-on time) | Marked lightcurve |
|---|---|---|---|---|---|---|---|
| A | 7134 | 5163 | 4 | 4 | 0.06% | 0.08% | 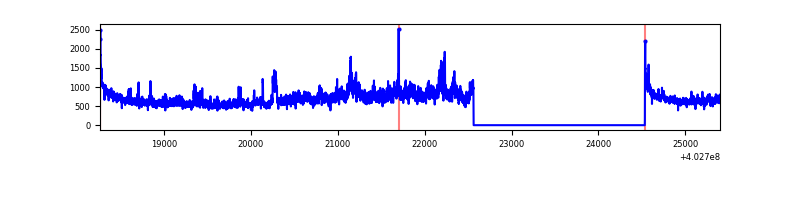 |
| B | 7134 | 5163 | 69 | 69 | 0.97% | 1.34% | 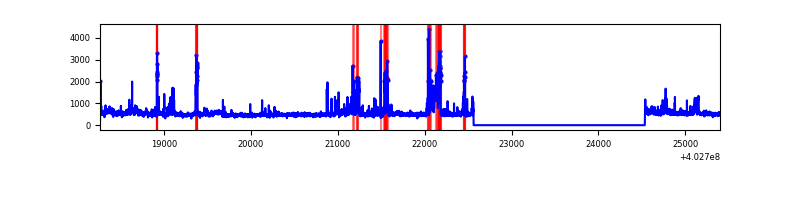 |
| C | 7134 | 5163 | 17 | 17 | 0.24% | 0.33% | 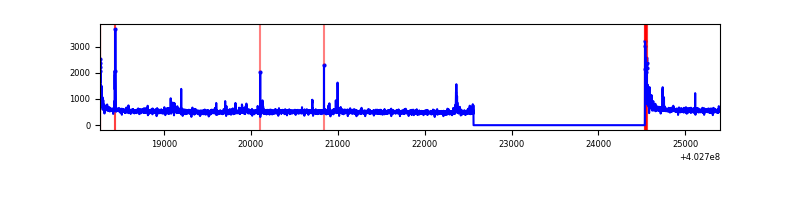 |
| D | 7134 | 5163 | 9 | 9 | 0.13% | 0.17% | 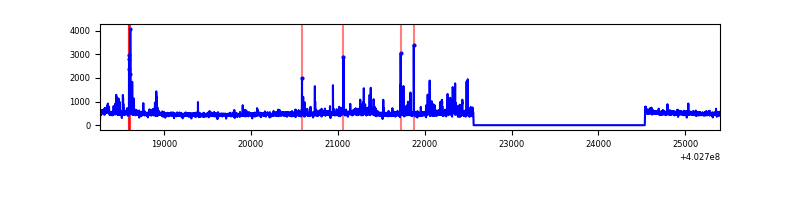 |
Top three noisy pixels from each quadrant. If the there are fewer than three noisy pixels in the level2.evt file, extra rows are filled as -1
| Pixel properties | Quadrant properties | ||||||
|---|---|---|---|---|---|---|---|
| Quadrant | DetID | PixID | Counts | Sigma | Mean | Median | Sigma |
| A | 15 | 222 | 830717 | 6693.31 | 628 | 615 | 124.0 |
| A | 10 | 83 | 351917 | 2832.63 | 628 | 615 | 124.0 |
| A | 15 | 235 | 52673 | 419.75 | 628 | 615 | 124.0 |
| B | 5 | 172 | 285013 | 2430.57 | 628 | 613 | 117.0 |
| B | 5 | 184 | 128236 | 1090.7 | 628 | 613 | 117.0 |
| B | 5 | 200 | 54034 | 456.55 | 628 | 613 | 117.0 |
| C | 15 | 214 | 221929 | 1547.89 | 625 | 630 | 143.0 |
| C | 0 | 10 | 86808 | 602.78 | 625 | 630 | 143.0 |
| C | 14 | 254 | 63351 | 438.71 | 625 | 630 | 143.0 |
| D | 2 | 250 | 42662 | 283.09 | 621 | 606 | 148.6 |
| D | 13 | 249 | 41729 | 276.81 | 621 | 606 | 148.6 |
| D | 1 | 52 | 39118 | 259.23 | 621 | 606 | 148.6 |
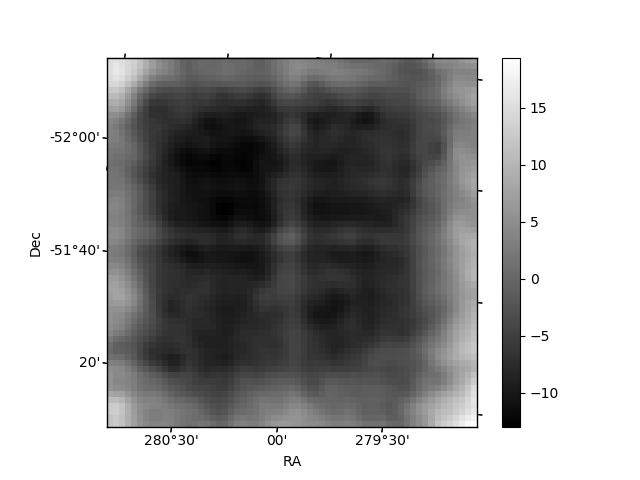
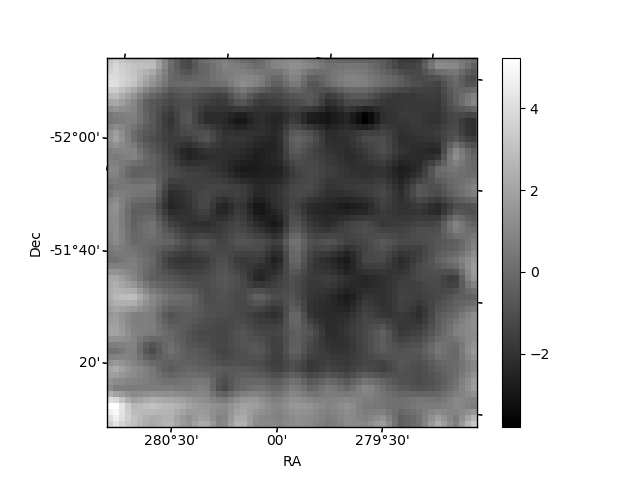
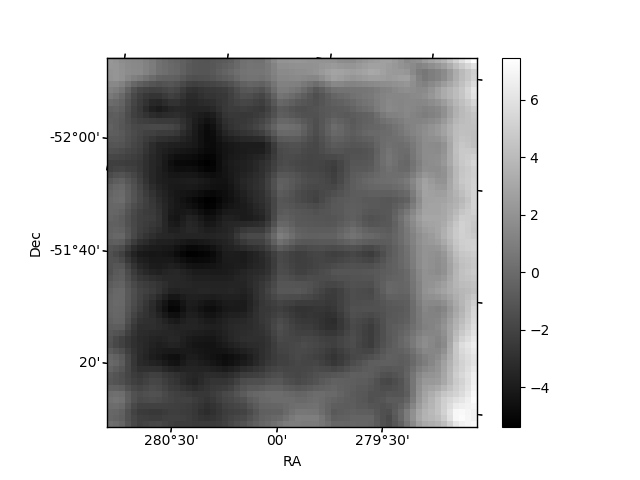
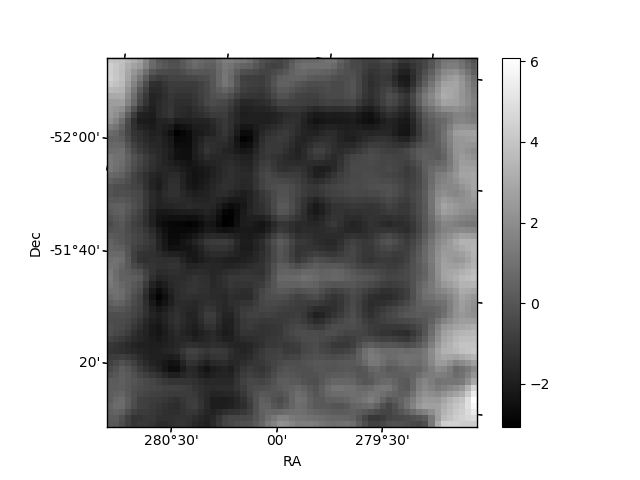
Histogram calculated using DETX and DETY for each event in the final _common_clean file
| Quadrant A | 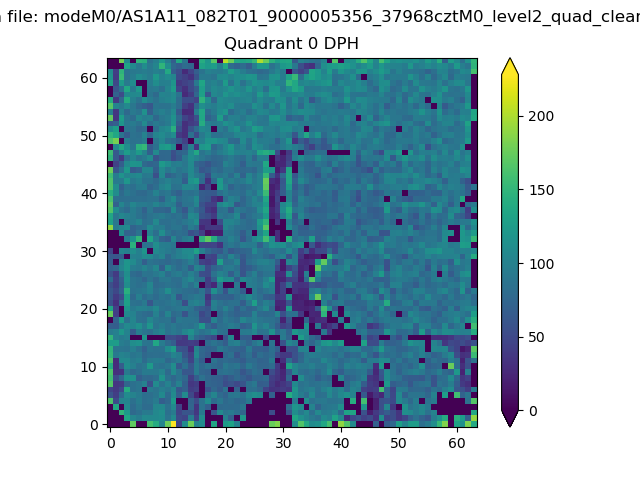 |
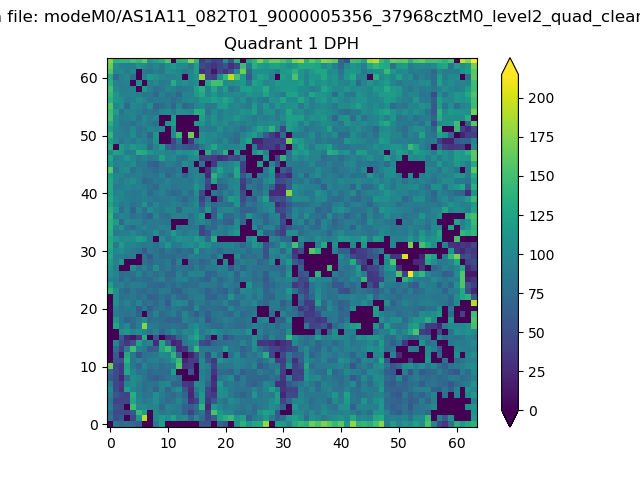 |
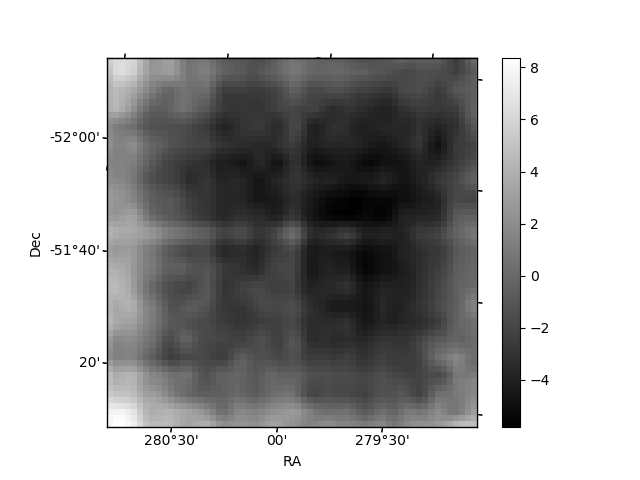
Quadrant B |
|---|---|---|---|
| Quadrant D | 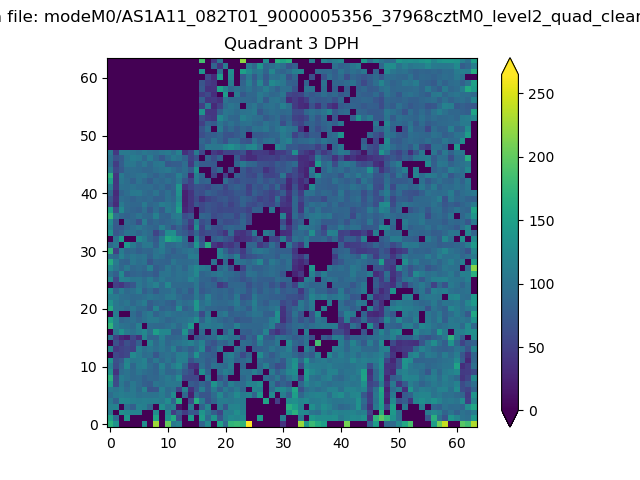 |
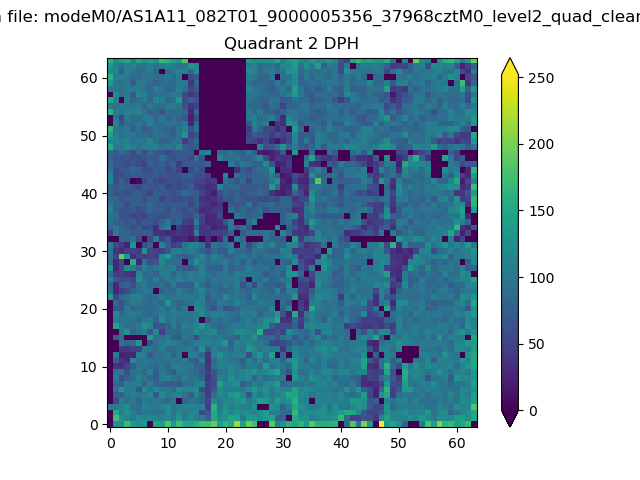 |
Quadrant C |
| Plot type | Count rate plots | Images |
|---|---|---|
| Comparison with Poisson distribution Blue bars denote a histogram of data divided into 1 sec bins. Red curve is a Poisson curve with rate = median count rate of data. |
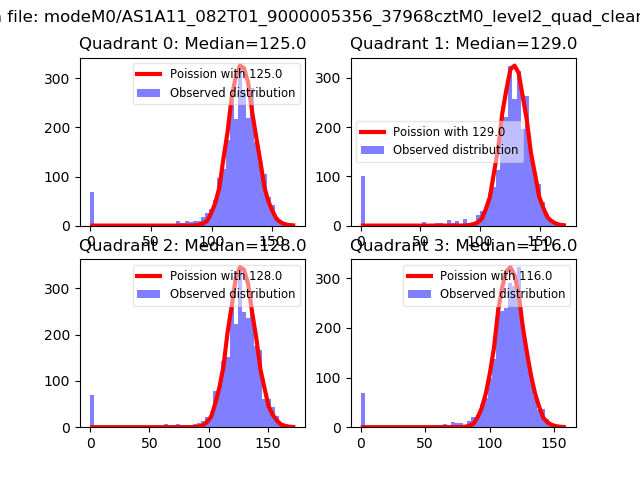 |
 |
| Quadrant-wise count rates Data is divided into 100 sec bins |
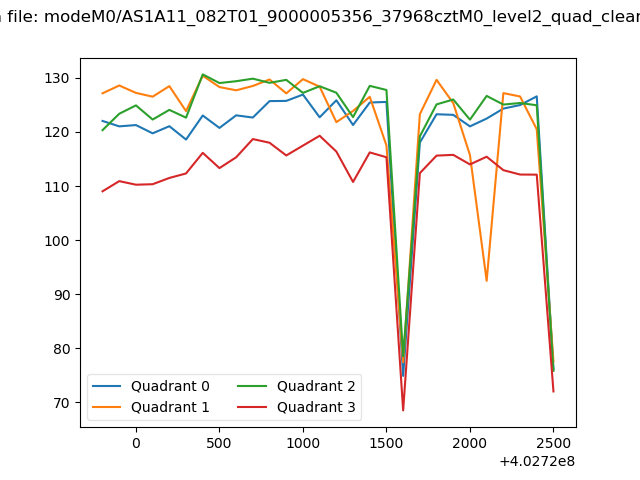 |
|
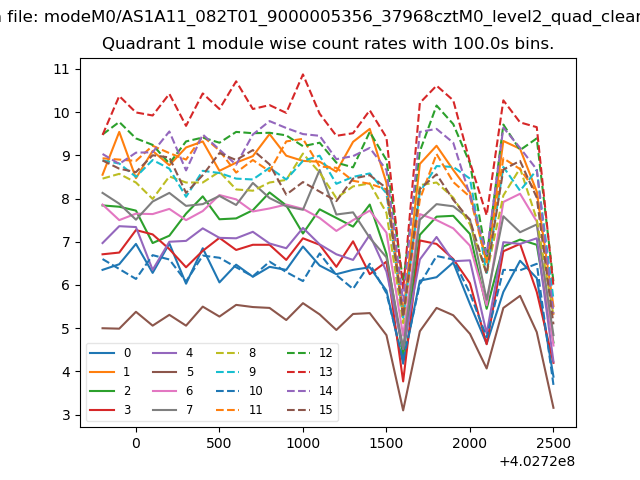
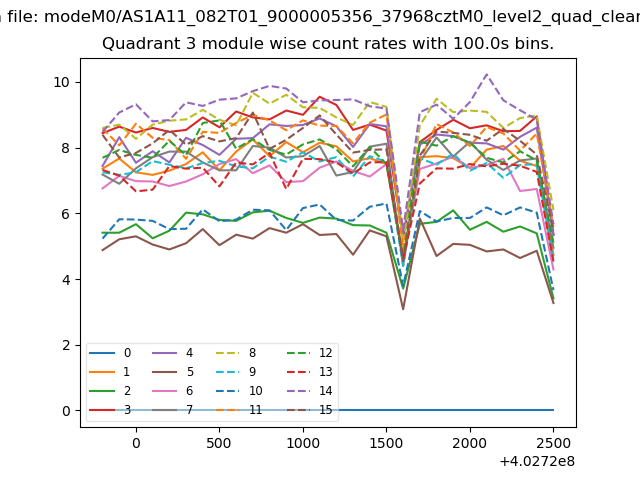
| Module-wise count rates for Quadrant A Data is divided into 100 sec bins |
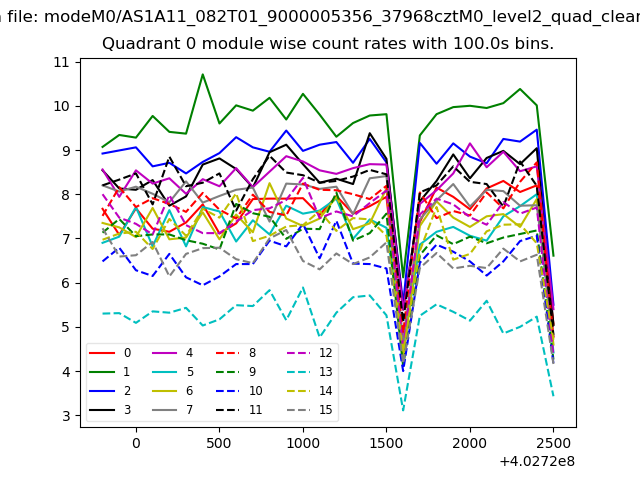 |
 |
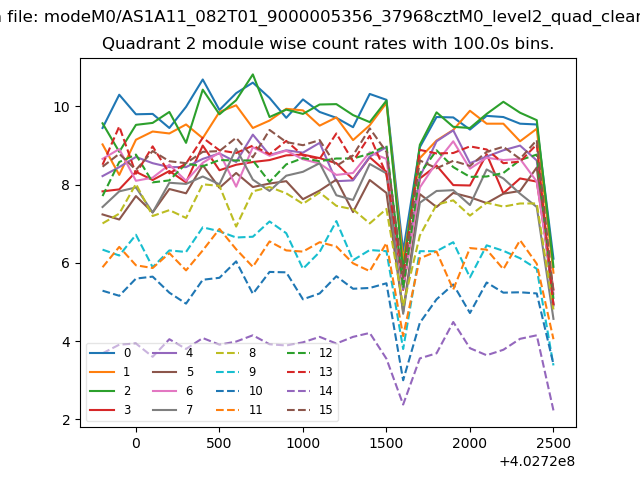
| Module-wise count rates for Quadrant B Data is divided into 100 sec bins |
 |
 |
| Module-wise count rates for Quadrant C Data is divided into 100 sec bins |
 |
 |
| Module-wise count rates for Quadrant D Data is divided into 100 sec bins |
 |
 |
| Parameter | Plot |
|---|---|
| CZT HV Monitor | 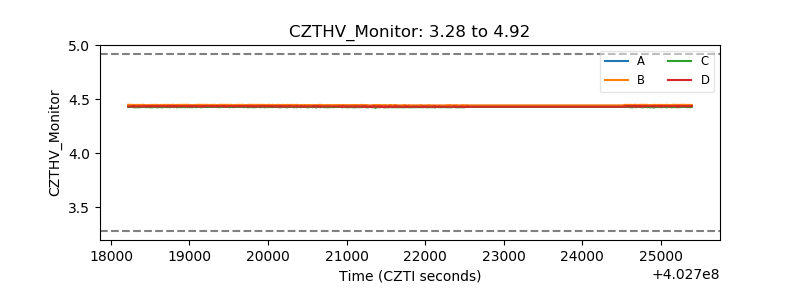 |
| D_VDD | 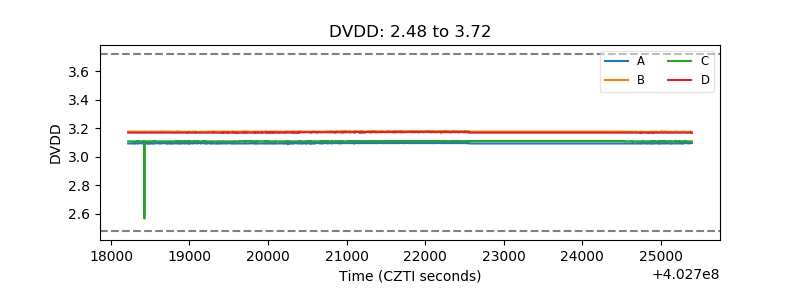 |
| Temperature 1 | 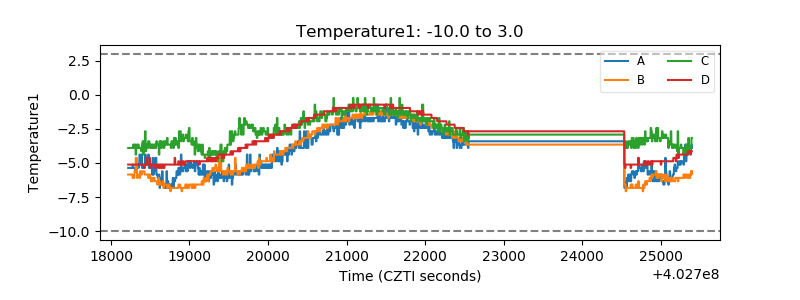 |
| Veto HV Monitor | 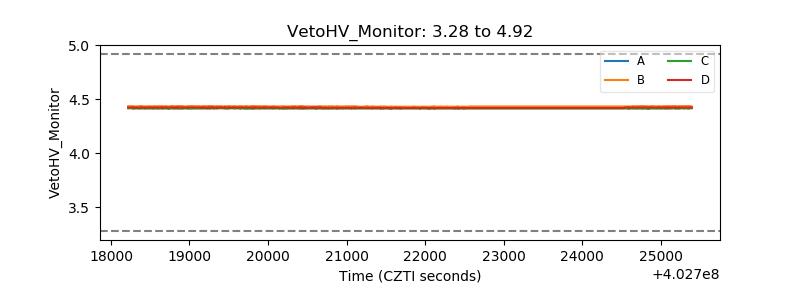 |
| Veto LLD | 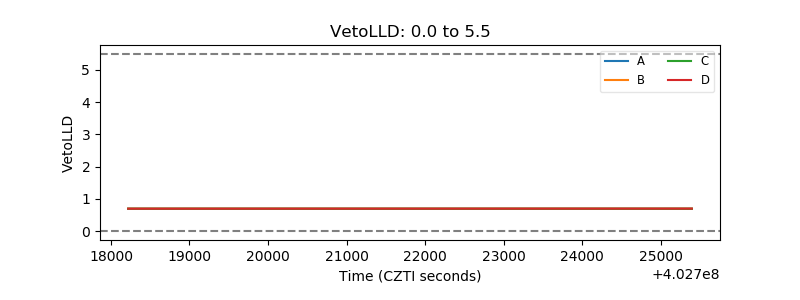 |
| Alpha Counter | 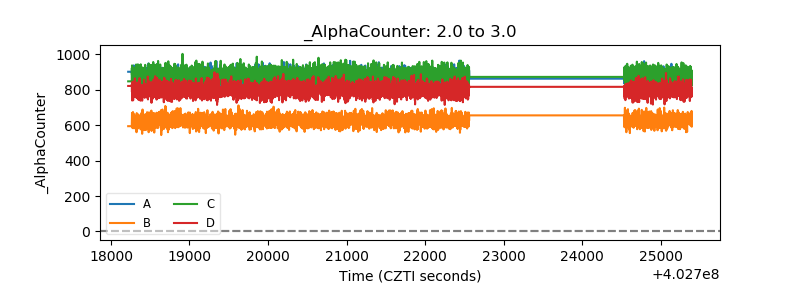 |
| _CPM_Rate | 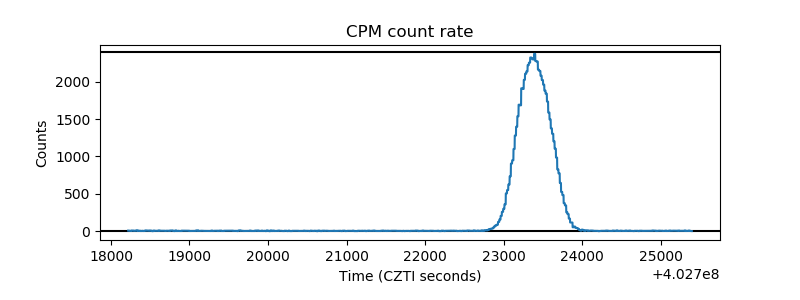 |
| CZT Counter | 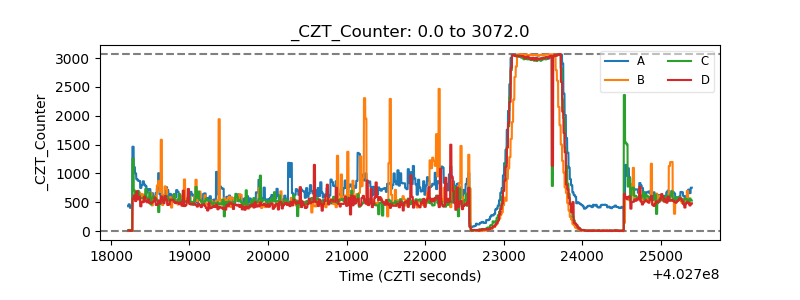 |
| +2.5 Volts monitor | 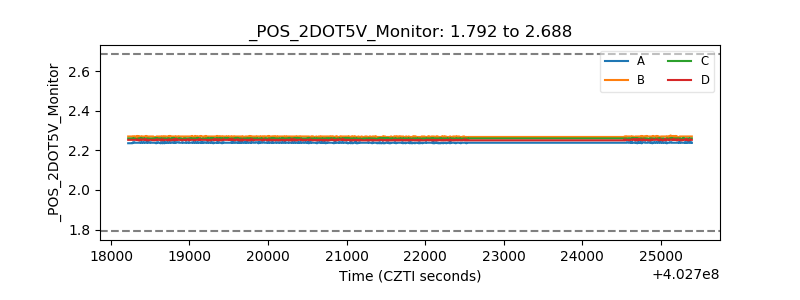 |
| +5 Volts monitor | 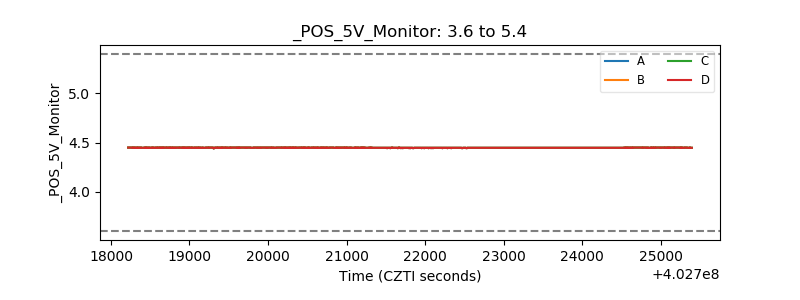 |
| _ROLL_ROT | 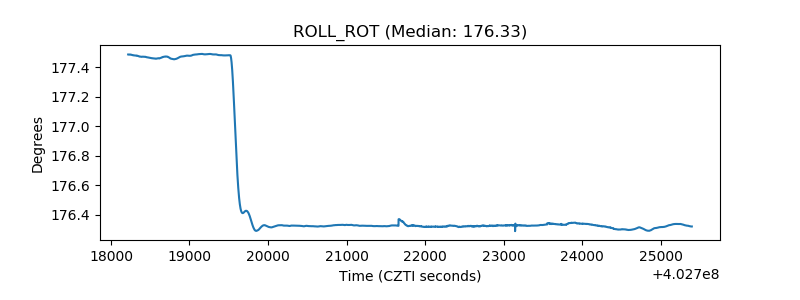 |
| _Roll_DEC | 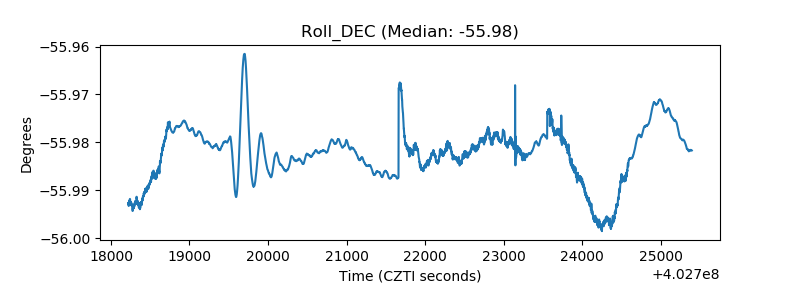 |
| _Roll_RA | 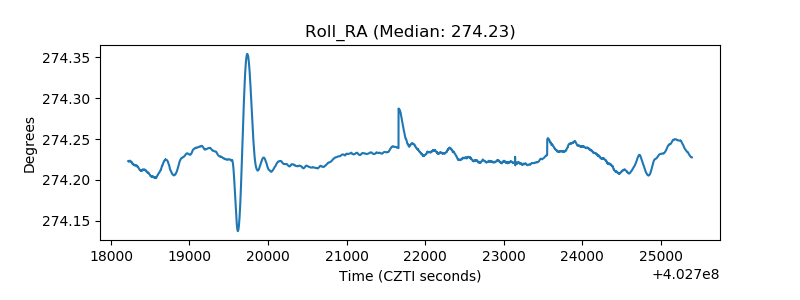 |
| Veto Counter | 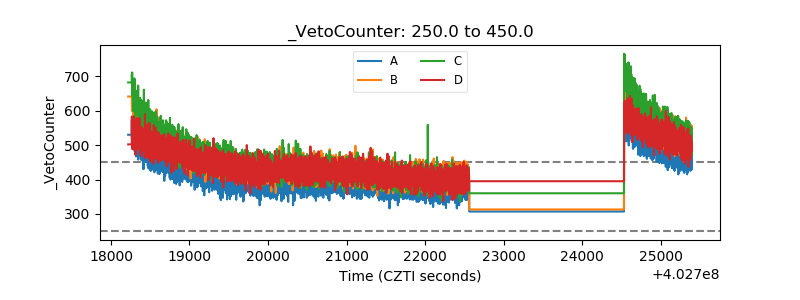 |