| Param | Original file | Final file |
|---|---|---|
| Filename | modeM0/AS1A11_082T01_9000005356_37969cztM0_level2.evt | modeM0/AS1A11_082T01_9000005356_37969cztM0_level2_quad_clean.evt |
| Size (bytes) | 468,152,640 | 68,212,800 |
| Size | 446.5 MB | 65.1 MB |
| Events in quadrant A | 3,707,894 | 434,317 |
| Events in quadrant B | 2,847,879 | 447,201 |
| Events in quadrant C | 2,780,586 | 461,454 |
| Events in quadrant D | 4,502,714 | 371,559 |
| Mode M0 | |||
|---|---|---|---|
| Quadrant | BADHDUFLAG | Total packets | Discarded packets |
| A | 0 | 15008 | 3 |
| B | 0 | 11339 | 2 |
| C | 0 | 11086 | 2 |
| D | 0 | 16367 | 2 |
| Mode SS | |||
|---|---|---|---|
| Quadrant | BADHDUFLAG | Total packets | Discarded packets |
| A | 0 | 102 | 0 |
| B | 0 | 102 | 0 |
| C | 0 | 102 | 0 |
| D | 0 | 102 | 0 |
| Mode M9 | |||
|---|---|---|---|
| Quadrant | BADHDUFLAG | Total packets | Discarded packets |
| A | 0 | 34 | 0 |
| B | 0 | 34 | 0 |
| C | 0 | 34 | 0 |
| D | 0 | 35 | 0 |
| Quadrant | Total seconds | Saturated seconds | Saturation percentage |
|---|---|---|---|
| A | 4998 | 22 | 0.440176% |
| B | 4998 | 69 | 1.380552% |
| C | 4998 | 39 | 0.780312% |
| D | 4998 | 715 | 14.305722% |
Noise dominated data is calculated using 1-second bins in cleaned event files. If a bin has >2000 counts, and if more than 50% of those come from <1% of pixels, then it is considered to be noise-dominated and hence unusable.
| Quadrant | # 1 sec bins | Bins with >0 counts | Bins with >2000 counts | High rate bins dominated by noise | Noise dominated (total time) | Noise dominated (detector-on time) | Marked lightcurve |
|---|---|---|---|---|---|---|---|
| A | 7060 | 4999 | 5 | 5 | 0.07% | 0.10% | 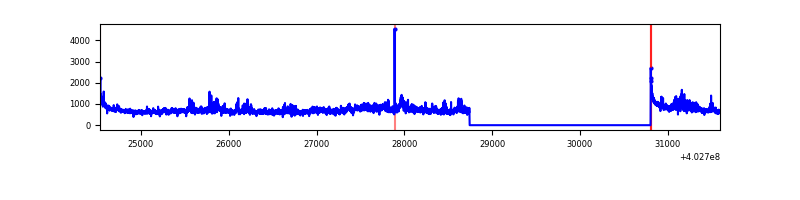 |
| B | 7060 | 4999 | 49 | 49 | 0.69% | 0.98% | 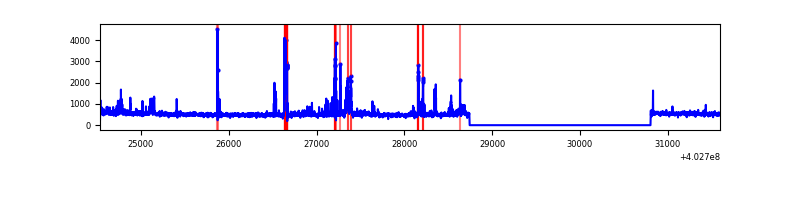 |
| C | 7060 | 4999 | 16 | 16 | 0.23% | 0.32% | 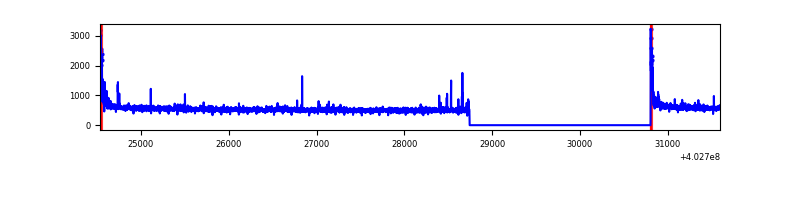 |
| D | 7060 | 4998 | 626 | 626 | 8.87% | 12.53% | 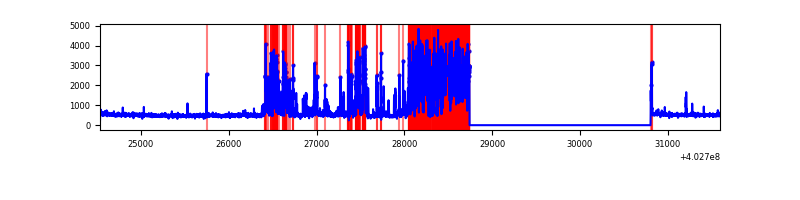 |
Top three noisy pixels from each quadrant. If the there are fewer than three noisy pixels in the level2.evt file, extra rows are filled as -1
| Pixel properties | Quadrant properties | ||||||
|---|---|---|---|---|---|---|---|
| Quadrant | DetID | PixID | Counts | Sigma | Mean | Median | Sigma |
| A | 15 | 222 | 893100 | 7156.52 | 628 | 618 | 124.7 |
| A | 10 | 83 | 356458 | 2853.36 | 628 | 618 | 124.7 |
| A | 13 | 6 | 10376 | 78.25 | 628 | 618 | 124.7 |
| B | 5 | 172 | 188888 | 1629.19 | 623 | 607 | 115.6 |
| B | 5 | 184 | 93574 | 804.44 | 623 | 607 | 115.6 |
| B | 0 | 229 | 37371 | 318.12 | 623 | 607 | 115.6 |
| C | 15 | 214 | 215141 | 1522.63 | 621 | 627 | 140.9 |
| C | 0 | 10 | 107733 | 760.24 | 621 | 627 | 140.9 |
| C | 14 | 254 | 27506 | 190.79 | 621 | 627 | 140.9 |
| D | 12 | 227 | 1990273 | 14330.52 | 578 | 564 | 138.8 |
| D | 13 | 249 | 130109 | 933.02 | 578 | 564 | 138.8 |
| D | 10 | 199 | 72549 | 518.46 | 578 | 564 | 138.8 |
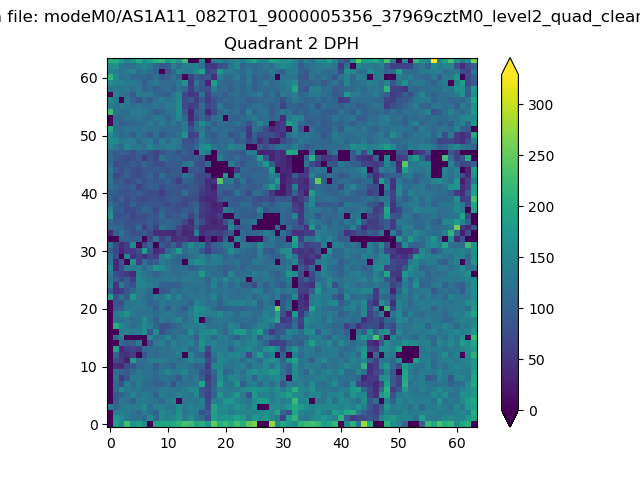
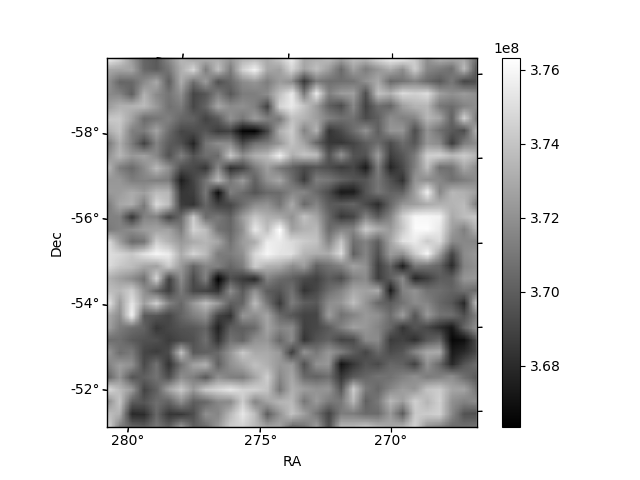
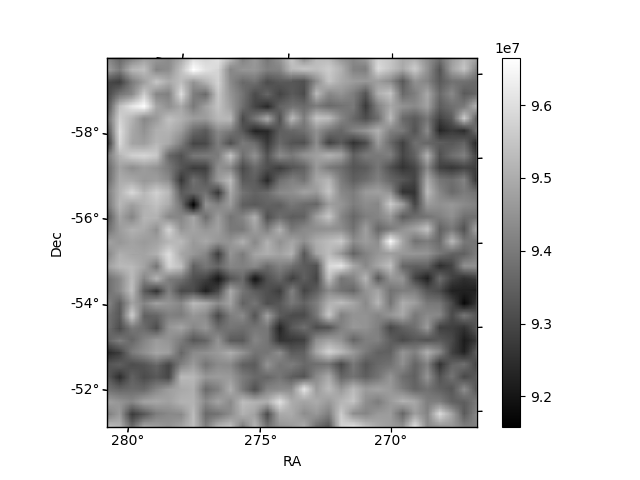
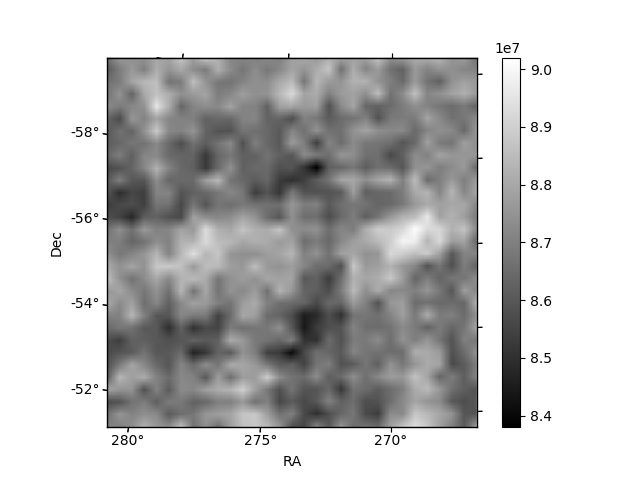
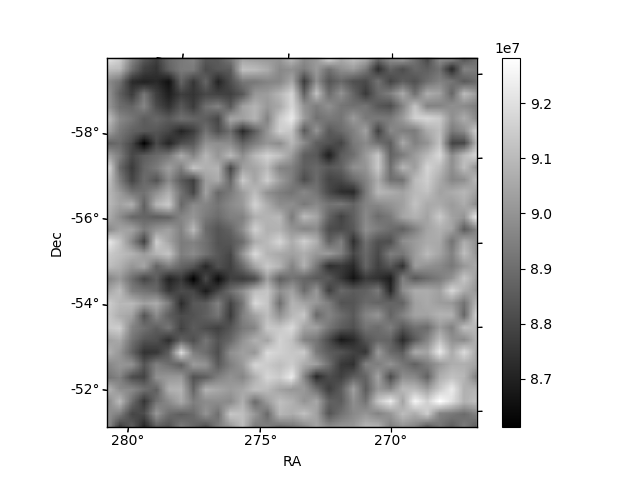
Histogram calculated using DETX and DETY for each event in the final _common_clean file
| Quadrant A | 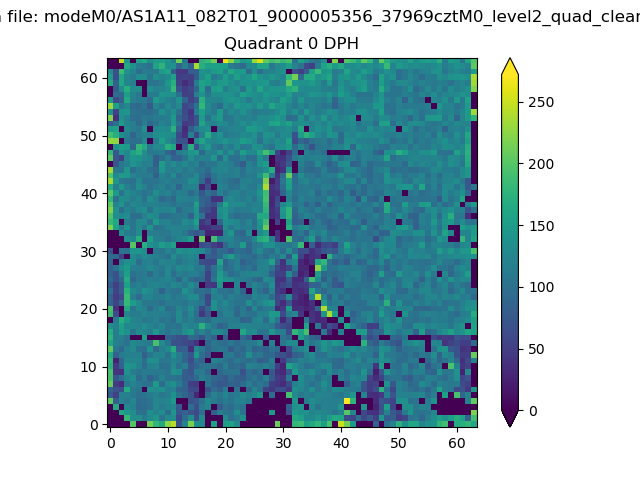 |
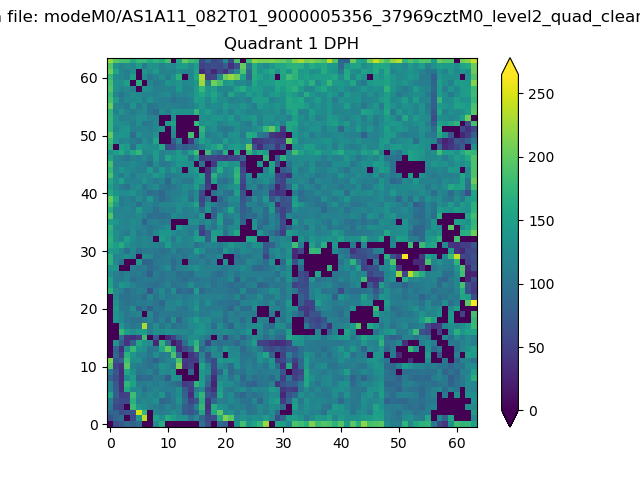 |
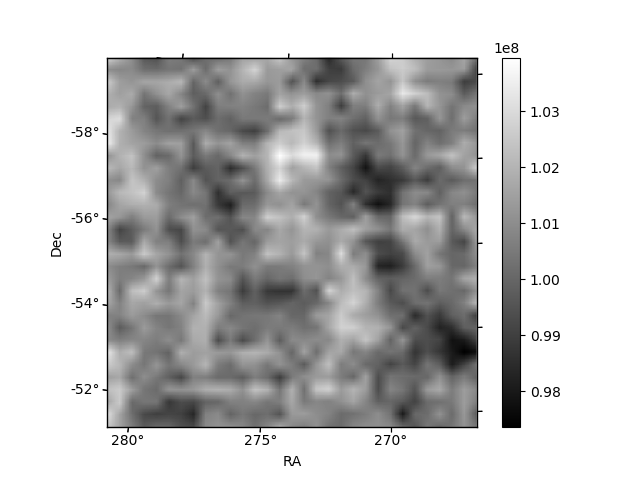
Quadrant B |
|---|---|---|---|
| Quadrant D | 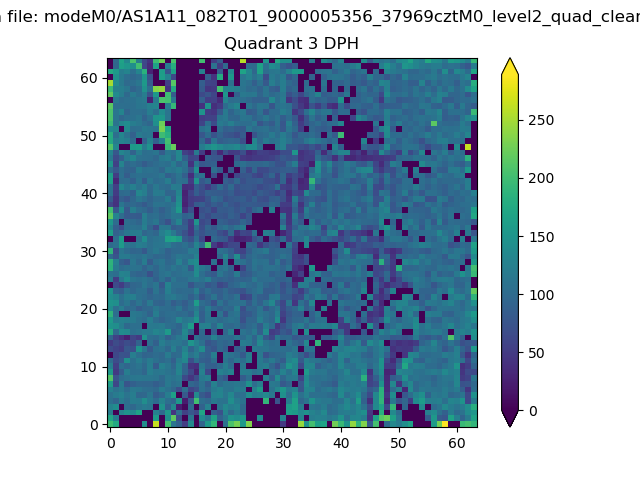 |
 |
Quadrant C |
| Plot type | Count rate plots | Images |
|---|---|---|
| Comparison with Poisson distribution Blue bars denote a histogram of data divided into 1 sec bins. Red curve is a Poisson curve with rate = median count rate of data. |
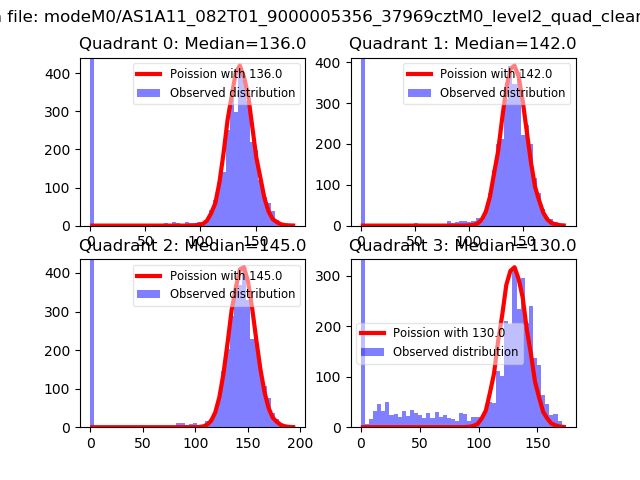 |
 |
| Quadrant-wise count rates Data is divided into 100 sec bins |
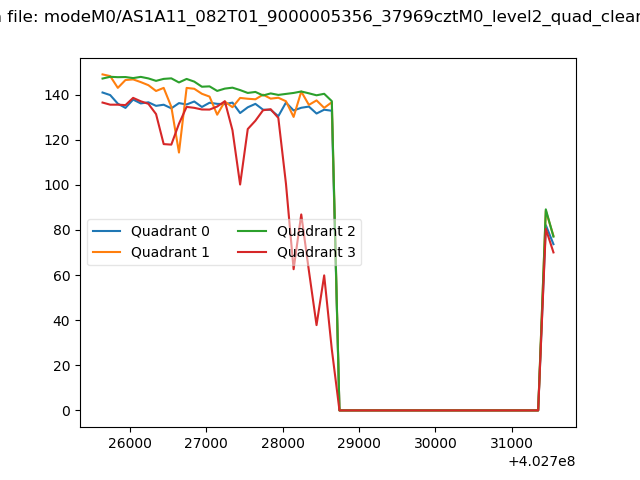 |
|
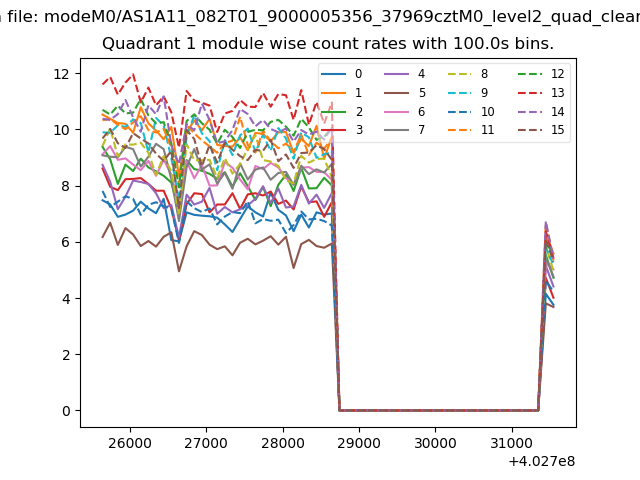
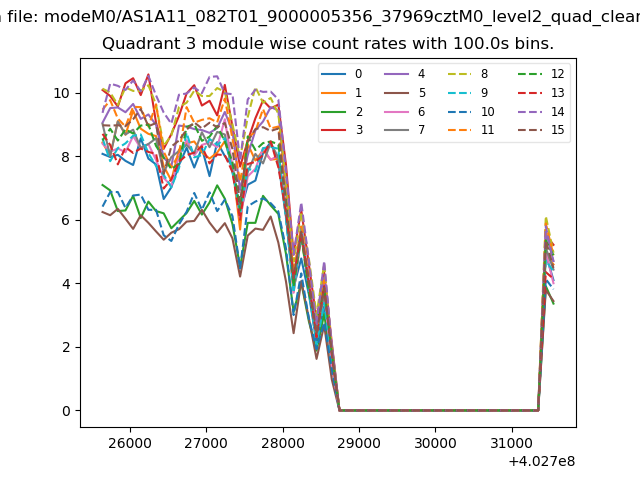
| Module-wise count rates for Quadrant A Data is divided into 100 sec bins |
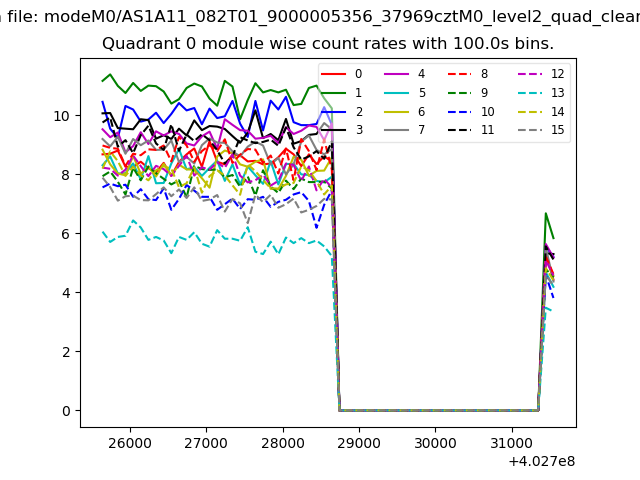 |
 |
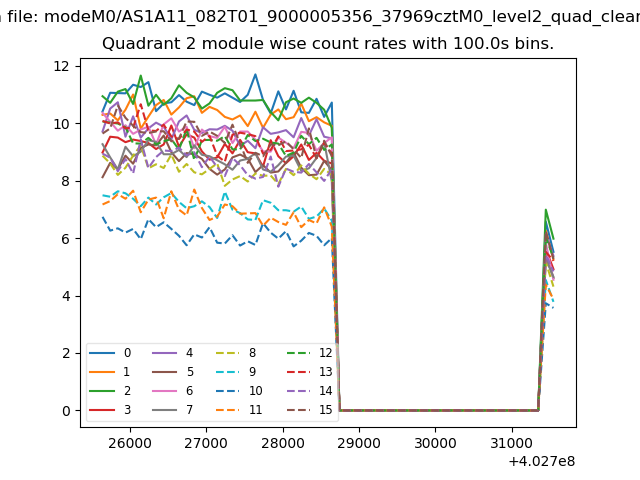
| Module-wise count rates for Quadrant B Data is divided into 100 sec bins |
 |
 |
| Module-wise count rates for Quadrant C Data is divided into 100 sec bins |
 |
 |
| Module-wise count rates for Quadrant D Data is divided into 100 sec bins |
 |
 |
| Parameter | Plot |
|---|---|
| CZT HV Monitor | 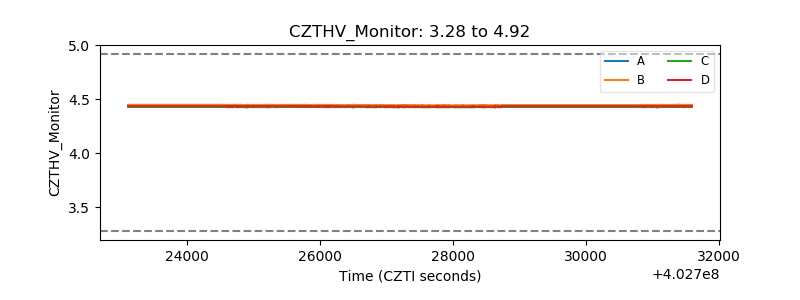 |
| D_VDD | 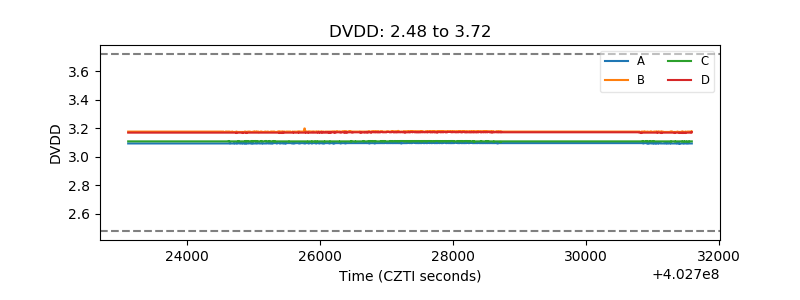 |
| Temperature 1 | 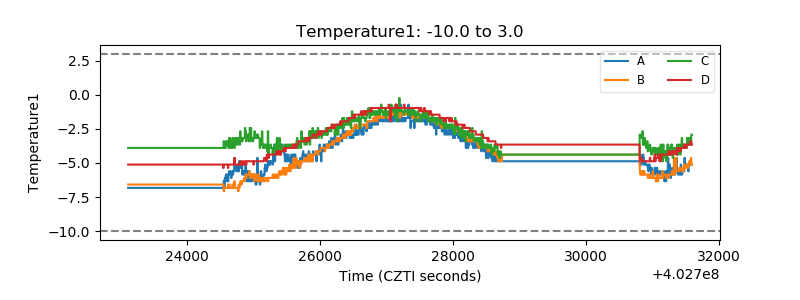 |
| Veto HV Monitor | 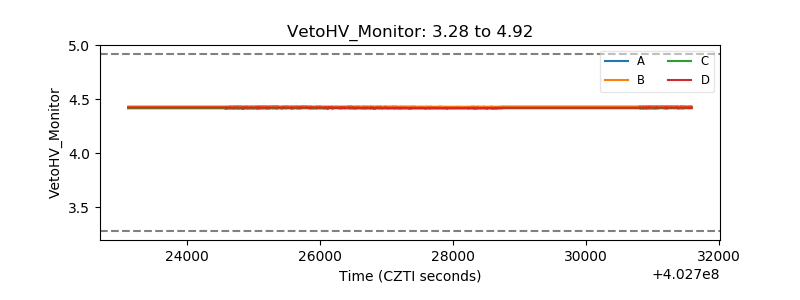 |
| Veto LLD | 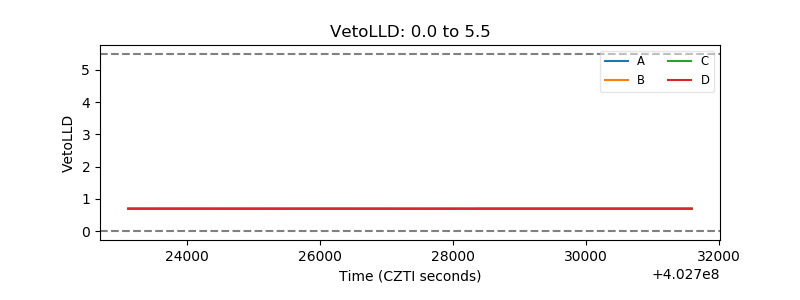 |
| Alpha Counter | 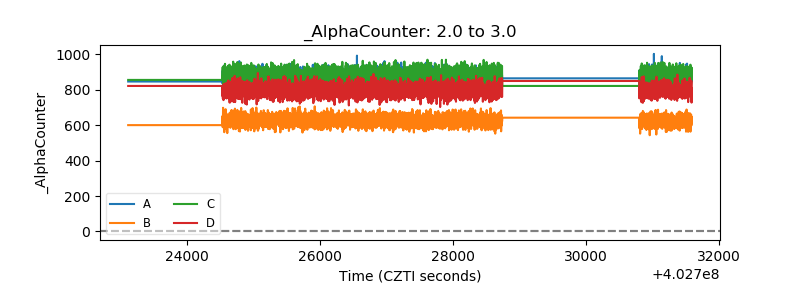 |
| _CPM_Rate | 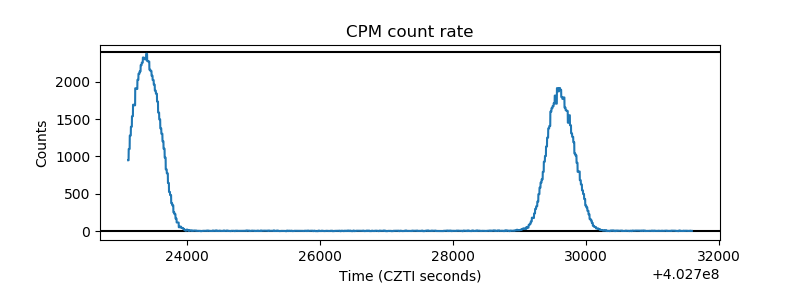 |
| CZT Counter | 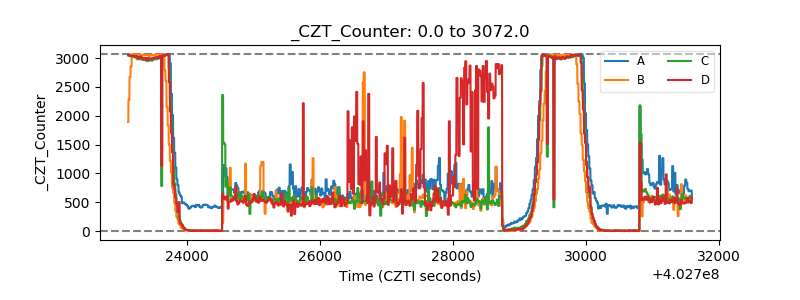 |
| +2.5 Volts monitor | 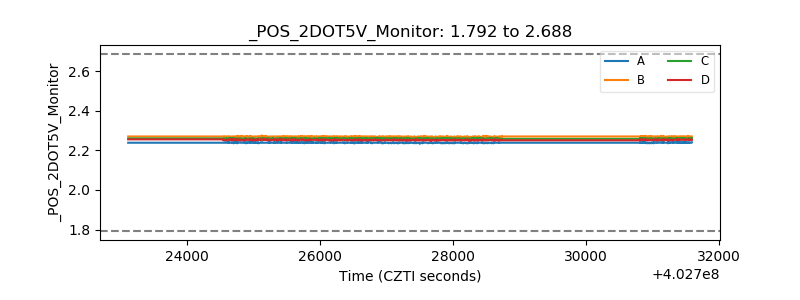 |
| +5 Volts monitor | 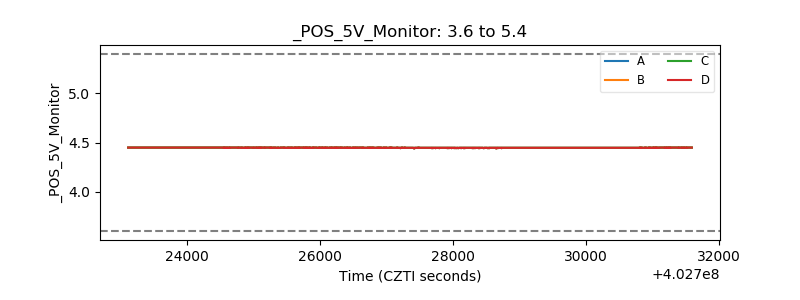 |
| _ROLL_ROT | 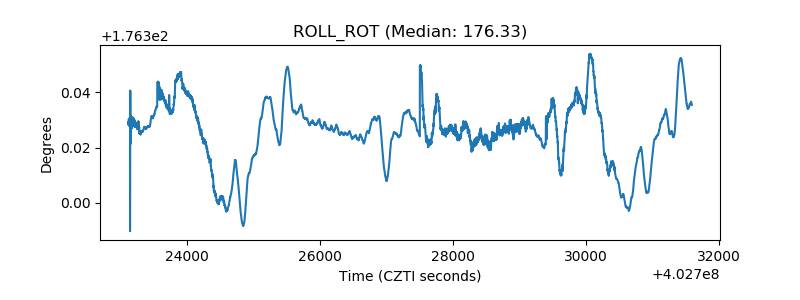 |
| _Roll_DEC | 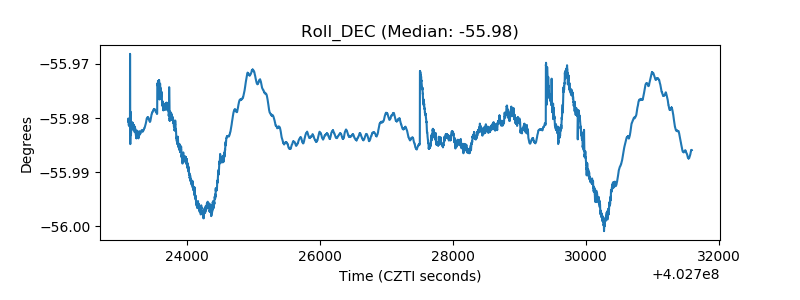 |
| _Roll_RA | 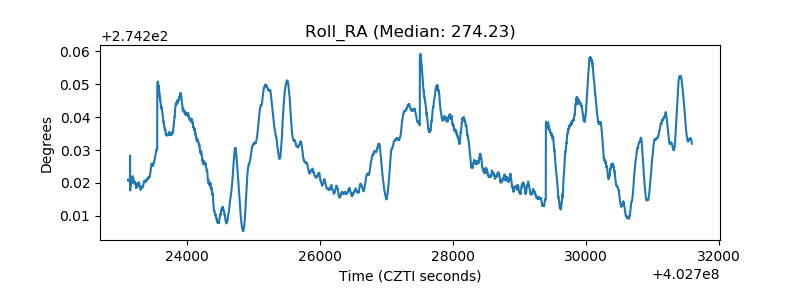 |
| Veto Counter | 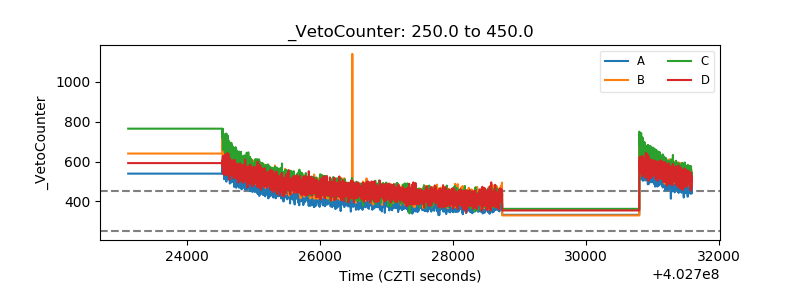 |