| Param | Original file | Final file |
|---|---|---|
| Filename | modeM0/AS1A11_082T01_9000005356_37970cztM0_level2.evt | modeM0/AS1A11_082T01_9000005356_37970cztM0_level2_quad_clean.evt |
| Size (bytes) | 406,284,480 | 85,161,600 |
| Size | 387.5 MB | 81.2 MB |
| Events in quadrant A | 3,912,135 | 547,470 |
| Events in quadrant B | 2,789,671 | 564,851 |
| Events in quadrant C | 2,752,114 | 576,984 |
| Events in quadrant D | 2,516,961 | 545,111 |
| Mode M0 | |||
|---|---|---|---|
| Quadrant | BADHDUFLAG | Total packets | Discarded packets |
| A | 0 | 15369 | 3 |
| B | 0 | 11087 | 2 |
| C | 0 | 11006 | 2 |
| D | 0 | 10396 | 2 |
| Mode SS | |||
|---|---|---|---|
| Quadrant | BADHDUFLAG | Total packets | Discarded packets |
| A | 0 | 102 | 0 |
| B | 0 | 102 | 0 |
| C | 0 | 102 | 0 |
| D | 0 | 102 | 0 |
| Mode M9 | |||
|---|---|---|---|
| Quadrant | BADHDUFLAG | Total packets | Discarded packets |
| A | 0 | 35 | 0 |
| B | 0 | 35 | 0 |
| C | 0 | 35 | 0 |
| D | 0 | 36 | 0 |
| Quadrant | Total seconds | Saturated seconds | Saturation percentage |
|---|---|---|---|
| A | 4905 | 35 | 0.713558% |
| B | 4905 | 88 | 1.794088% |
| C | 4905 | 39 | 0.795107% |
| D | 4905 | 21 | 0.428135% |
Noise dominated data is calculated using 1-second bins in cleaned event files. If a bin has >2000 counts, and if more than 50% of those come from <1% of pixels, then it is considered to be noise-dominated and hence unusable.
| Quadrant | # 1 sec bins | Bins with >0 counts | Bins with >2000 counts | High rate bins dominated by noise | Noise dominated (total time) | Noise dominated (detector-on time) | Marked lightcurve |
|---|---|---|---|---|---|---|---|
| A | 7026 | 4906 | 16 | 16 | 0.23% | 0.33% | 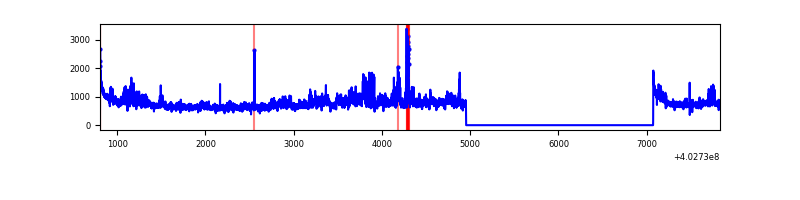 |
| B | 7026 | 4906 | 69 | 69 | 0.98% | 1.41% | 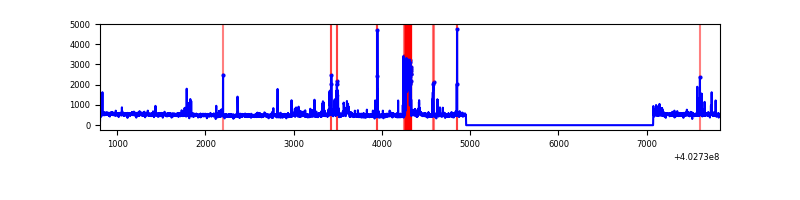 |
| C | 7026 | 4906 | 19 | 19 | 0.27% | 0.39% | 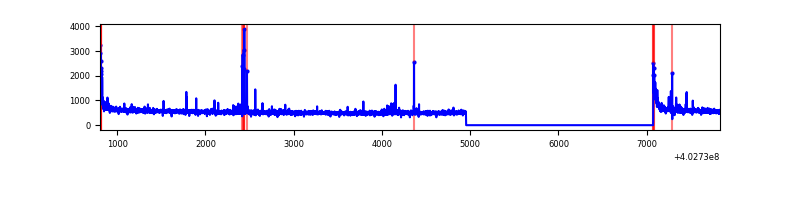 |
| D | 7026 | 4906 | 14 | 14 | 0.20% | 0.29% | 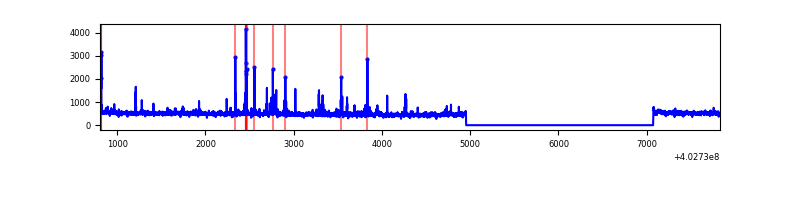 |
Top three noisy pixels from each quadrant. If the there are fewer than three noisy pixels in the level2.evt file, extra rows are filled as -1
| Pixel properties | Quadrant properties | ||||||
|---|---|---|---|---|---|---|---|
| Quadrant | DetID | PixID | Counts | Sigma | Mean | Median | Sigma |
| A | 15 | 222 | 1152420 | 9517.2 | 612 | 602 | 121.0 |
| A | 10 | 83 | 351000 | 2895.26 | 612 | 602 | 121.0 |
| A | 13 | 6 | 16718 | 133.16 | 612 | 602 | 121.0 |
| B | 5 | 200 | 170826 | 1480.49 | 605 | 590 | 115.0 |
| B | 0 | 229 | 116689 | 1009.68 | 605 | 590 | 115.0 |
| B | 5 | 172 | 40891 | 350.49 | 605 | 590 | 115.0 |
| C | 15 | 214 | 212072 | 1548.78 | 602 | 608 | 136.5 |
| C | 0 | 10 | 107452 | 782.53 | 602 | 608 | 136.5 |
| C | 14 | 254 | 69659 | 505.74 | 602 | 608 | 136.5 |
| D | 12 | 227 | 45133 | 307.5 | 602 | 587 | 144.9 |
| D | 13 | 249 | 44091 | 300.31 | 602 | 587 | 144.9 |
| D | 1 | 52 | 34519 | 234.23 | 602 | 587 | 144.9 |
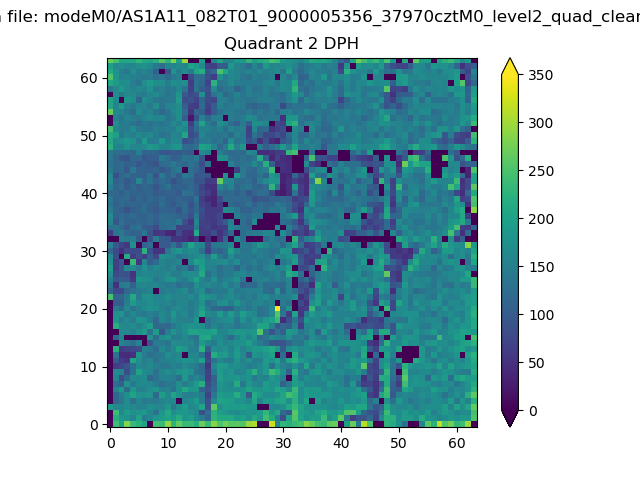
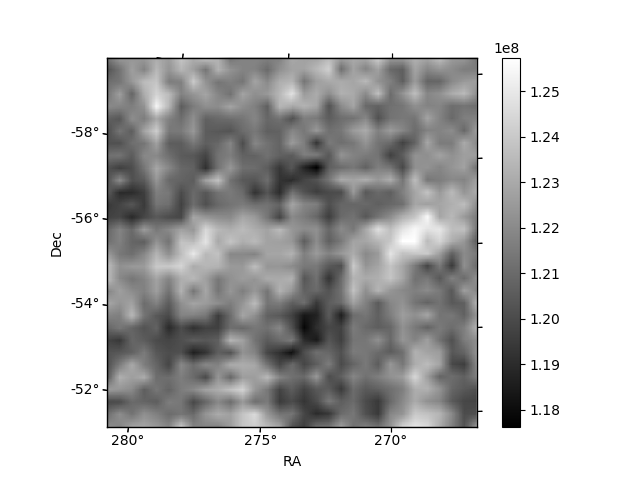
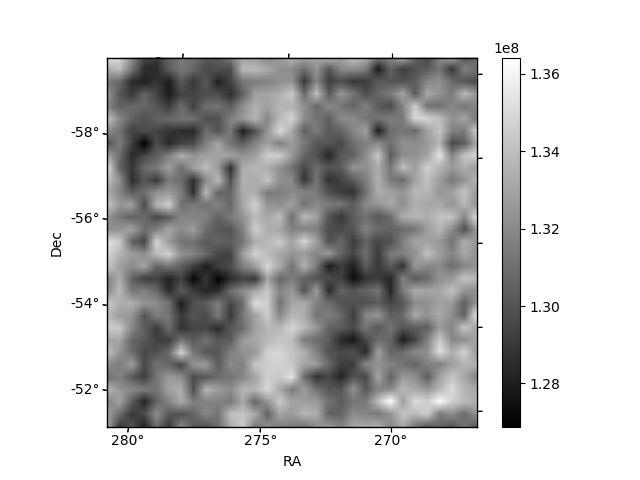
Histogram calculated using DETX and DETY for each event in the final _common_clean file
| Quadrant A | 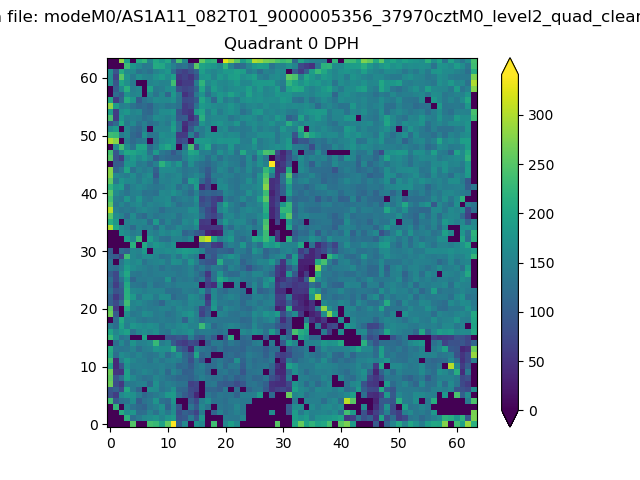 |
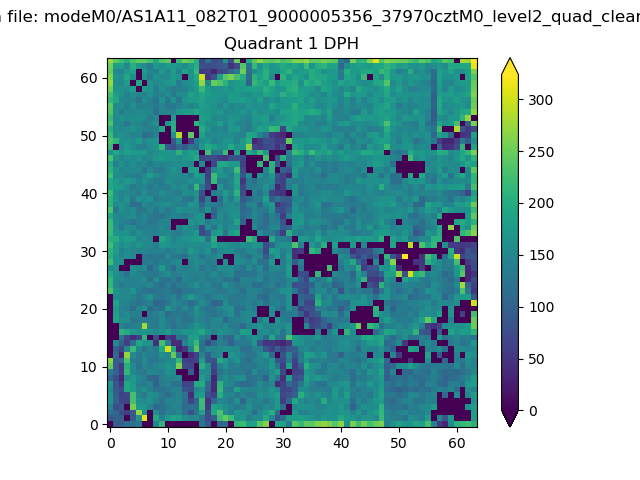 |
Quadrant B |
|---|---|---|---|
| Quadrant D | 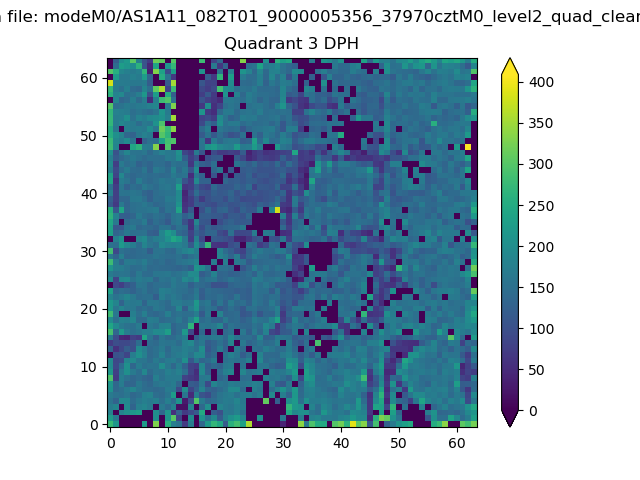 |
 |
Quadrant C |
| Plot type | Count rate plots | Images |
|---|---|---|
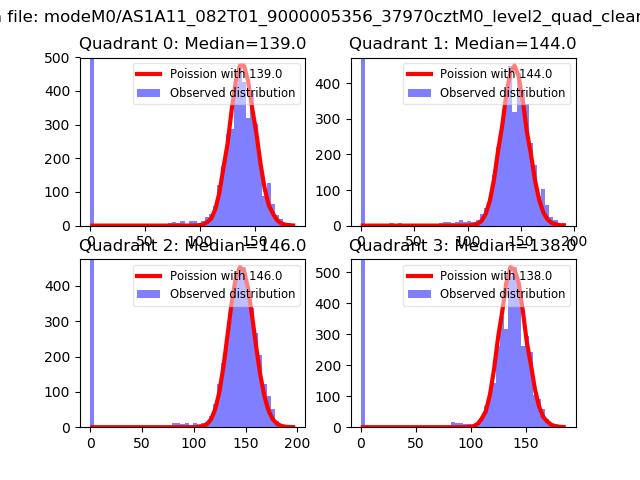
| Comparison with Poisson distribution Blue bars denote a histogram of data divided into 1 sec bins. Red curve is a Poisson curve with rate = median count rate of data. |
 |
 |
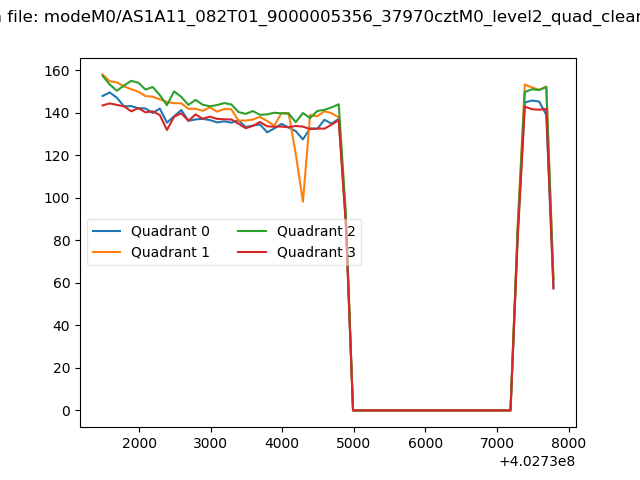
| Quadrant-wise count rates Data is divided into 100 sec bins |
 |
|
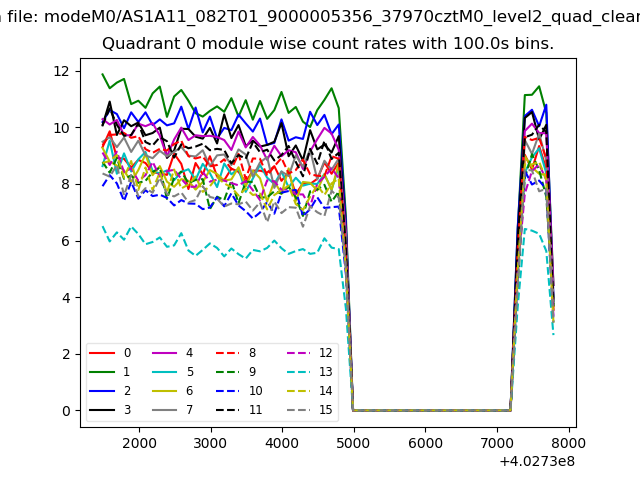
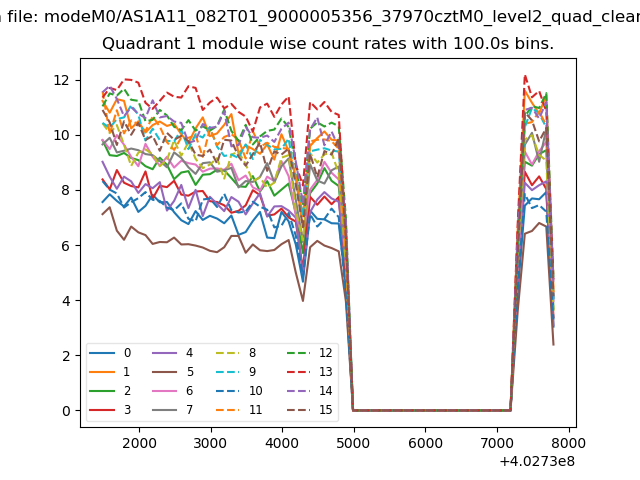
| Module-wise count rates for Quadrant A Data is divided into 100 sec bins |
 |
 |
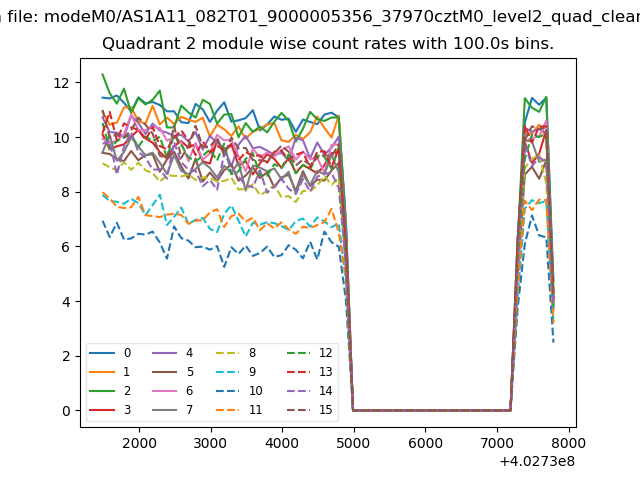
| Module-wise count rates for Quadrant B Data is divided into 100 sec bins |
 |
 |
| Module-wise count rates for Quadrant C Data is divided into 100 sec bins |
 |
 |
| Module-wise count rates for Quadrant D Data is divided into 100 sec bins |
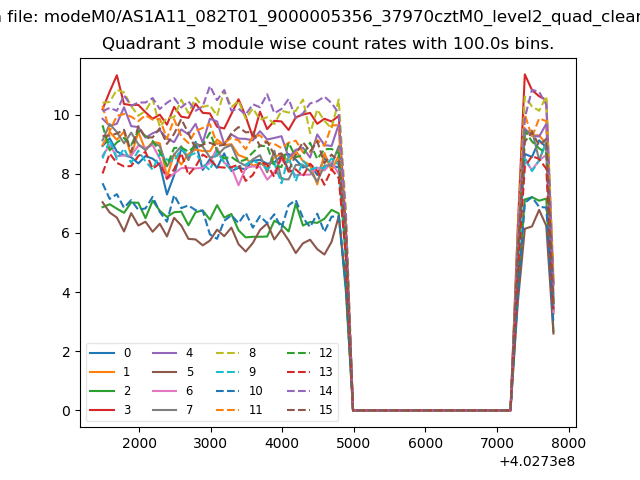 |
 |
| Parameter | Plot |
|---|---|
| CZT HV Monitor | 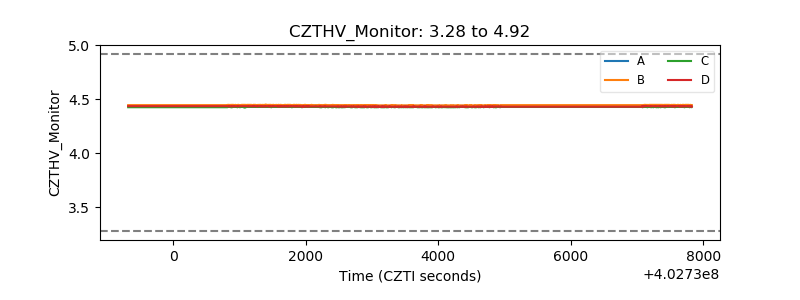 |
| D_VDD | 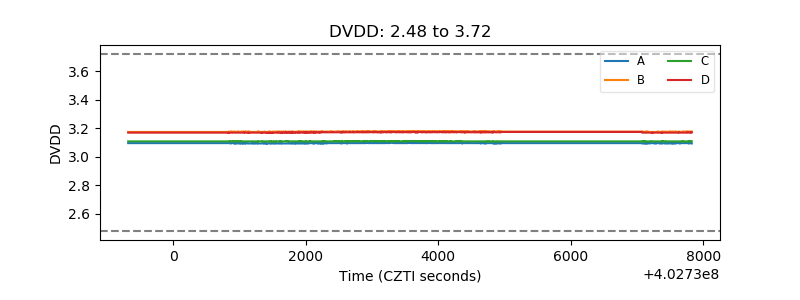 |
| Temperature 1 | 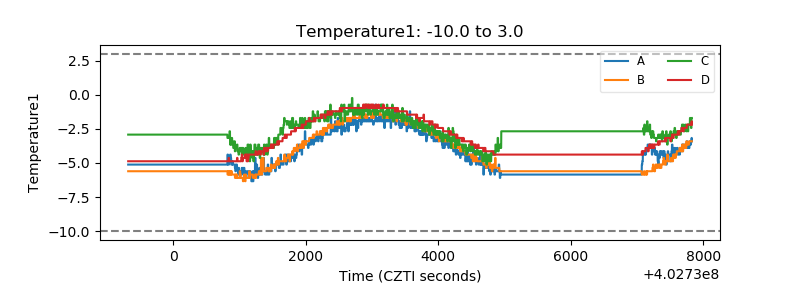 |
| Veto HV Monitor | 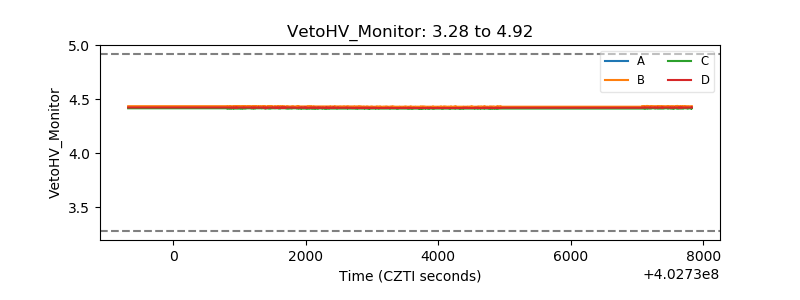 |
| Veto LLD | 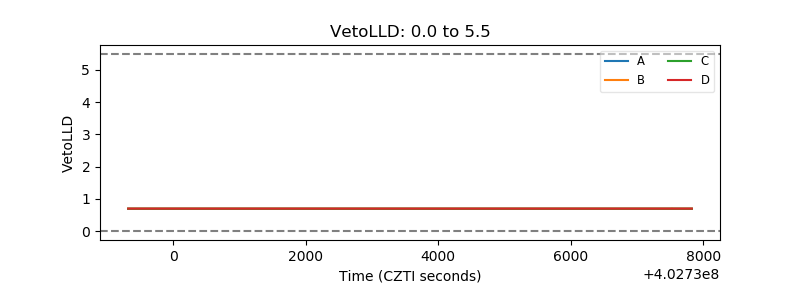 |
| Alpha Counter | 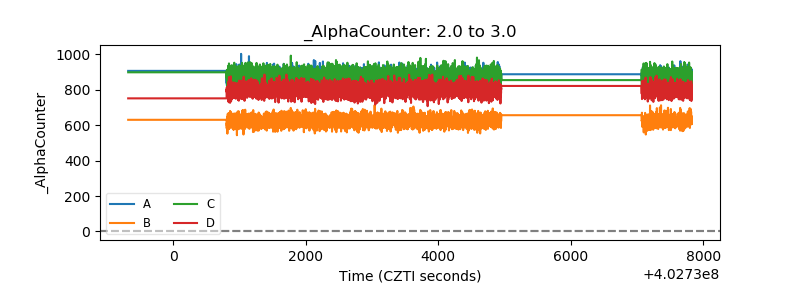 |
| _CPM_Rate | 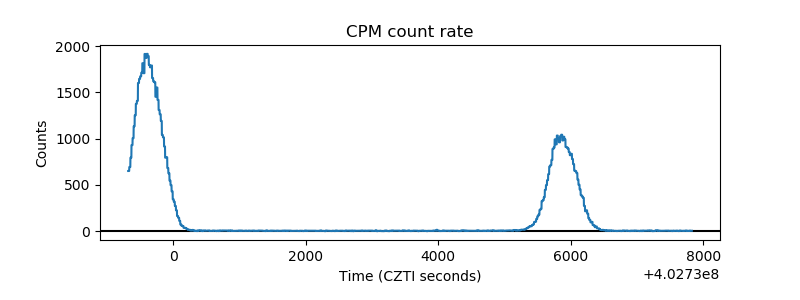 |
| CZT Counter | 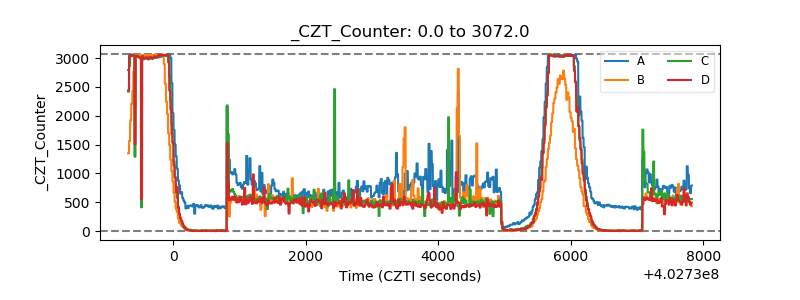 |
| +2.5 Volts monitor | 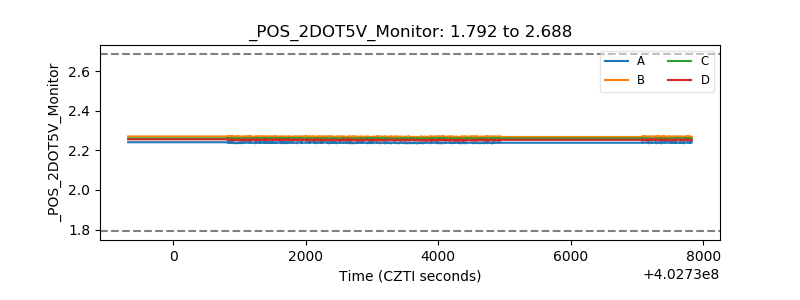 |
| +5 Volts monitor | 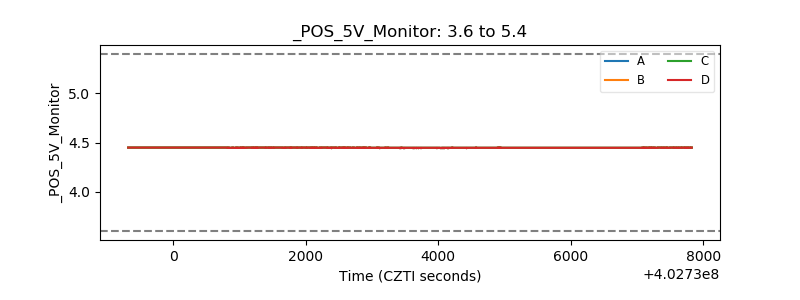 |
| _ROLL_ROT | 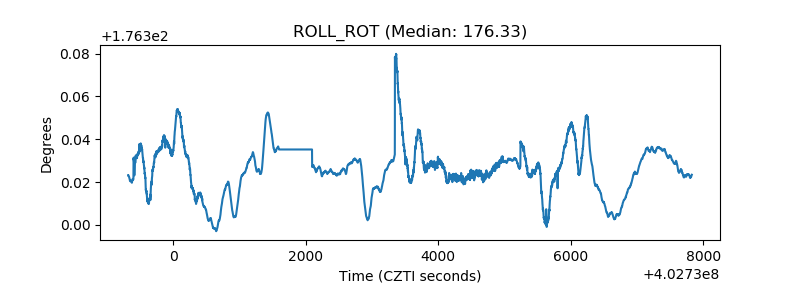 |
| _Roll_DEC | 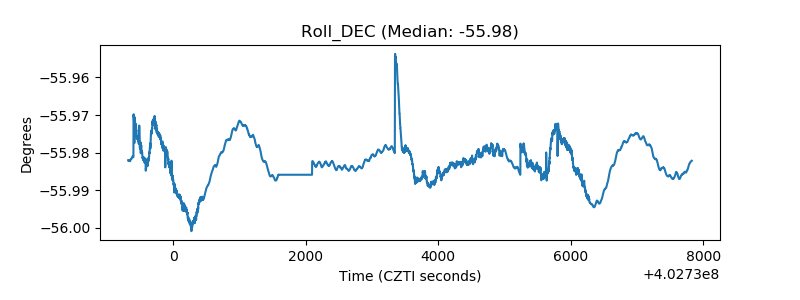 |
| _Roll_RA | 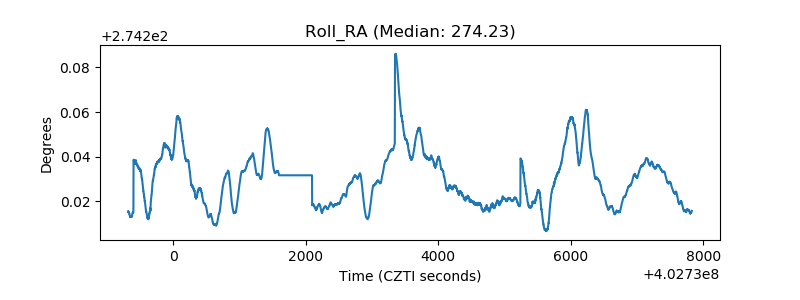 |
| Veto Counter | 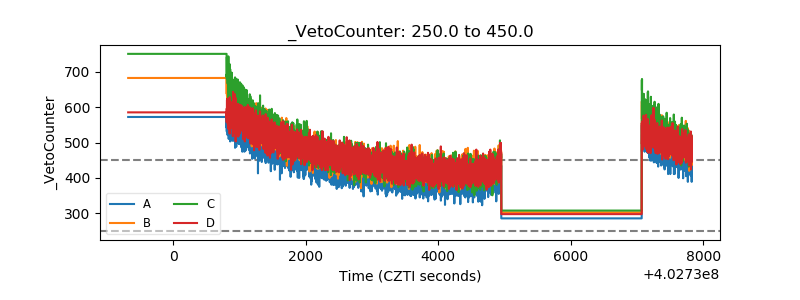 |