| Param | Original file | Final file |
|---|---|---|
| Filename | modeM0/AS1A11_082T01_9000005356_37971cztM0_level2.fits | modeM0/AS1A11_082T01_9000005356_37971cztM0_level2_quad_clean.evt |
| Size (bytes) | 395,778,240 | 66,674,880 |
| Size | 377.4 MB | 63.6 MB |
| Events in quadrant A | 4,360,558 | 439,795 |
| Events in quadrant B | 3,869,728 | 390,496 |
| Events in quadrant C | 2,641,376 | 447,297 |
| Events in quadrant D | 3,397,847 | 397,324 |
| Mode M0 | |||
|---|---|---|---|
| Quadrant | BADHDUFLAG | Total packets | Discarded packets |
| A | 0 | 16568 | 3 |
| B | 0 | 14451 | 2 |
| C | 0 | 10677 | 2 |
| D | 0 | 13066 | 2 |
| Mode SS | |||
|---|---|---|---|
| Quadrant | BADHDUFLAG | Total packets | Discarded packets |
| A | 0 | 100 | 0 |
| B | 0 | 100 | 0 |
| C | 0 | 100 | 0 |
| D | 0 | 100 | 0 |
| Mode M9 | |||
|---|---|---|---|
| Quadrant | BADHDUFLAG | Total packets | Discarded packets |
| A | 0 | 33 | 0 |
| B | 0 | 33 | 0 |
| C | 0 | 33 | 0 |
| D | 0 | 34 | 0 |
| Quadrant | Total seconds | Saturated seconds | Saturation percentage |
|---|---|---|---|
| A | 4903 | 34 | 0.693453% |
| B | 4903 | 546 | 11.136039% |
| C | 4903 | 17 | 0.346726% |
| D | 4903 | 143 | 2.916582% |
Noise dominated data is calculated using 1-second bins in cleaned event files. If a bin has >2000 counts, and if more than 50% of those come from <1% of pixels, then it is considered to be noise-dominated and hence unusable.
| Quadrant | # 1 sec bins | Bins with >0 counts | Bins with >2000 counts | High rate bins dominated by noise | Noise dominated (total time) | Noise dominated (detector-on time) | Marked lightcurve |
|---|---|---|---|---|---|---|---|
| A | 7026 | 4904 | 12 | 12 | 0.17% | 0.24% | 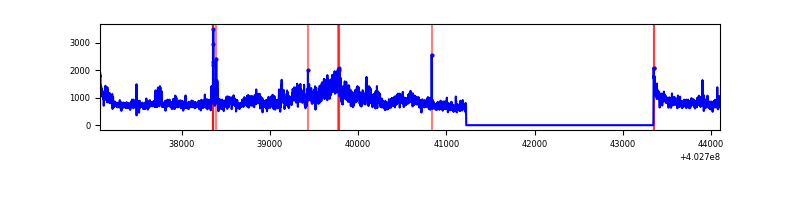 |
| B | 7026 | 4904 | 434 | 434 | 6.18% | 8.85% | 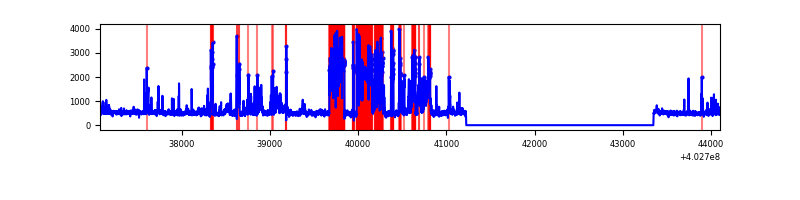 |
| C | 7026 | 4904 | 9 | 9 | 0.13% | 0.18% | 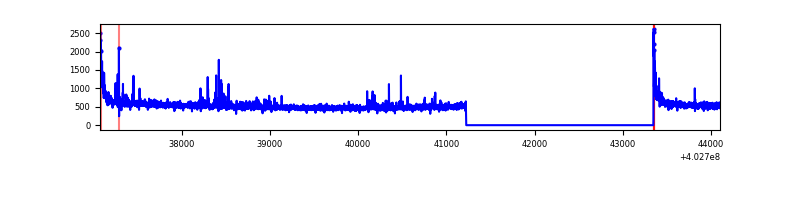 |
| D | 7026 | 4904 | 155 | 155 | 2.21% | 3.16% | 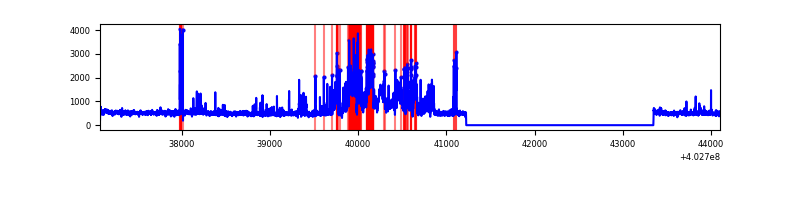 |
Top three noisy pixels from each quadrant. If the there are fewer than three noisy pixels in the level2.evt file, extra rows are filled as -1
| Pixel properties | Quadrant properties | ||||||
|---|---|---|---|---|---|---|---|
| Quadrant | DetID | PixID | Counts | Sigma | Mean | Median | Sigma |
| A | 15 | 222 | 1688014 | 14264.23 | 589 | 580 | 118.3 |
| A | 10 | 83 | 359761 | 3036.23 | 589 | 580 | 118.3 |
| A | 7 | 191 | 12166 | 97.94 | 589 | 580 | 118.3 |
| B | 5 | 184 | 1462657 | 13945.34 | 554 | 541 | 104.8 |
| B | 5 | 172 | 156434 | 1486.87 | 554 | 541 | 104.8 |
| B | 0 | 229 | 32841 | 308.07 | 554 | 541 | 104.8 |
| C | 15 | 214 | 211648 | 1586.22 | 578 | 584 | 133.1 |
| C | 0 | 10 | 105426 | 787.92 | 578 | 584 | 133.1 |
| C | 14 | 254 | 61362 | 456.77 | 578 | 584 | 133.1 |
| D | 13 | 171 | 888836 | 6345.73 | 574 | 558 | 140.0 |
| D | 7 | 223 | 62103 | 439.67 | 574 | 558 | 140.0 |
| D | 10 | 118 | 47828 | 337.69 | 574 | 558 | 140.0 |
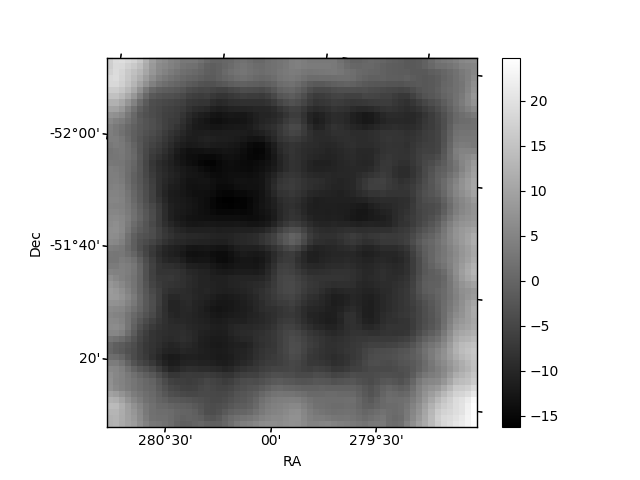
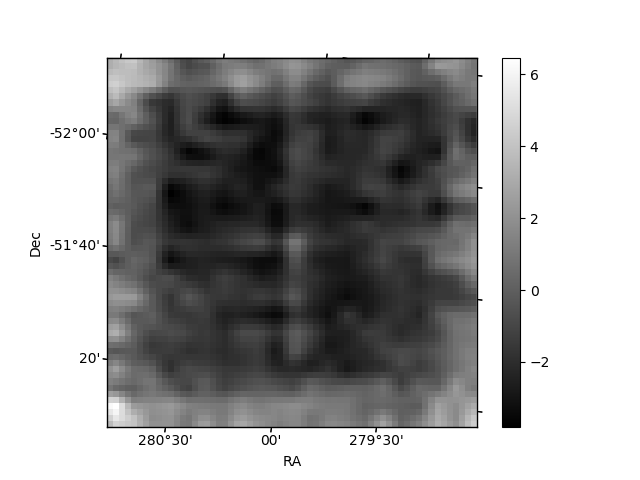
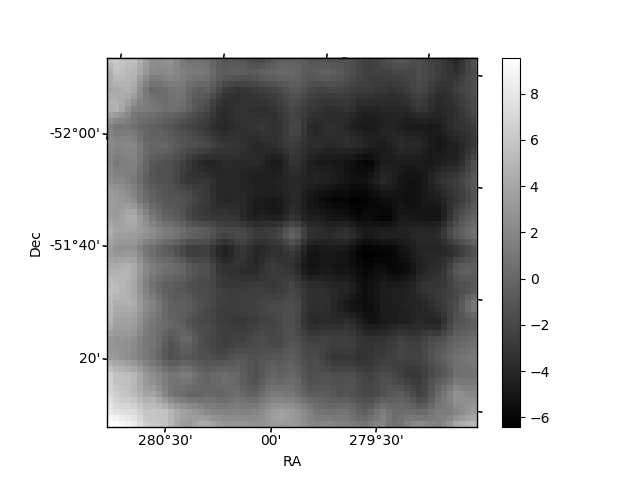
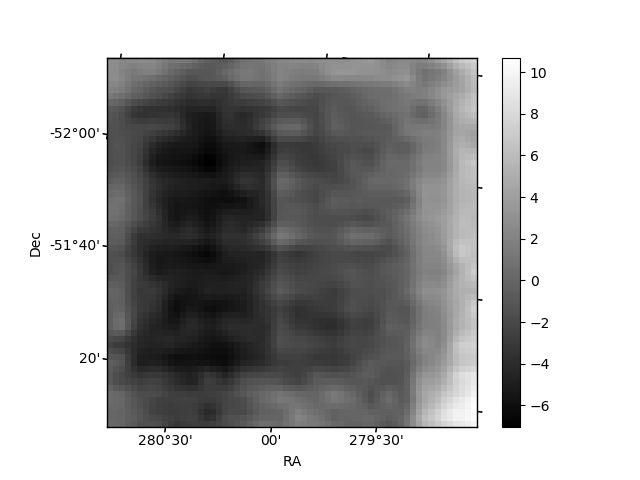
Histogram calculated using DETX and DETY for each event in the final _common_clean file
| Quadrant A | 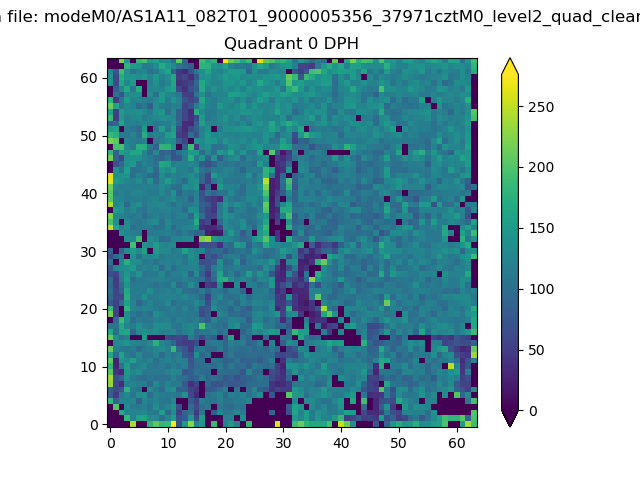 |
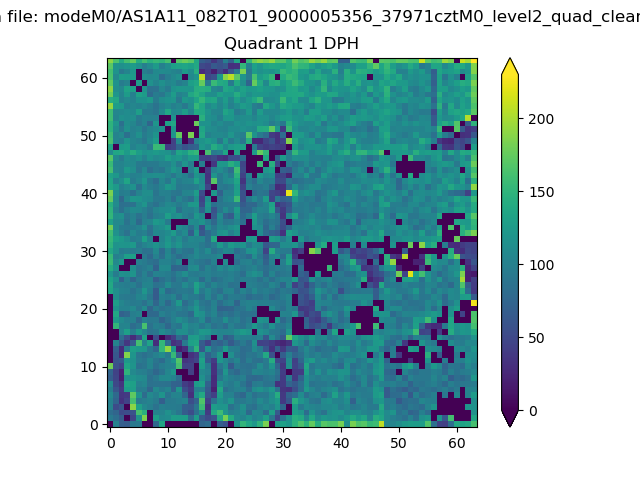 |
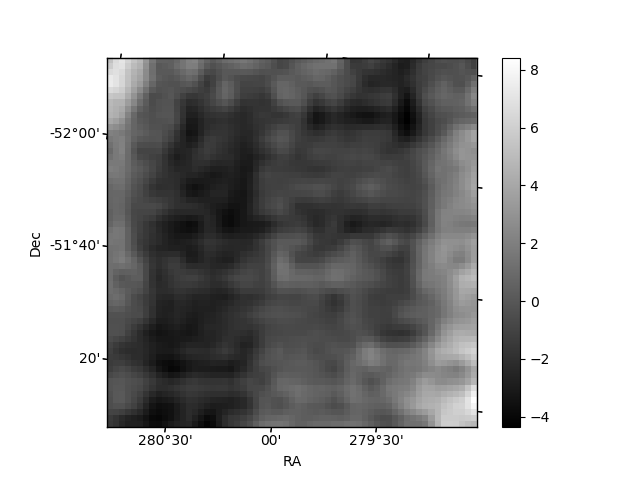
Quadrant B |
|---|---|---|---|
| Quadrant D | 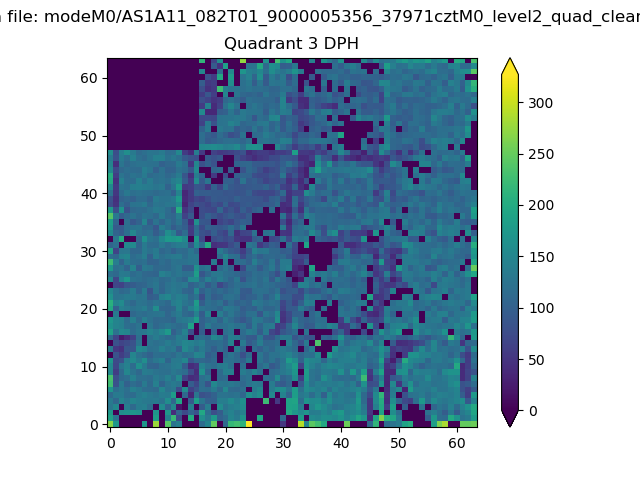 |
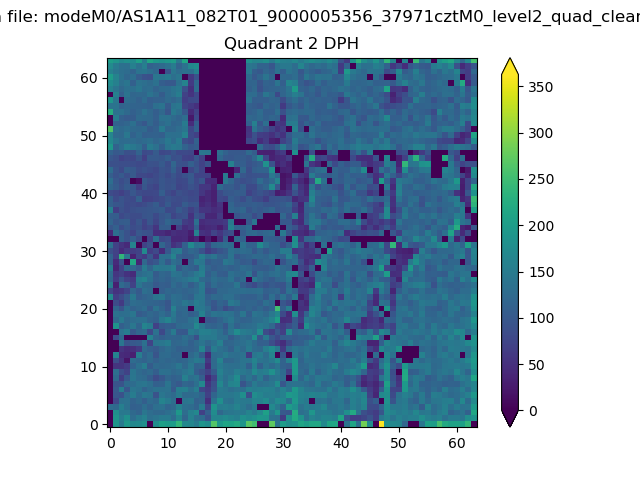 |
Quadrant C |
| Plot type | Count rate plots | Images |
|---|---|---|
| Comparison with Poisson distribution Blue bars denote a histogram of data divided into 1 sec bins. Red curve is a Poisson curve with rate = median count rate of data. |
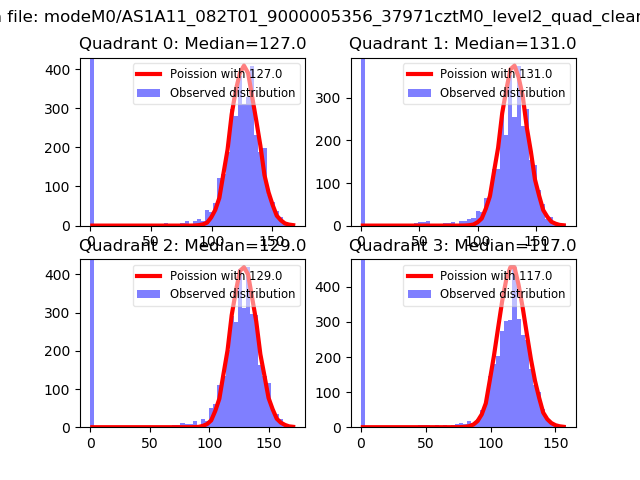 |
 |
| Quadrant-wise count rates Data is divided into 100 sec bins |
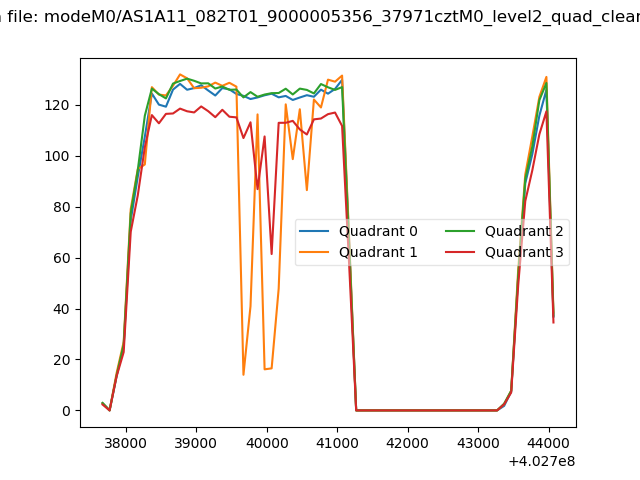 |
|
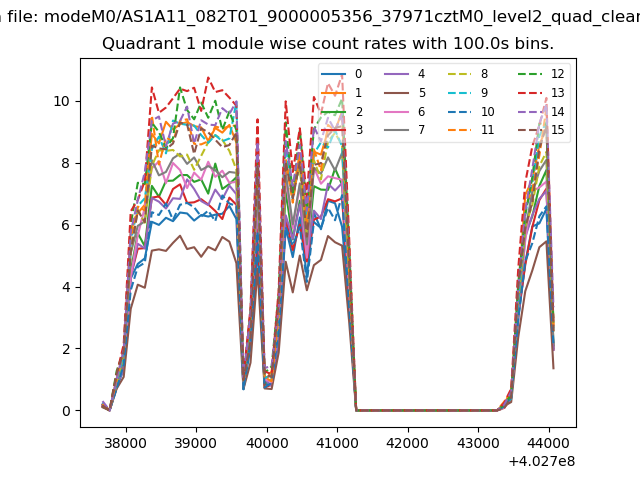
| Module-wise count rates for Quadrant A Data is divided into 100 sec bins |
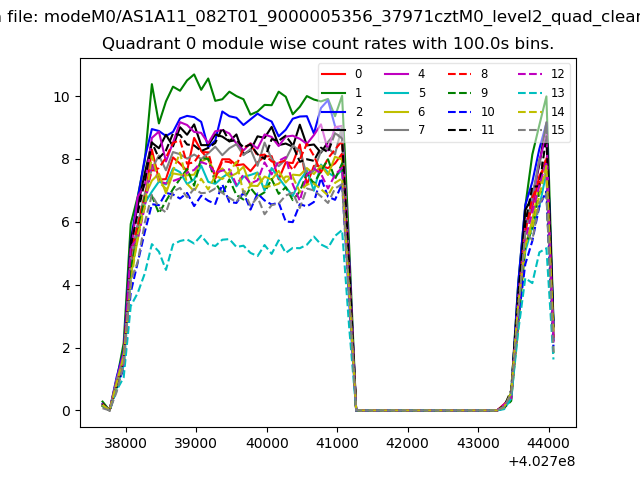 |
 |
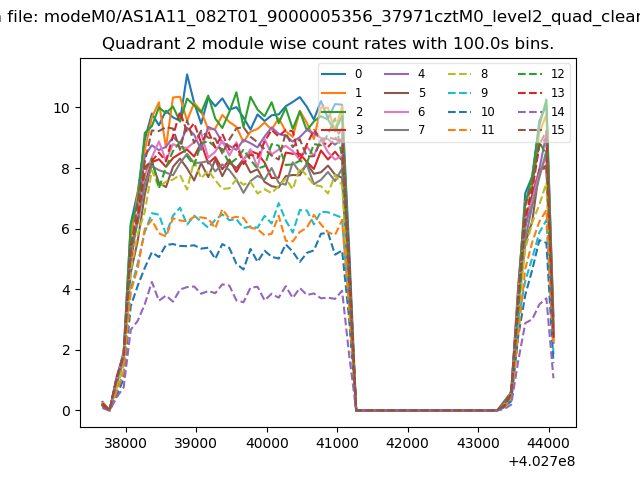
| Module-wise count rates for Quadrant B Data is divided into 100 sec bins |
 |
 |
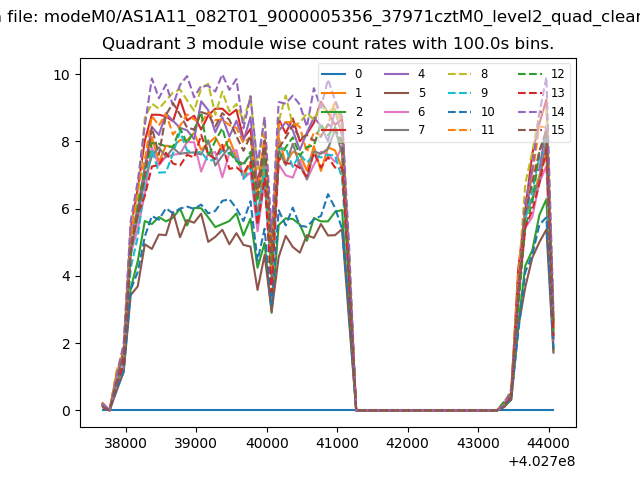
| Module-wise count rates for Quadrant C Data is divided into 100 sec bins |
 |
 |
| Module-wise count rates for Quadrant D Data is divided into 100 sec bins |
 |
 |
| Parameter | Plot |
|---|---|
| CZT HV Monitor | 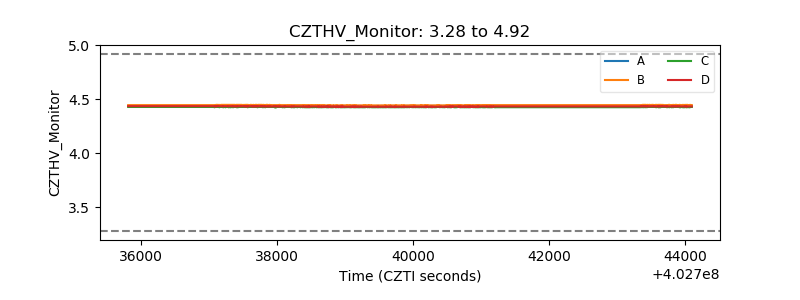 |
| D_VDD | 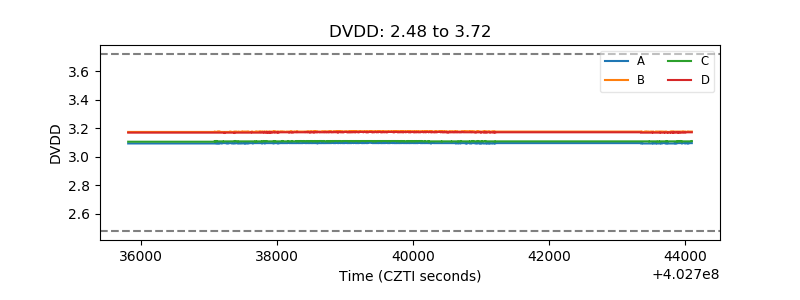 |
| Temperature 1 | 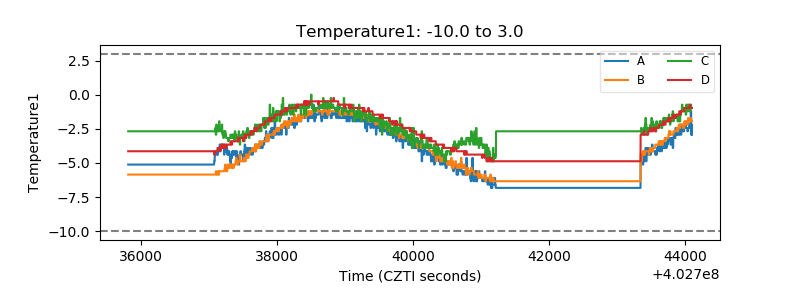 |
| Veto HV Monitor | 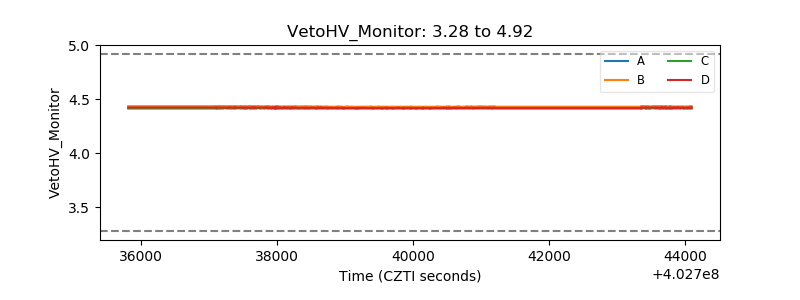 |
| Veto LLD | 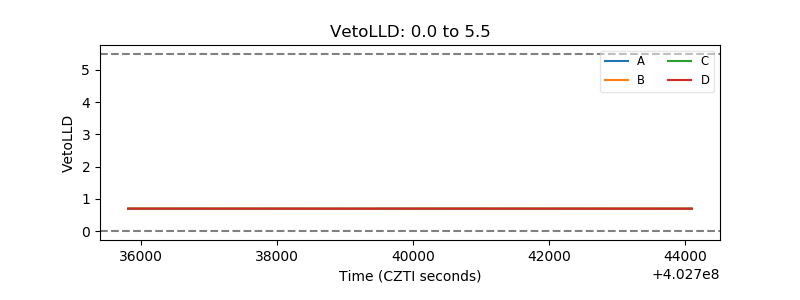 |
| Alpha Counter | 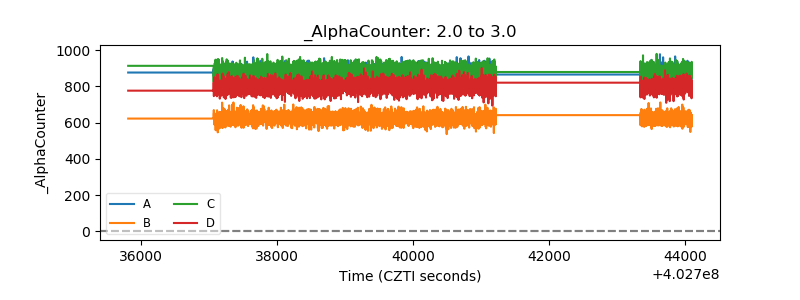 |
| _CPM_Rate | 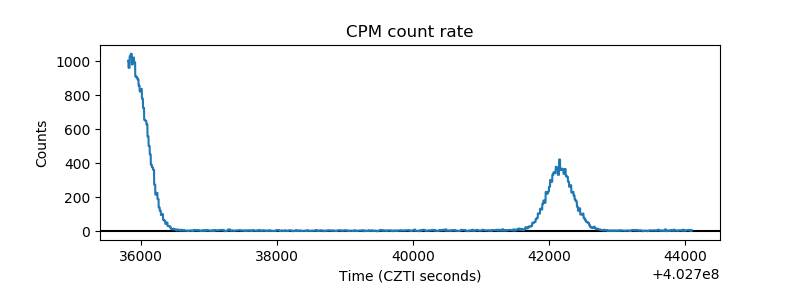 |
| CZT Counter | 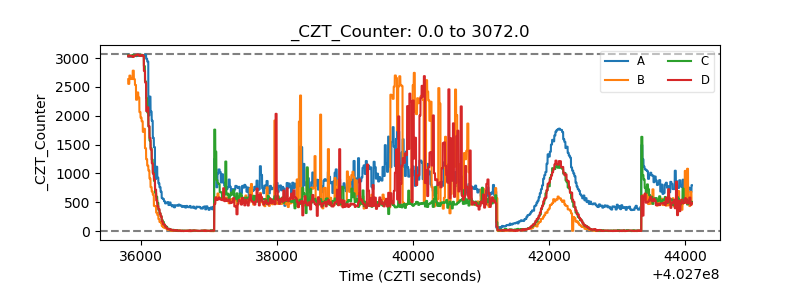 |
| +2.5 Volts monitor | 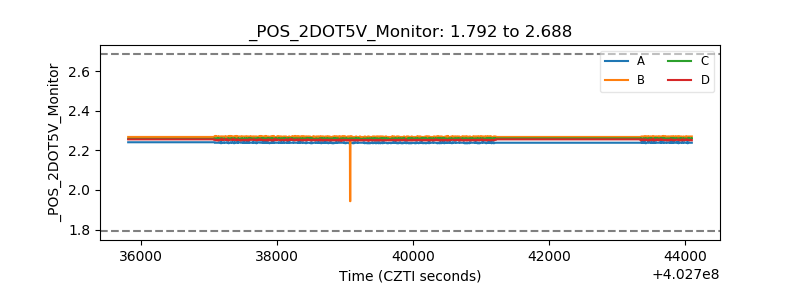 |
| +5 Volts monitor |  |
| _ROLL_ROT | 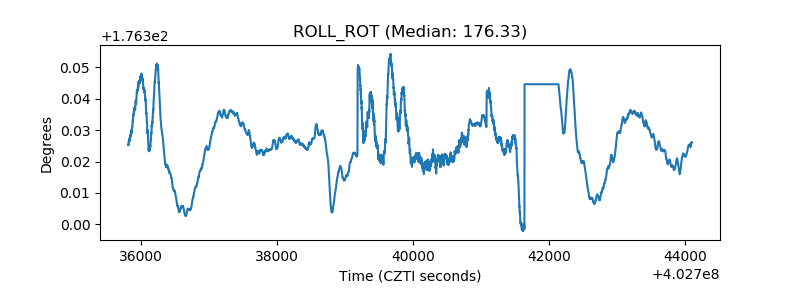 |
| _Roll_DEC | 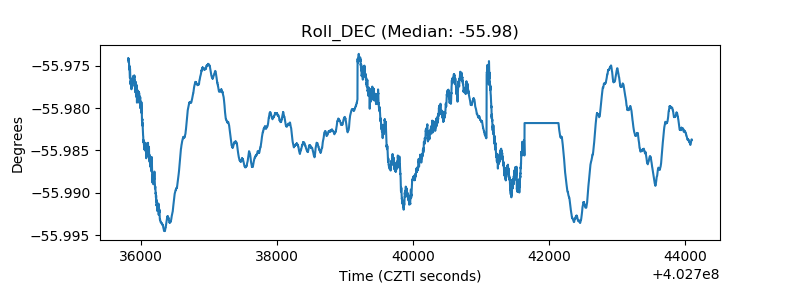 |
| _Roll_RA | 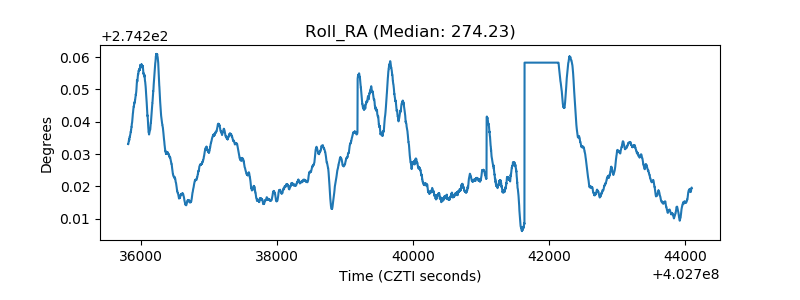 |
| Veto Counter | 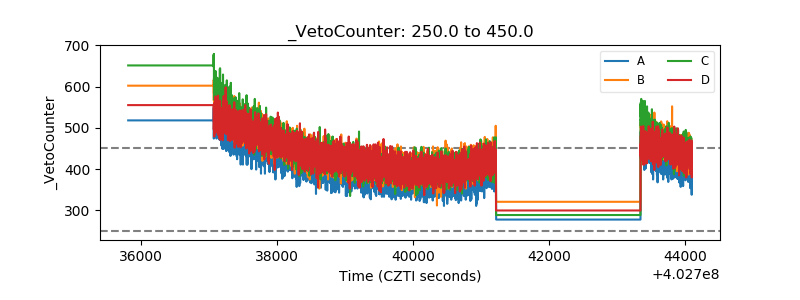 |