| Param | Original file | Final file |
|---|---|---|
| Filename | modeM0/AS1A11_082T01_9000005356_37972cztM0_level2.evt | modeM0/AS1A11_082T01_9000005356_37972cztM0_level2_quad_clean.evt |
| Size (bytes) | 444,922,560 | 91,071,360 |
| Size | 424.3 MB | 86.9 MB |
| Events in quadrant A | 4,474,027 | 592,055 |
| Events in quadrant B | 3,373,495 | 601,416 |
| Events in quadrant C | 2,597,788 | 623,952 |
| Events in quadrant D | 2,688,667 | 588,609 |
| Mode M0 | |||
|---|---|---|---|
| Quadrant | BADHDUFLAG | Total packets | Discarded packets |
| A | 0 | 16865 | 3 |
| B | 0 | 13288 | 2 |
| C | 0 | 10715 | 2 |
| D | 0 | 11277 | 2 |
| Mode SS | |||
|---|---|---|---|
| Quadrant | BADHDUFLAG | Total packets | Discarded packets |
| A | 0 | 102 | 0 |
| B | 0 | 102 | 0 |
| C | 0 | 102 | 0 |
| D | 0 | 102 | 0 |
| Mode M9 | |||
|---|---|---|---|
| Quadrant | BADHDUFLAG | Total packets | Discarded packets |
| A | 0 | 31 | 0 |
| B | 0 | 31 | 0 |
| C | 0 | 31 | 0 |
| D | 0 | 32 | 0 |
| Quadrant | Total seconds | Saturated seconds | Saturation percentage |
|---|---|---|---|
| A | 5021 | 42 | 0.836487% |
| B | 5021 | 325 | 6.472814% |
| C | 5021 | 33 | 0.657240% |
| D | 5021 | 78 | 1.553475% |
Noise dominated data is calculated using 1-second bins in cleaned event files. If a bin has >2000 counts, and if more than 50% of those come from <1% of pixels, then it is considered to be noise-dominated and hence unusable.
| Quadrant | # 1 sec bins | Bins with >0 counts | Bins with >2000 counts | High rate bins dominated by noise | Noise dominated (total time) | Noise dominated (detector-on time) | Marked lightcurve |
|---|---|---|---|---|---|---|---|
| A | 7025 | 5022 | 12 | 12 | 0.17% | 0.24% | 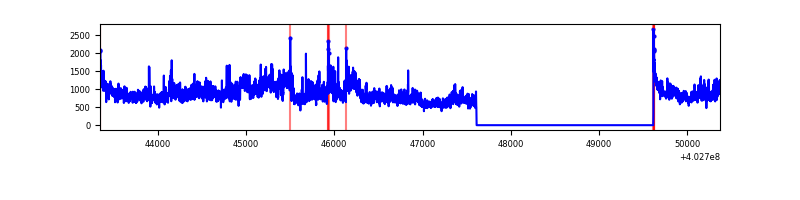 |
| B | 7025 | 5022 | 195 | 195 | 2.78% | 3.88% | 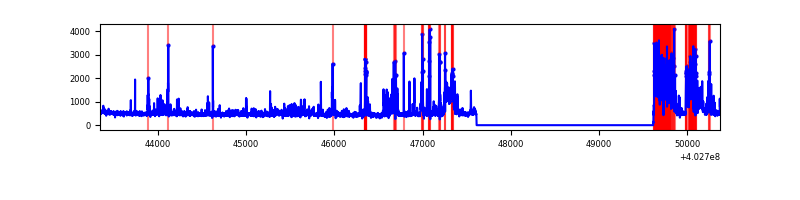 |
| C | 7025 | 5022 | 23 | 23 | 0.33% | 0.46% | 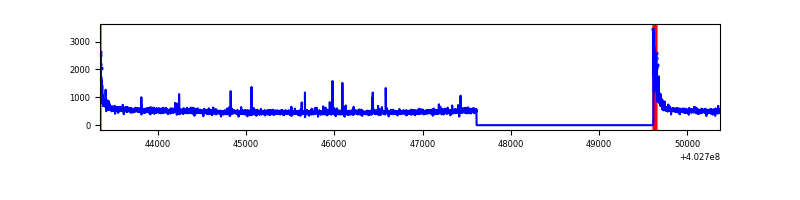 |
| D | 7025 | 5022 | 66 | 66 | 0.94% | 1.31% | 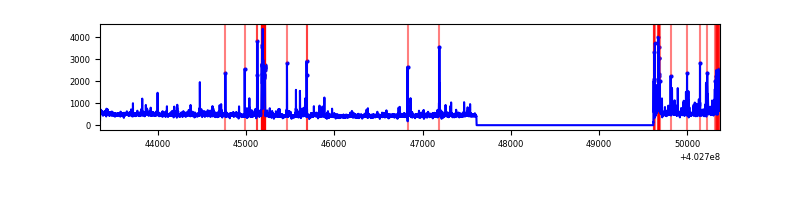 |
Top three noisy pixels from each quadrant. If the there are fewer than three noisy pixels in the level2.evt file, extra rows are filled as -1
| Pixel properties | Quadrant properties | ||||||
|---|---|---|---|---|---|---|---|
| Quadrant | DetID | PixID | Counts | Sigma | Mean | Median | Sigma |
| A | 15 | 222 | 1843404 | 15894.36 | 576 | 567 | 115.9 |
| A | 10 | 83 | 362976 | 3125.76 | 576 | 567 | 115.9 |
| A | 9 | 143 | 15782 | 131.23 | 576 | 567 | 115.9 |
| B | 5 | 184 | 820431 | 7696.25 | 561 | 547 | 106.5 |
| B | 5 | 172 | 143980 | 1346.4 | 561 | 547 | 106.5 |
| B | 4 | 81 | 72926 | 679.42 | 561 | 547 | 106.5 |
| C | 15 | 214 | 217932 | 1675.29 | 563 | 568 | 129.7 |
| C | 0 | 10 | 145178 | 1114.55 | 563 | 568 | 129.7 |
| C | 14 | 254 | 31760 | 240.41 | 563 | 568 | 129.7 |
| D | 12 | 233 | 181828 | 1328.15 | 563 | 549 | 136.5 |
| D | 10 | 199 | 120170 | 876.41 | 563 | 549 | 136.5 |
| D | 13 | 249 | 56329 | 408.67 | 563 | 549 | 136.5 |
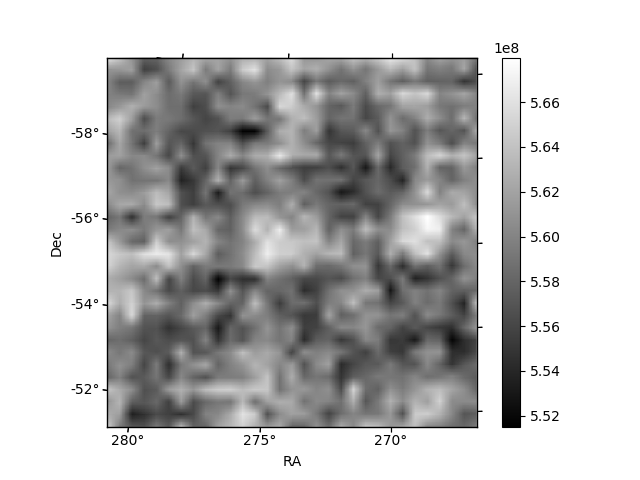
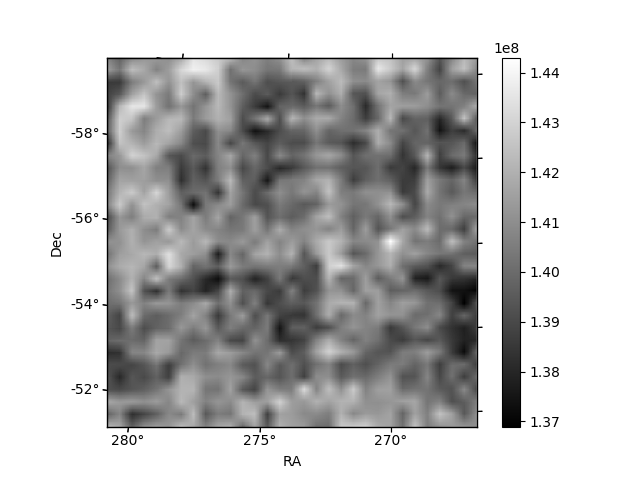
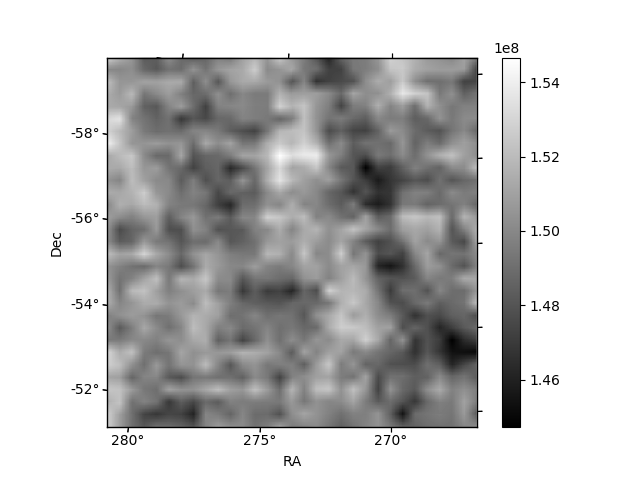
Histogram calculated using DETX and DETY for each event in the final _common_clean file
| Quadrant A | 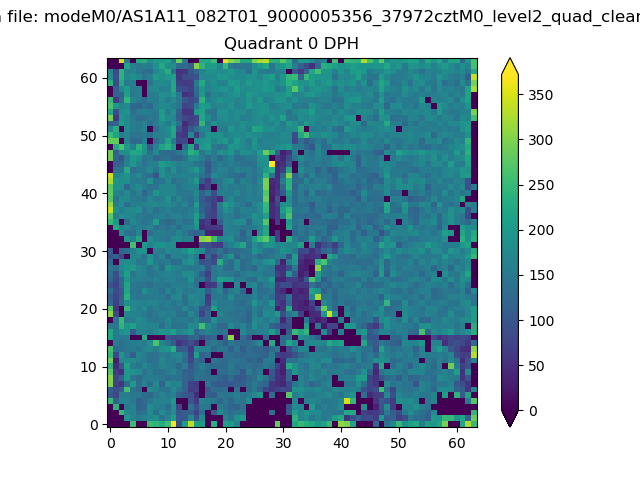 |
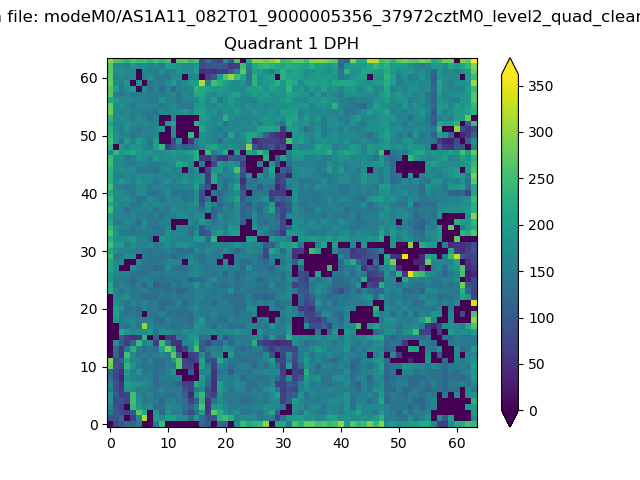 |
Quadrant B |
|---|---|---|---|
| Quadrant D | 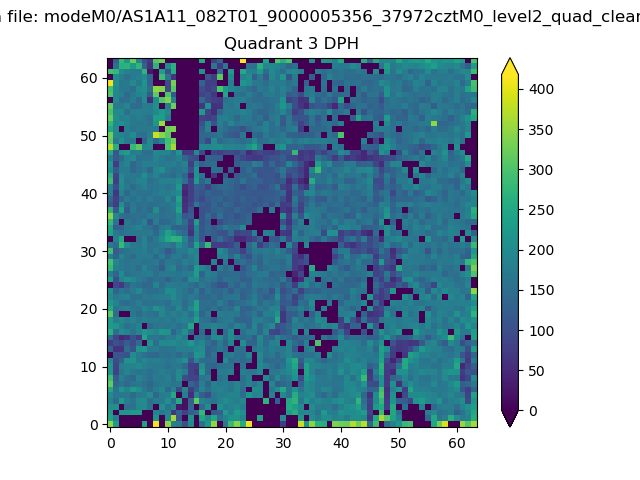 |
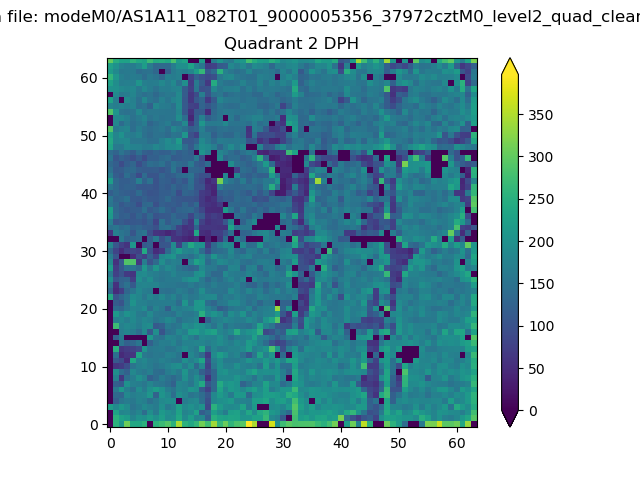 |
Quadrant C |
| Plot type | Count rate plots | Images |
|---|---|---|
| Comparison with Poisson distribution Blue bars denote a histogram of data divided into 1 sec bins. Red curve is a Poisson curve with rate = median count rate of data. |
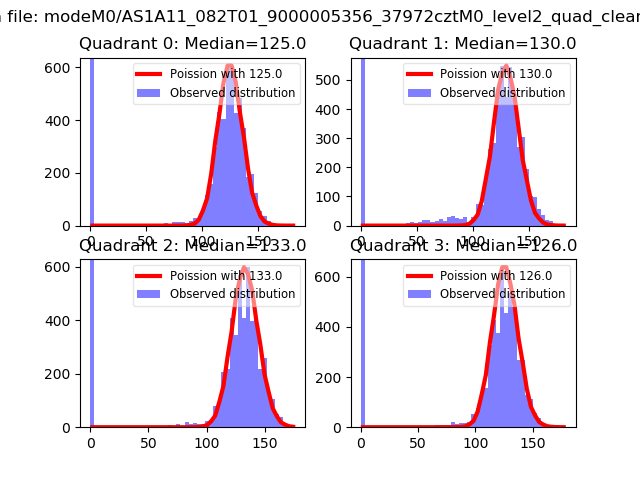 |
 |
| Quadrant-wise count rates Data is divided into 100 sec bins |
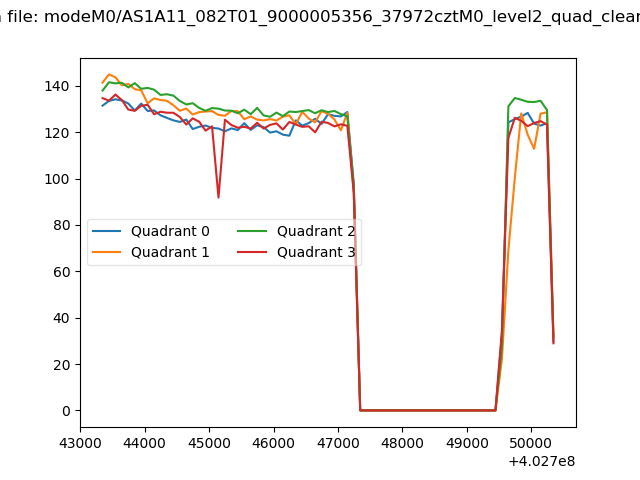 |
|
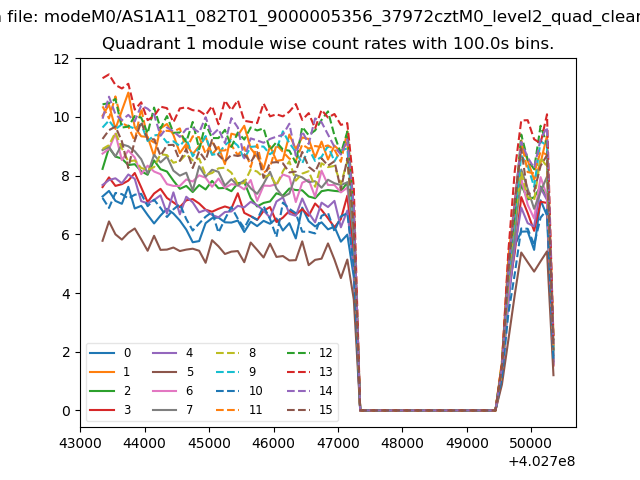
| Module-wise count rates for Quadrant A Data is divided into 100 sec bins |
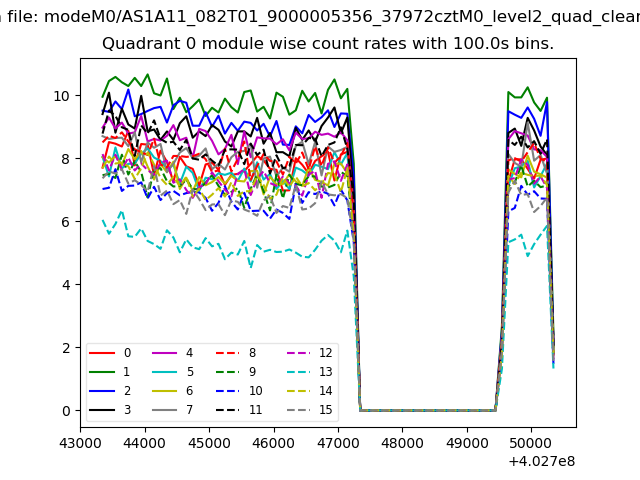 |
 |
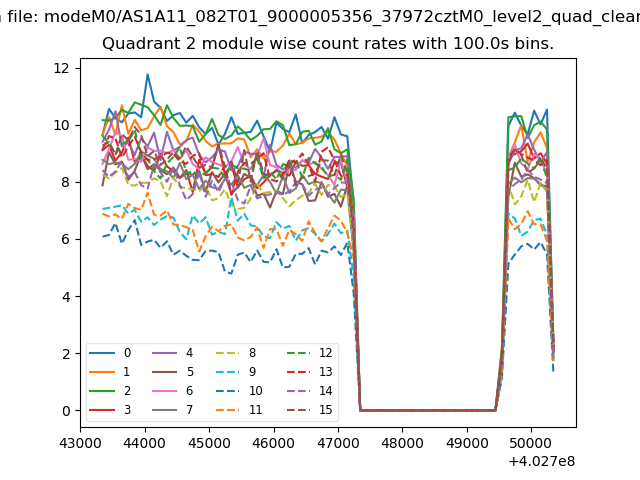
| Module-wise count rates for Quadrant B Data is divided into 100 sec bins |
 |
 |
| Module-wise count rates for Quadrant C Data is divided into 100 sec bins |
 |
 |
| Module-wise count rates for Quadrant D Data is divided into 100 sec bins |
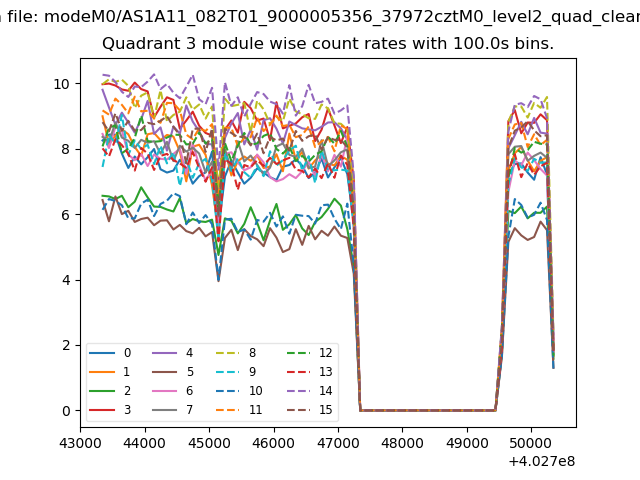 |
 |
| Parameter | Plot |
|---|---|
| CZT HV Monitor | 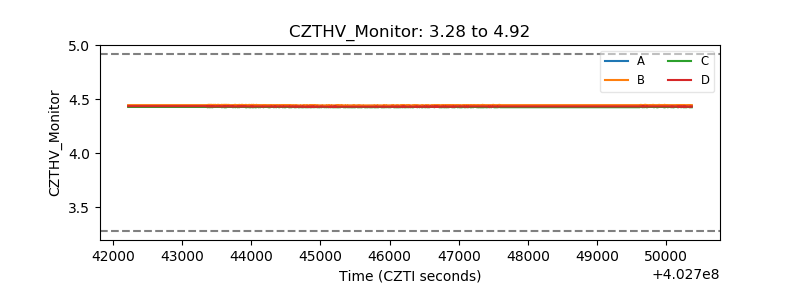 |
| D_VDD | 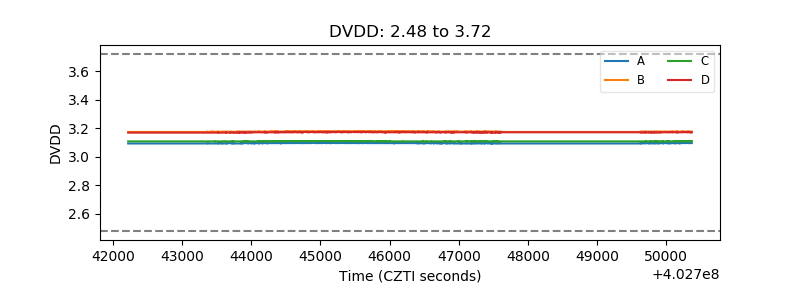 |
| Temperature 1 | 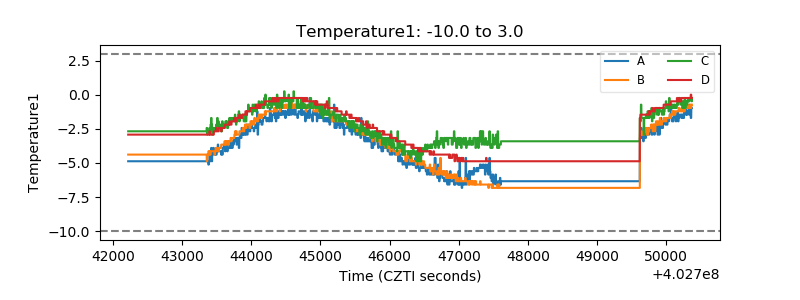 |
| Veto HV Monitor | 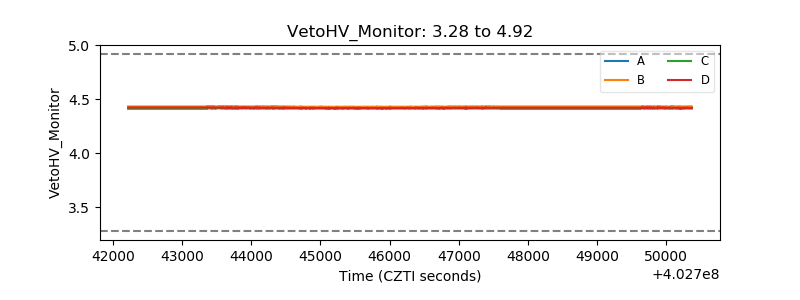 |
| Veto LLD | 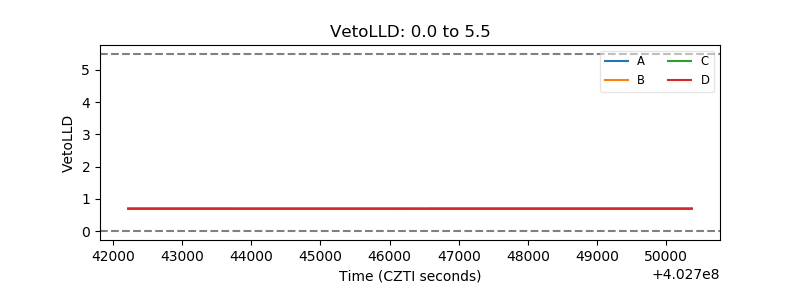 |
| Alpha Counter | 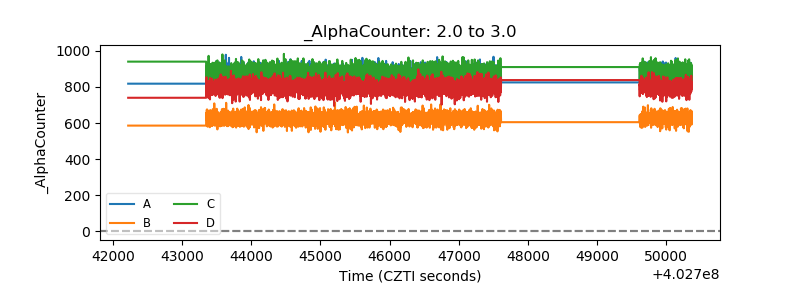 |
| _CPM_Rate | 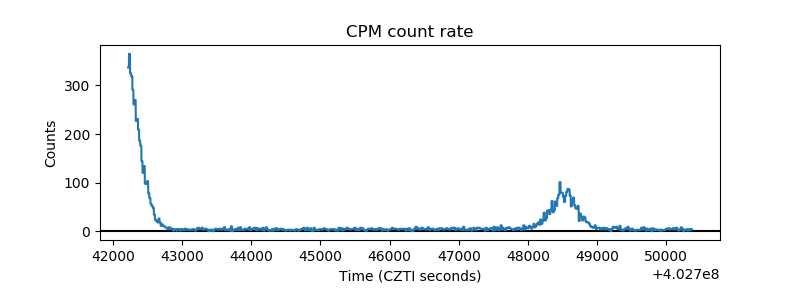 |
| CZT Counter | 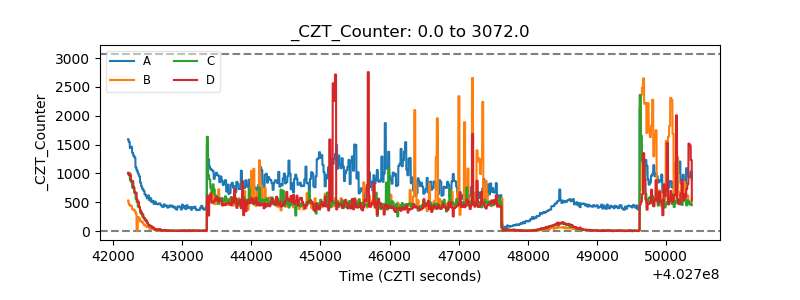 |
| +2.5 Volts monitor | 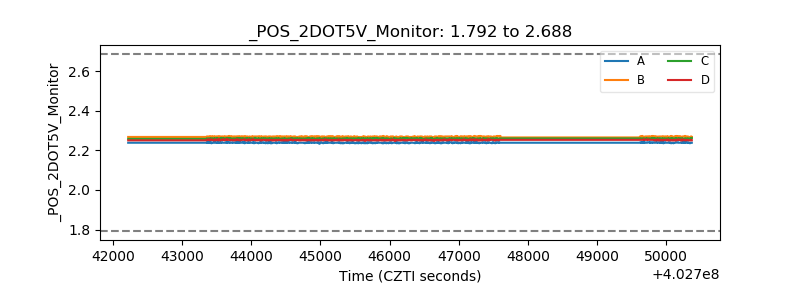 |
| +5 Volts monitor | 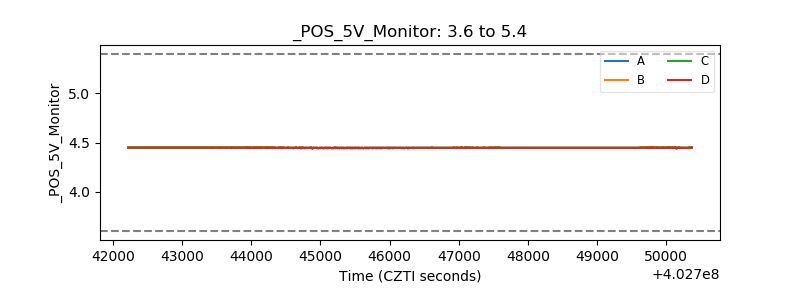 |
| _ROLL_ROT | 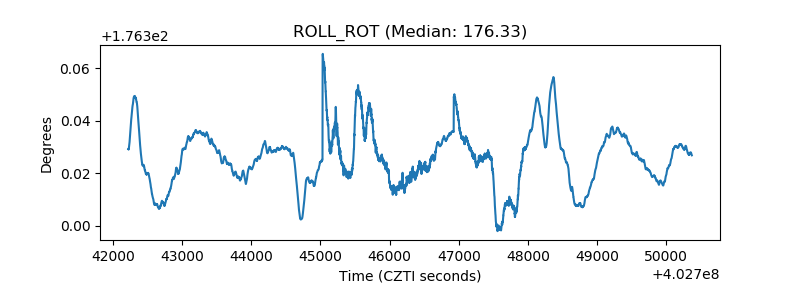 |
| _Roll_DEC | 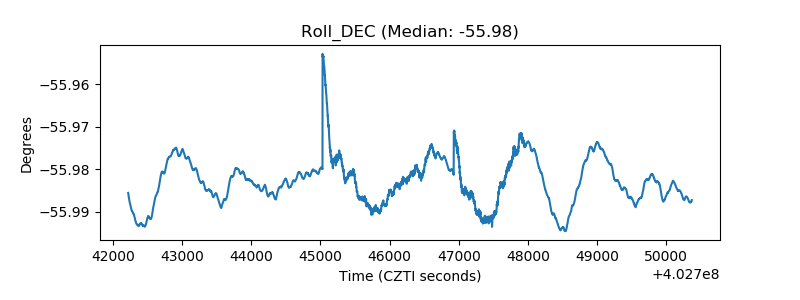 |
| _Roll_RA | 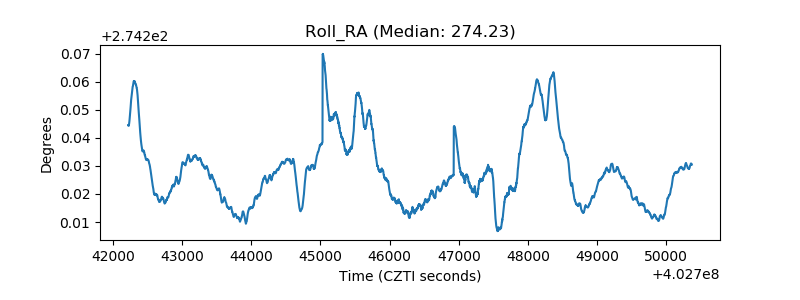 |
| Veto Counter | 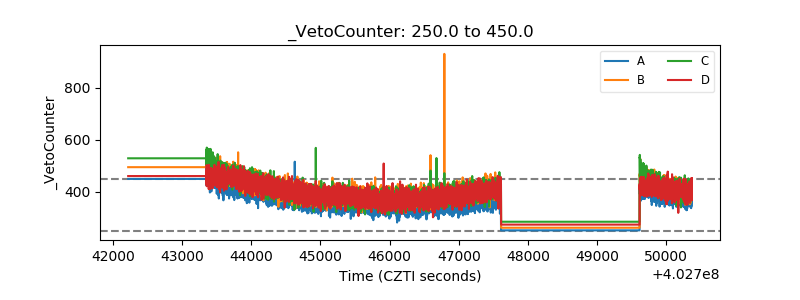 |