| Param | Original file | Final file |
|---|---|---|
| Filename | modeM0/AS1A11_082T01_9000005356_37973cztM0_level2.fits | modeM0/AS1A11_082T01_9000005356_37973cztM0_level2_quad_clean.evt |
| Size (bytes) | 455,238,720 | 79,358,400 |
| Size | 434.1 MB | 75.7 MB |
| Events in quadrant A | 5,096,134 | 522,327 |
| Events in quadrant B | 3,886,601 | 508,166 |
| Events in quadrant C | 2,890,079 | 527,797 |
| Events in quadrant D | 4,540,238 | 449,289 |
| Mode M0 | |||
|---|---|---|---|
| Quadrant | BADHDUFLAG | Total packets | Discarded packets |
| A | 0 | 19191 | 3 |
| B | 0 | 15288 | 2 |
| C | 0 | 12059 | 2 |
| D | 0 | 17242 | 2 |
| Mode SS | |||
|---|---|---|---|
| Quadrant | BADHDUFLAG | Total packets | Discarded packets |
| A | 0 | 116 | 0 |
| B | 0 | 116 | 0 |
| C | 0 | 116 | 0 |
| D | 0 | 116 | 0 |
| Mode M9 | |||
|---|---|---|---|
| Quadrant | BADHDUFLAG | Total packets | Discarded packets |
| A | 0 | 18 | 0 |
| B | 0 | 18 | 0 |
| C | 0 | 18 | 0 |
| D | 0 | 19 | 0 |
| Quadrant | Total seconds | Saturated seconds | Saturation percentage |
|---|---|---|---|
| A | 5649 | 73 | 1.292264% |
| B | 5649 | 405 | 7.169411% |
| C | 5649 | 35 | 0.619579% |
| D | 5649 | 466 | 8.249248% |
Noise dominated data is calculated using 1-second bins in cleaned event files. If a bin has >2000 counts, and if more than 50% of those come from <1% of pixels, then it is considered to be noise-dominated and hence unusable.
| Quadrant | # 1 sec bins | Bins with >0 counts | Bins with >2000 counts | High rate bins dominated by noise | Noise dominated (total time) | Noise dominated (detector-on time) | Marked lightcurve |
|---|---|---|---|---|---|---|---|
| A | 7323 | 5651 | 28 | 28 | 0.38% | 0.50% | 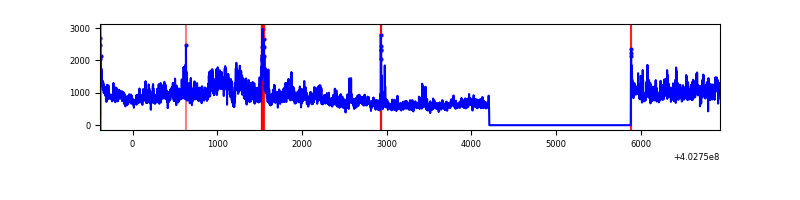 |
| B | 7323 | 5651 | 268 | 268 | 3.66% | 4.74% | 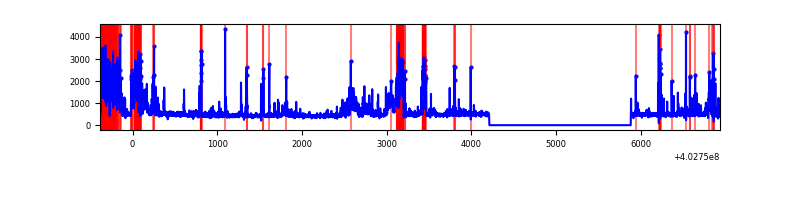 |
| C | 7323 | 5651 | 24 | 24 | 0.33% | 0.42% | 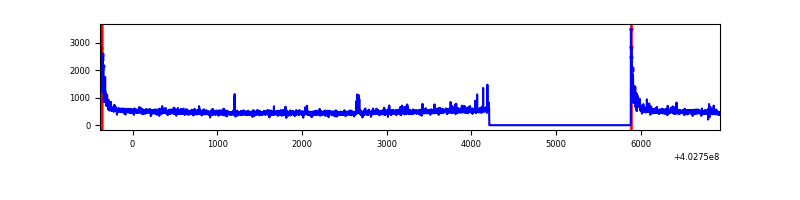 |
| D | 7323 | 5651 | 464 | 464 | 6.34% | 8.21% | 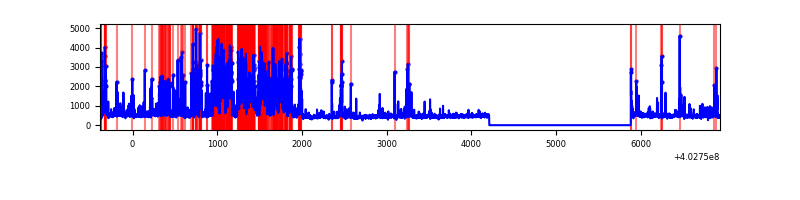 |
Top three noisy pixels from each quadrant. If the there are fewer than three noisy pixels in the level2.evt file, extra rows are filled as -1
| Pixel properties | Quadrant properties | ||||||
|---|---|---|---|---|---|---|---|
| Quadrant | DetID | PixID | Counts | Sigma | Mean | Median | Sigma |
| A | 15 | 222 | 2128751 | 16607.28 | 634 | 621 | 128.1 |
| A | 10 | 83 | 404790 | 3154.01 | 634 | 621 | 128.1 |
| A | 12 | 16 | 55962 | 431.86 | 634 | 621 | 128.1 |
| B | 5 | 184 | 743663 | 6317.57 | 617 | 600 | 117.6 |
| B | 5 | 200 | 425281 | 3610.67 | 617 | 600 | 117.6 |
| B | 5 | 172 | 109718 | 927.73 | 617 | 600 | 117.6 |
| C | 15 | 214 | 240267 | 1672.32 | 617 | 619 | 143.3 |
| C | 0 | 10 | 188633 | 1312.01 | 617 | 619 | 143.3 |
| C | 14 | 254 | 44356 | 305.21 | 617 | 619 | 143.3 |
| D | 2 | 249 | 795873 | 5363.77 | 602 | 585 | 148.3 |
| D | 12 | 227 | 483926 | 3259.86 | 602 | 585 | 148.3 |
| D | 12 | 233 | 393624 | 2650.83 | 602 | 585 | 148.3 |
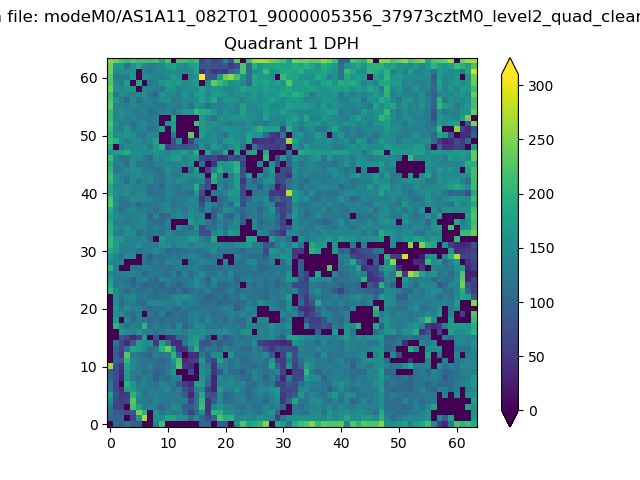
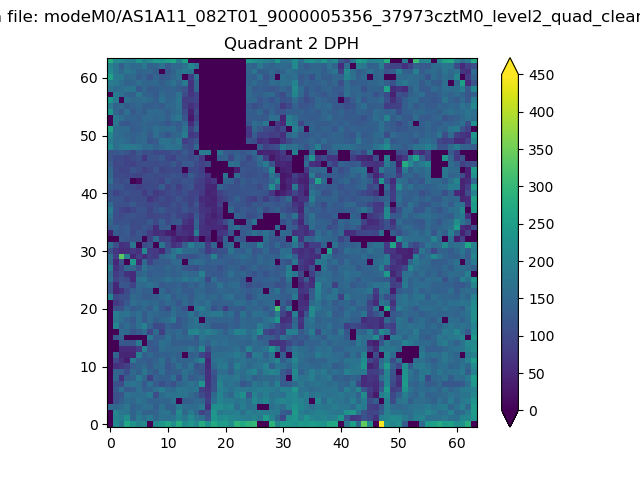
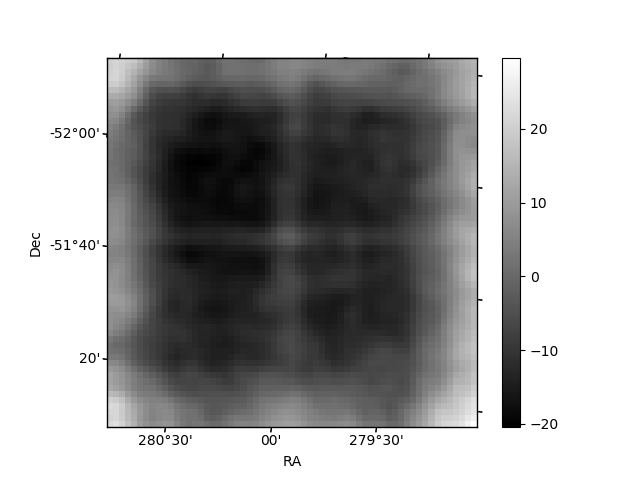
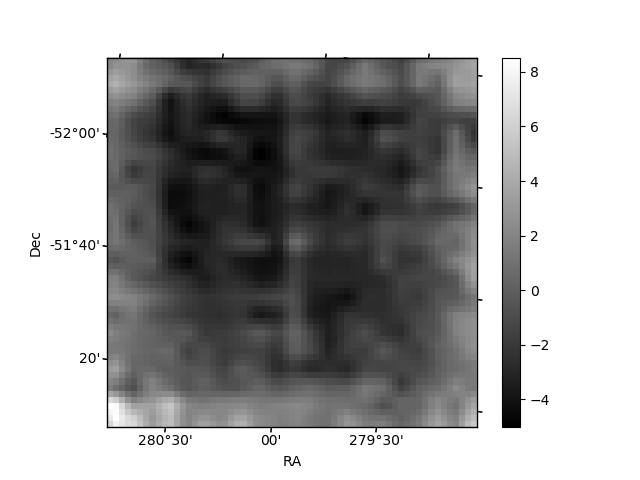
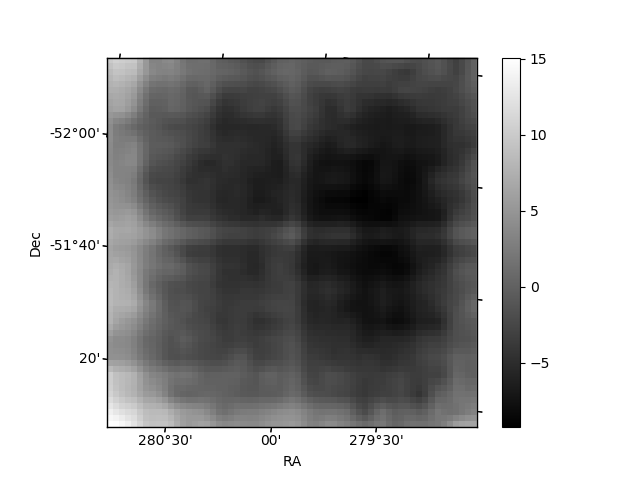
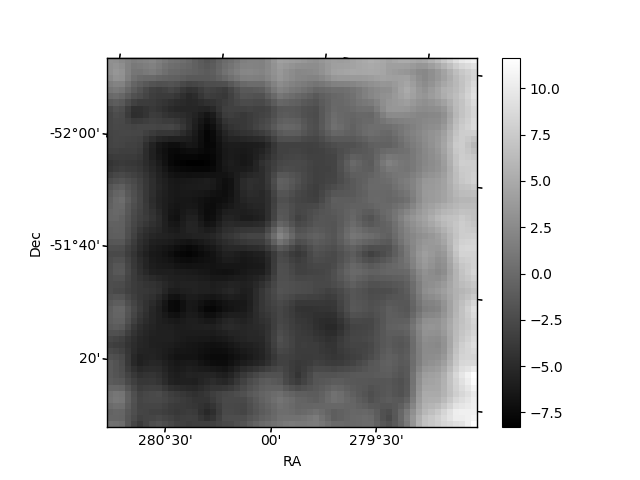
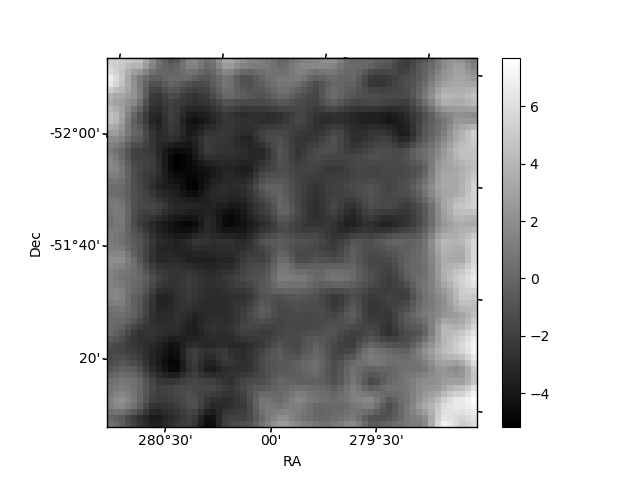
Histogram calculated using DETX and DETY for each event in the final _common_clean file
| Quadrant A |  |
 |
Quadrant B |
|---|---|---|---|
| Quadrant D | 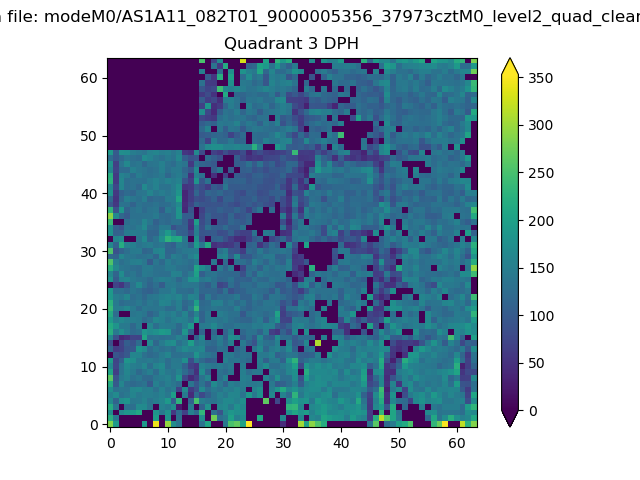 |
 |
Quadrant C |
| Plot type | Count rate plots | Images |
|---|---|---|
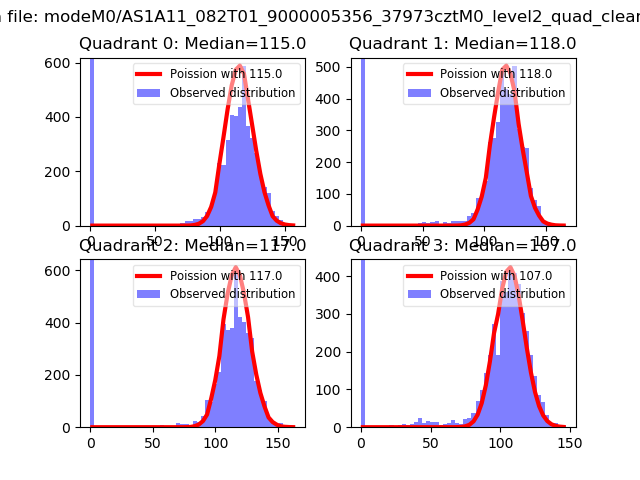
| Comparison with Poisson distribution Blue bars denote a histogram of data divided into 1 sec bins. Red curve is a Poisson curve with rate = median count rate of data. |
 |
 |
| Quadrant-wise count rates Data is divided into 100 sec bins |
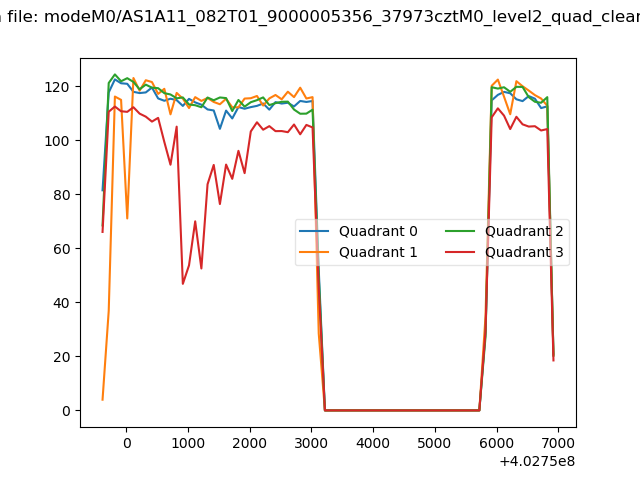 |
|
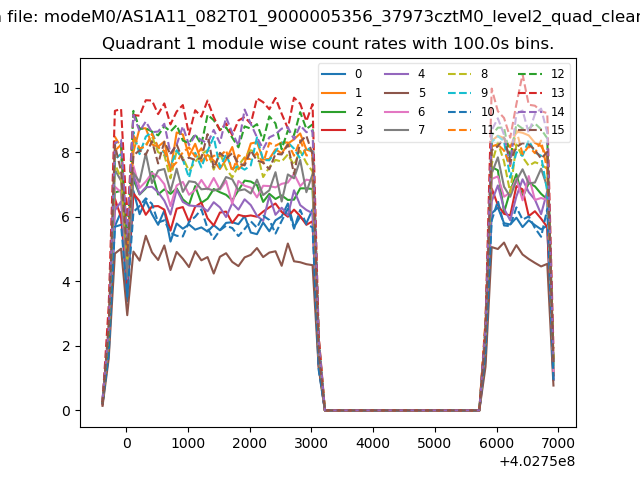
| Module-wise count rates for Quadrant A Data is divided into 100 sec bins |
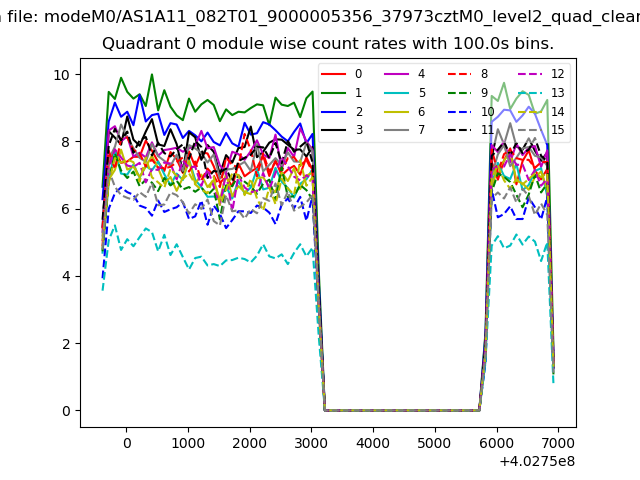 |
 |
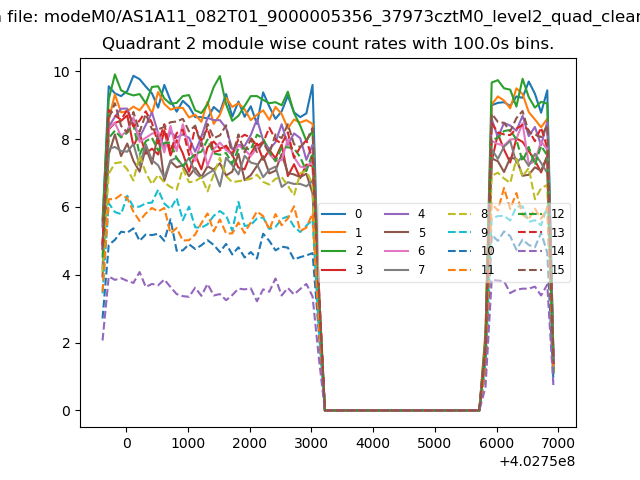
| Module-wise count rates for Quadrant B Data is divided into 100 sec bins |
 |
 |
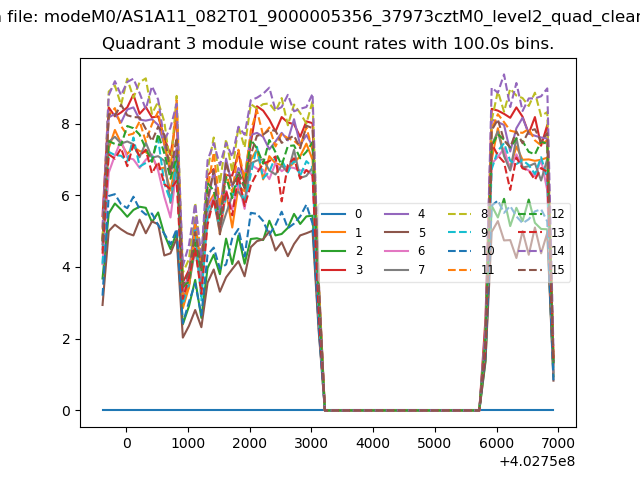
| Module-wise count rates for Quadrant C Data is divided into 100 sec bins |
 |
 |
| Module-wise count rates for Quadrant D Data is divided into 100 sec bins |
 |
 |
| Parameter | Plot |
|---|---|
| CZT HV Monitor | 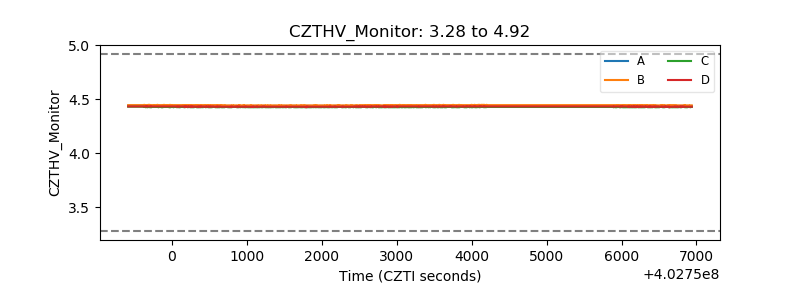 |
| D_VDD | 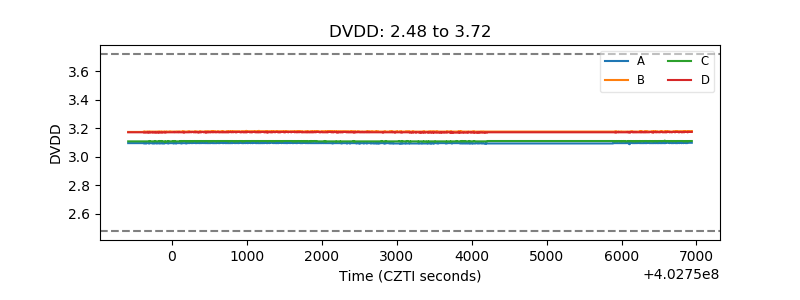 |
| Temperature 1 | 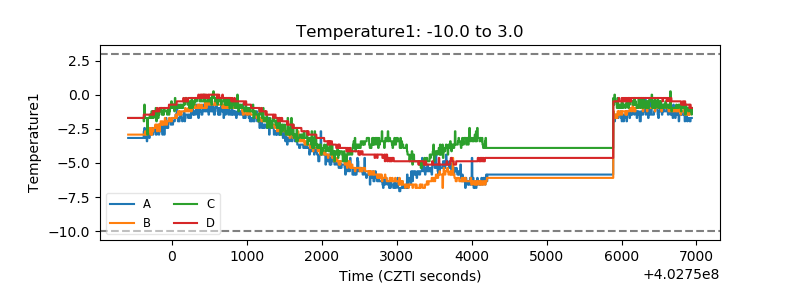 |
| Veto HV Monitor | 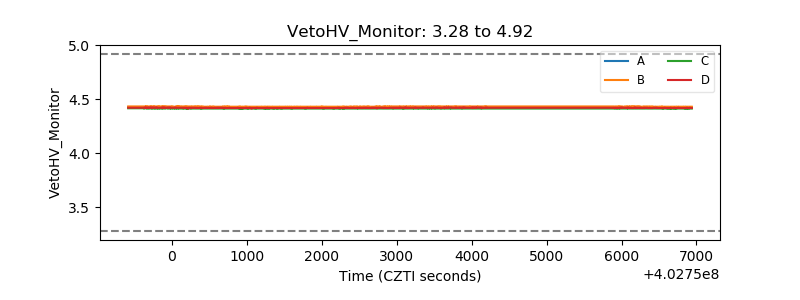 |
| Veto LLD | 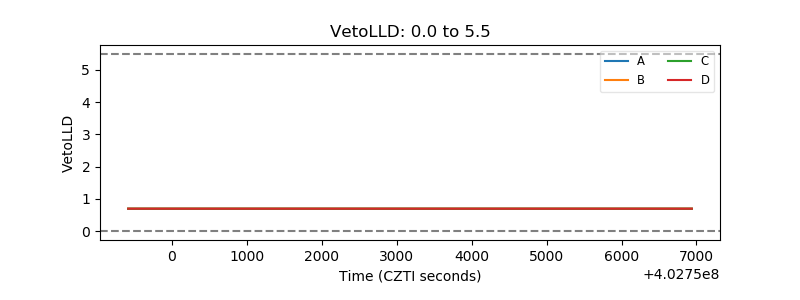 |
| Alpha Counter | 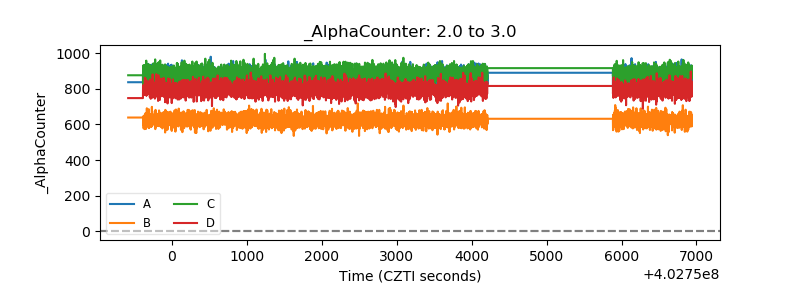 |
| _CPM_Rate | 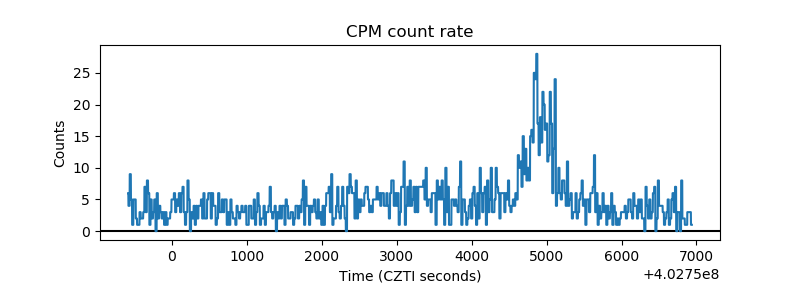 |
| CZT Counter | 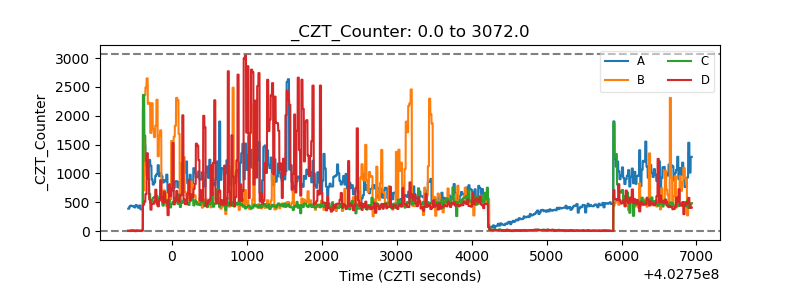 |
| +2.5 Volts monitor | 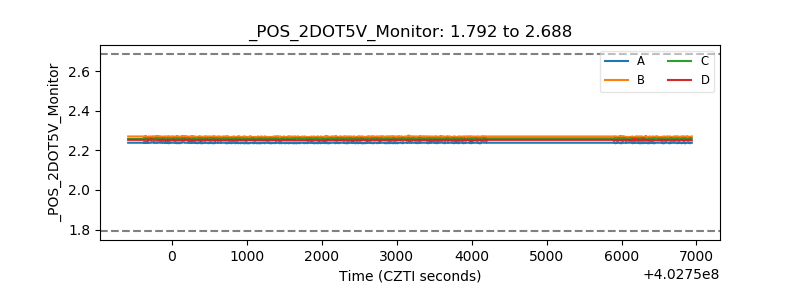 |
| +5 Volts monitor | 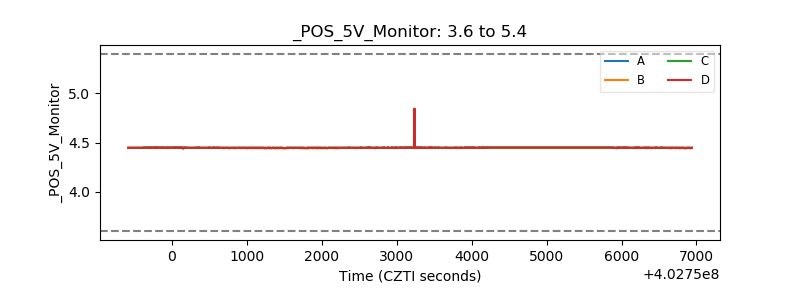 |
| _ROLL_ROT | 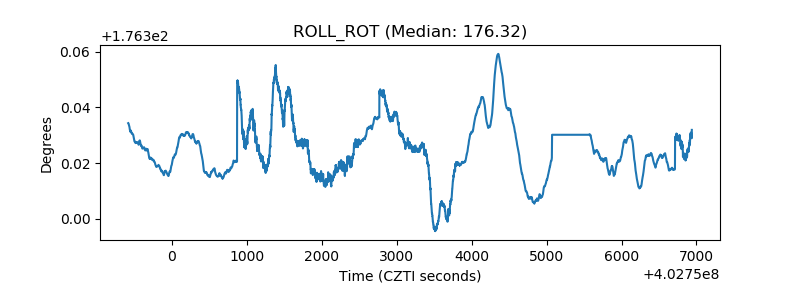 |
| _Roll_DEC | 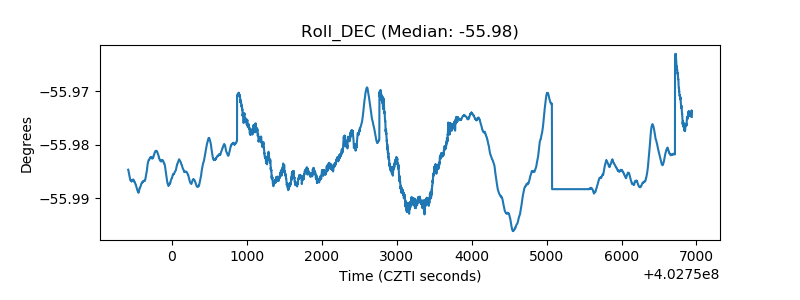 |
| _Roll_RA | 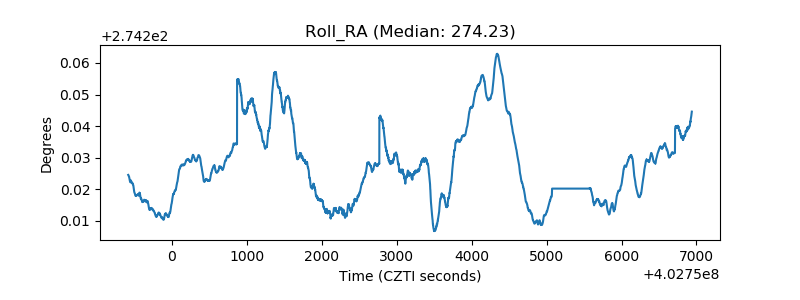 |
| Veto Counter | 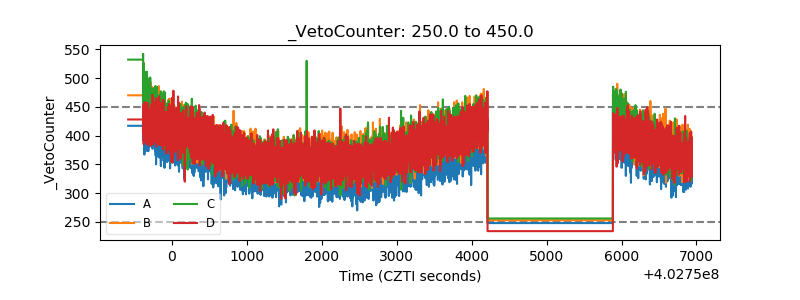 |