| Param | Original file | Final file |
|---|---|---|
| Filename | modeM0/AS1A11_082T01_9000005356_37974cztM0_level2.fits | modeM0/AS1A11_082T01_9000005356_37974cztM0_level2_quad_clean.evt |
| Size (bytes) | 428,371,200 | 73,175,040 |
| Size | 408.5 MB | 69.8 MB |
| Events in quadrant A | 5,642,199 | 459,144 |
| Events in quadrant B | 3,454,791 | 467,011 |
| Events in quadrant C | 2,929,331 | 463,620 |
| Events in quadrant D | 3,380,423 | 420,063 |
| Mode M0 | |||
|---|---|---|---|
| Quadrant | BADHDUFLAG | Total packets | Discarded packets |
| A | 0 | 21014 | 3 |
| B | 0 | 14156 | 2 |
| C | 0 | 12325 | 2 |
| D | 0 | 13871 | 2 |
| Mode SS | |||
|---|---|---|---|
| Quadrant | BADHDUFLAG | Total packets | Discarded packets |
| A | 0 | 118 | 0 |
| B | 0 | 118 | 0 |
| C | 0 | 118 | 0 |
| D | 0 | 118 | 0 |
| Mode M9 | |||
|---|---|---|---|
| Quadrant | BADHDUFLAG | Total packets | Discarded packets |
| A | 0 | 16 | 0 |
| B | 0 | 16 | 0 |
| C | 0 | 16 | 0 |
| D | 0 | 17 | 0 |
| Quadrant | Total seconds | Saturated seconds | Saturation percentage |
|---|---|---|---|
| A | 5802 | 61 | 1.051362% |
| B | 5802 | 124 | 2.137194% |
| C | 5802 | 30 | 0.517063% |
| D | 5802 | 119 | 2.051017% |
Noise dominated data is calculated using 1-second bins in cleaned event files. If a bin has >2000 counts, and if more than 50% of those come from <1% of pixels, then it is considered to be noise-dominated and hence unusable.
| Quadrant | # 1 sec bins | Bins with >0 counts | Bins with >2000 counts | High rate bins dominated by noise | Noise dominated (total time) | Noise dominated (detector-on time) | Marked lightcurve |
|---|---|---|---|---|---|---|---|
| A | 7175 | 5804 | 34 | 34 | 0.47% | 0.59% | 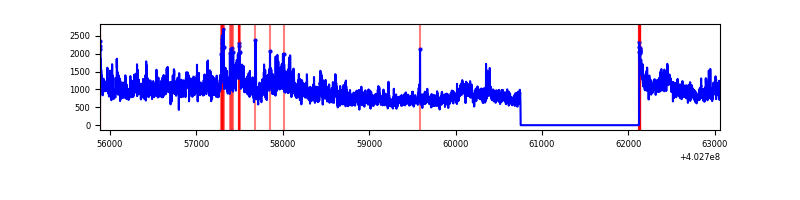 |
| B | 7175 | 5804 | 80 | 80 | 1.11% | 1.38% | 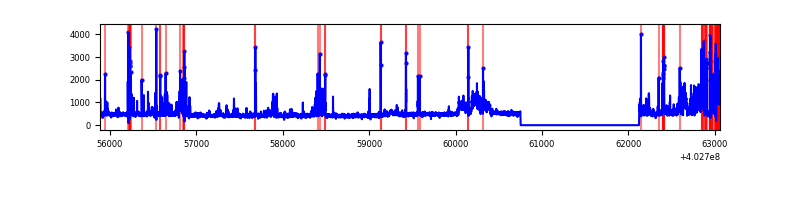 |
| C | 7175 | 5804 | 13 | 13 | 0.18% | 0.22% | 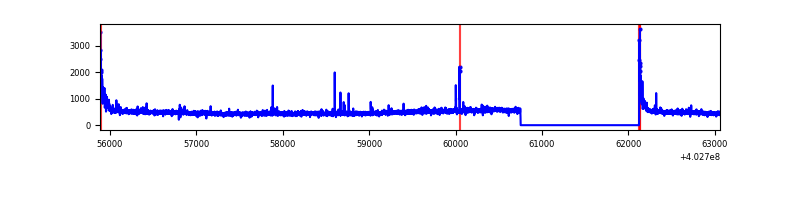 |
| D | 7175 | 5804 | 108 | 108 | 1.51% | 1.86% | 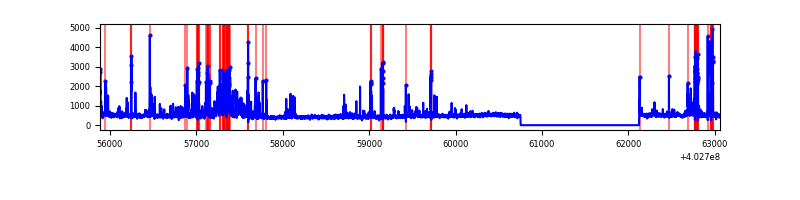 |
Top three noisy pixels from each quadrant. If the there are fewer than three noisy pixels in the level2.evt file, extra rows are filled as -1
| Pixel properties | Quadrant properties | ||||||
|---|---|---|---|---|---|---|---|
| Quadrant | DetID | PixID | Counts | Sigma | Mean | Median | Sigma |
| A | 15 | 222 | 2584346 | 19543.81 | 648 | 637 | 132.2 |
| A | 10 | 83 | 414477 | 3130.39 | 648 | 637 | 132.2 |
| A | 12 | 16 | 69991 | 524.61 | 648 | 637 | 132.2 |
| B | 5 | 184 | 379451 | 3063.73 | 647 | 631 | 123.6 |
| B | 5 | 200 | 182963 | 1474.62 | 647 | 631 | 123.6 |
| B | 4 | 81 | 98444 | 791.07 | 647 | 631 | 123.6 |
| C | 15 | 214 | 248862 | 1675.89 | 636 | 639 | 148.1 |
| C | 0 | 10 | 146704 | 986.17 | 636 | 639 | 148.1 |
| C | 14 | 254 | 35989 | 238.67 | 636 | 639 | 148.1 |
| D | 2 | 249 | 253819 | 1639.29 | 631 | 614 | 154.5 |
| D | 10 | 199 | 206479 | 1332.8 | 631 | 614 | 154.5 |
| D | 12 | 233 | 176438 | 1138.31 | 631 | 614 | 154.5 |
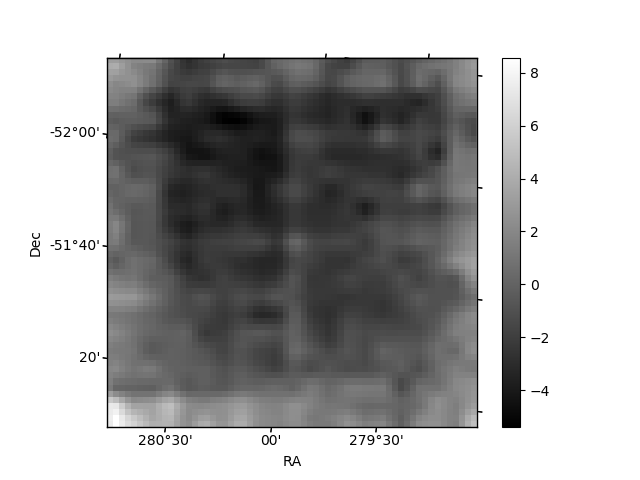
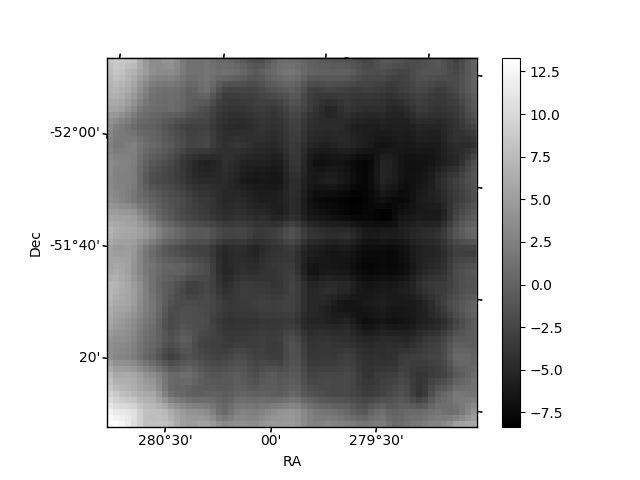
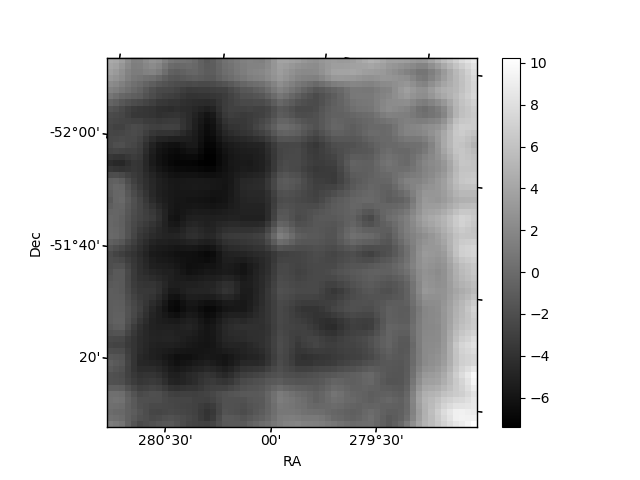
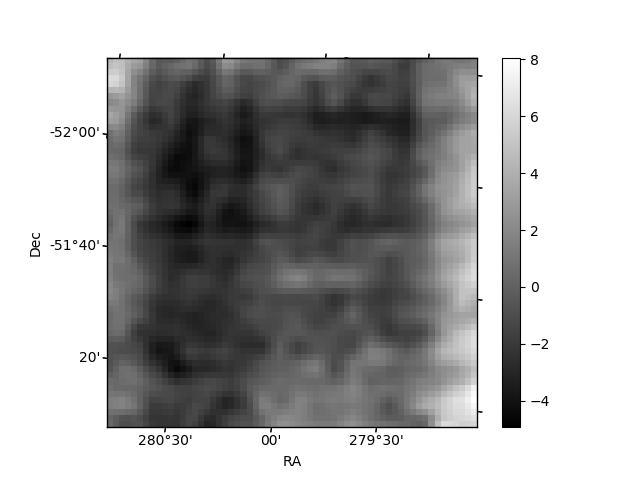
Histogram calculated using DETX and DETY for each event in the final _common_clean file
| Quadrant A | 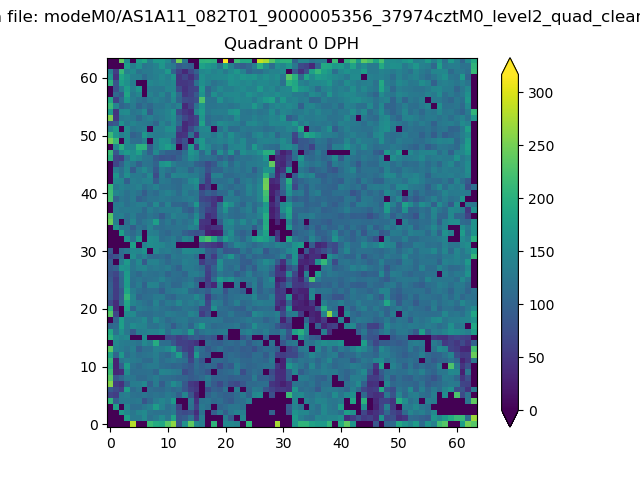 |
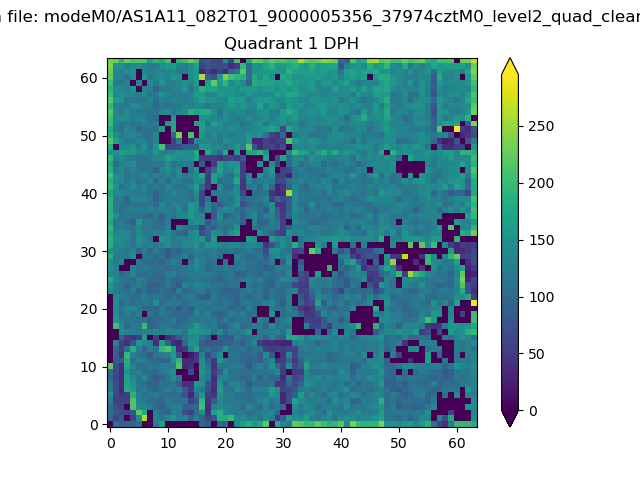 |
Quadrant B |
|---|---|---|---|
| Quadrant D | 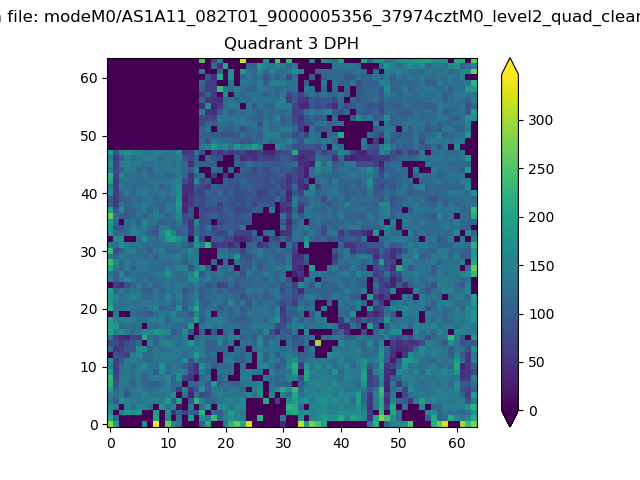 |
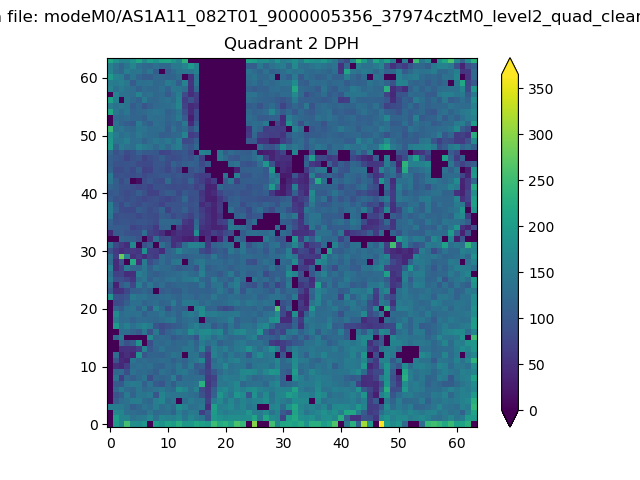 |
Quadrant C |
| Plot type | Count rate plots | Images |
|---|---|---|
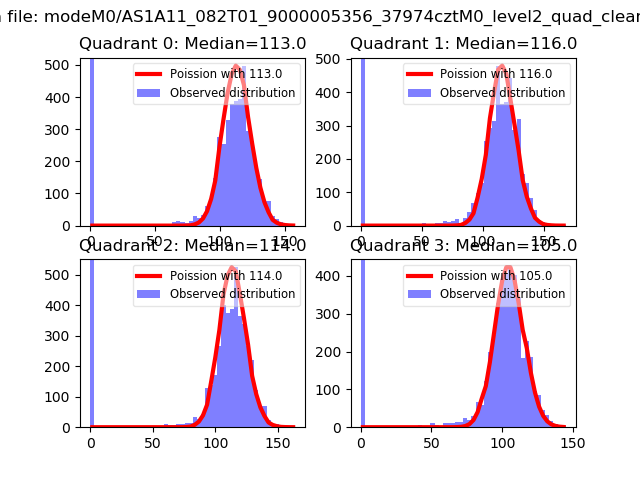
| Comparison with Poisson distribution Blue bars denote a histogram of data divided into 1 sec bins. Red curve is a Poisson curve with rate = median count rate of data. |
 |
 |
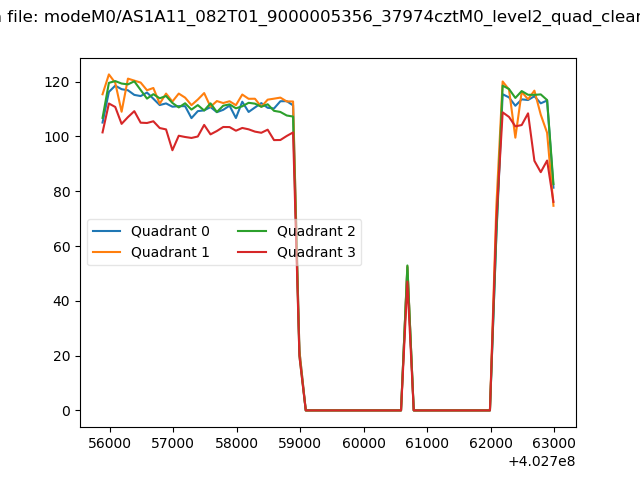
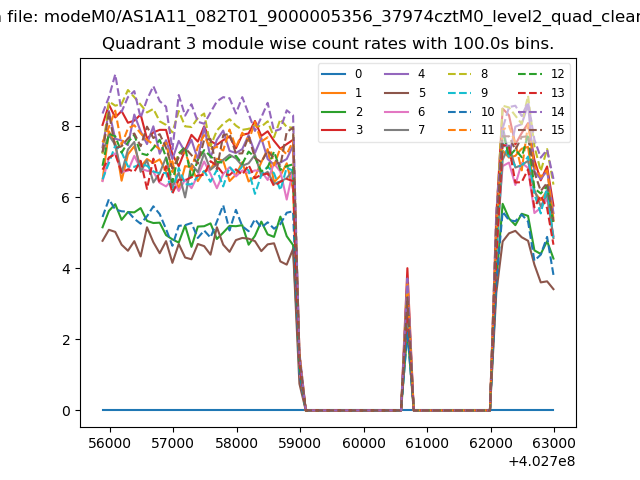
| Quadrant-wise count rates Data is divided into 100 sec bins |
 |
|
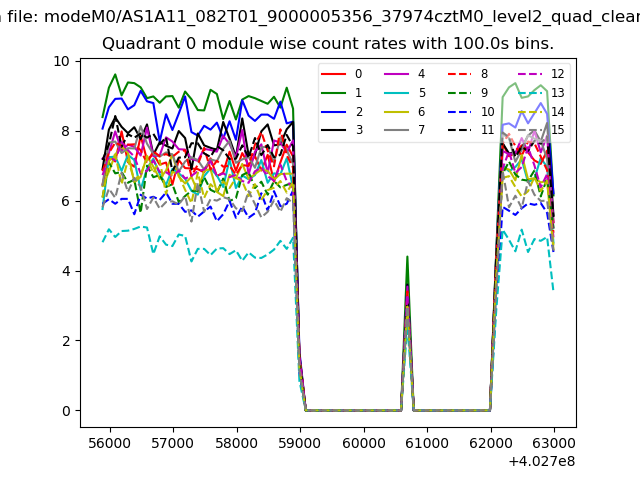
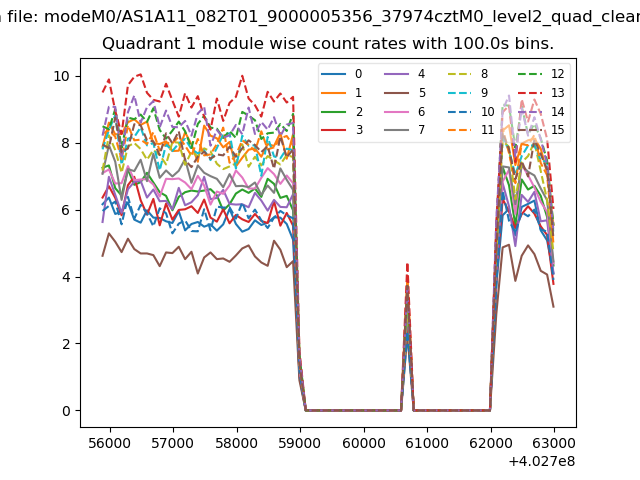
| Module-wise count rates for Quadrant A Data is divided into 100 sec bins |
 |
 |
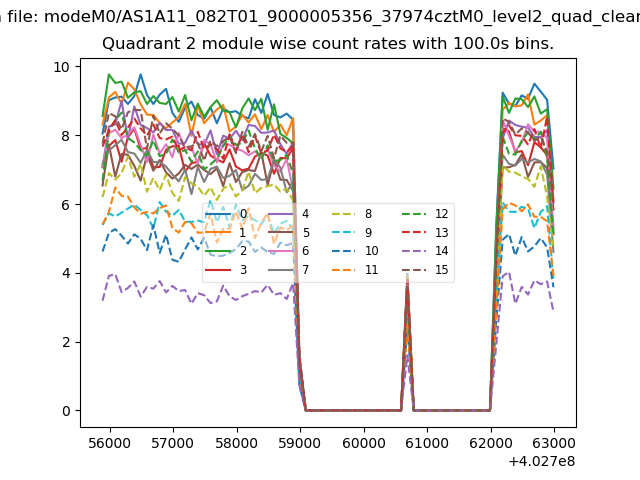
| Module-wise count rates for Quadrant B Data is divided into 100 sec bins |
 |
 |
| Module-wise count rates for Quadrant C Data is divided into 100 sec bins |
 |
 |
| Module-wise count rates for Quadrant D Data is divided into 100 sec bins |
 |
 |
| Parameter | Plot |
|---|---|
| CZT HV Monitor |  |
| D_VDD | 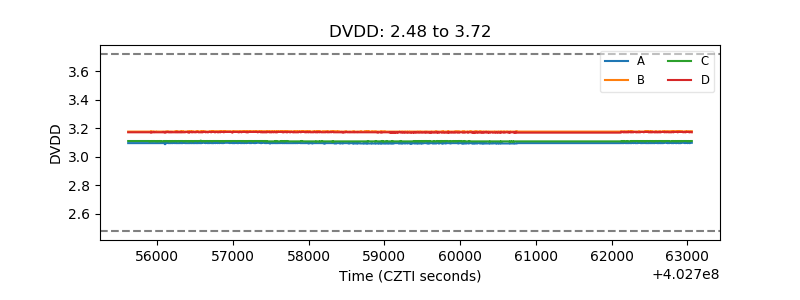 |
| Temperature 1 | 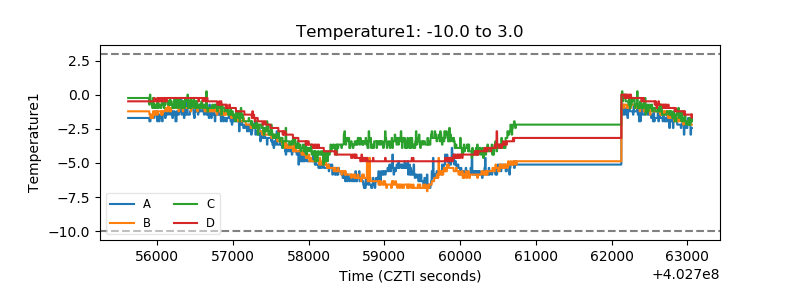 |
| Veto HV Monitor | 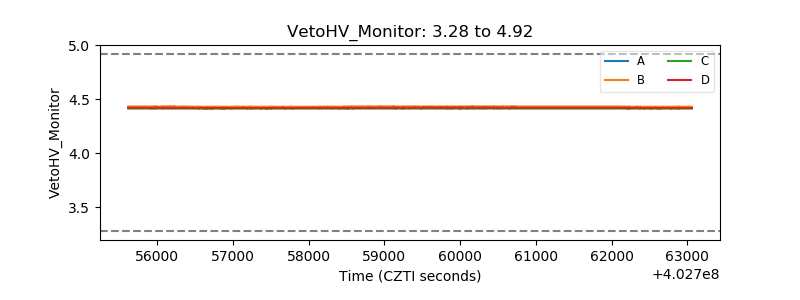 |
| Veto LLD | 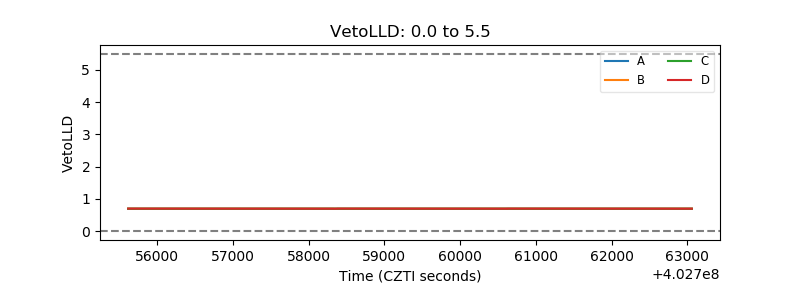 |
| Alpha Counter | 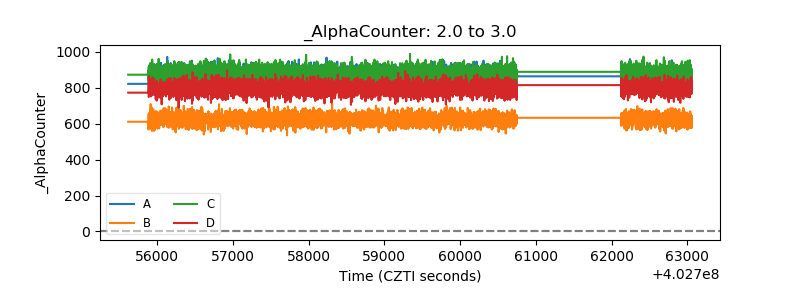 |
| _CPM_Rate | 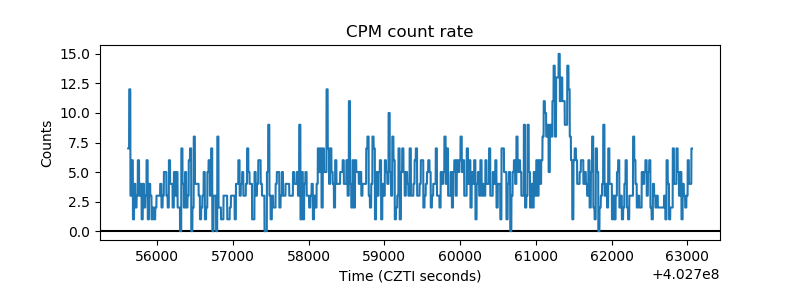 |
| CZT Counter | 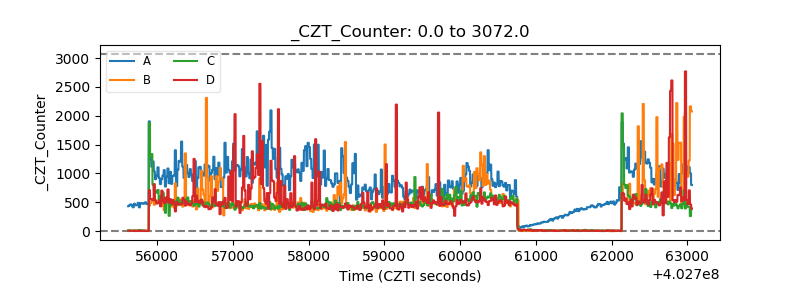 |
| +2.5 Volts monitor | 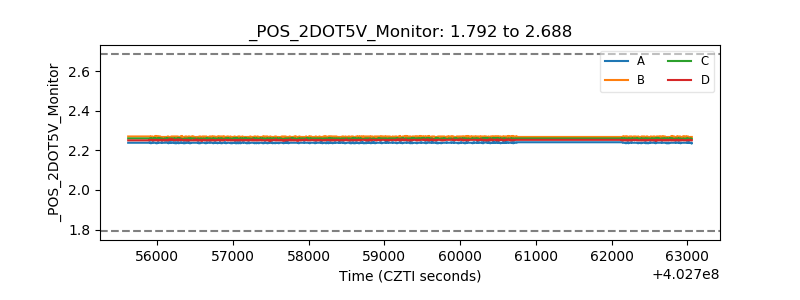 |
| +5 Volts monitor | 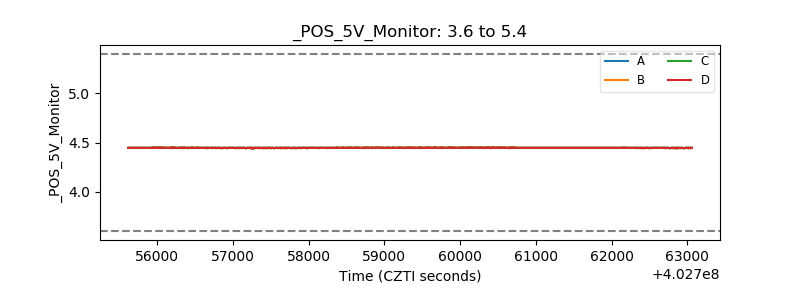 |
| _ROLL_ROT |  |
| _Roll_DEC | 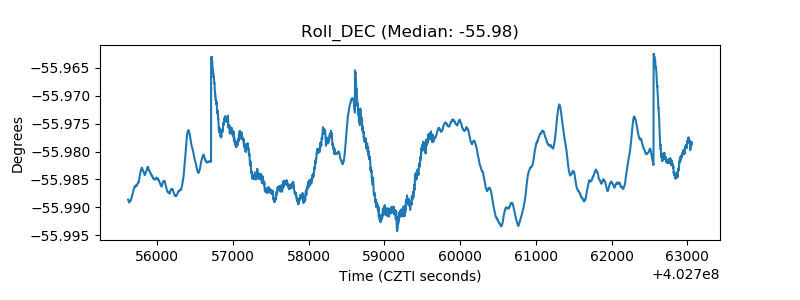 |
| _Roll_RA | 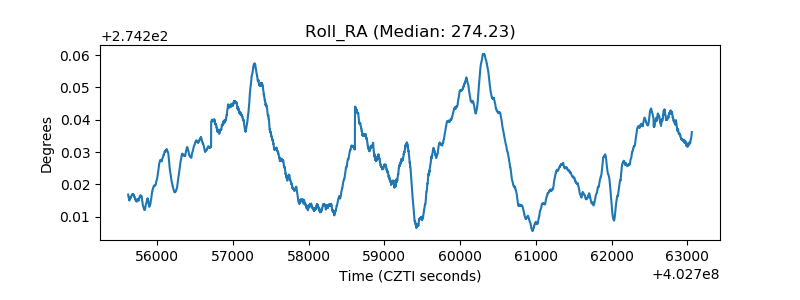 |
| Veto Counter |  |