| Param | Original file | Final file |
|---|---|---|
| Filename | modeM0/AS1A11_082T01_9000005356_37975cztM0_level2.evt | modeM0/AS1A11_082T01_9000005356_37975cztM0_level2_quad_clean.evt |
| Size (bytes) | 519,056,640 | 78,811,200 |
| Size | 495.0 MB | 75.2 MB |
| Events in quadrant A | 5,413,231 | 483,820 |
| Events in quadrant B | 3,839,910 | 499,481 |
| Events in quadrant C | 2,943,595 | 510,850 |
| Events in quadrant D | 3,127,250 | 483,864 |
| Mode M0 | |||
|---|---|---|---|
| Quadrant | BADHDUFLAG | Total packets | Discarded packets |
| A | 0 | 20474 | 3 |
| B | 0 | 15284 | 2 |
| C | 0 | 12406 | 2 |
| D | 0 | 13020 | 2 |
| Mode SS | |||
|---|---|---|---|
| Quadrant | BADHDUFLAG | Total packets | Discarded packets |
| A | 0 | 118 | 0 |
| B | 0 | 118 | 0 |
| C | 0 | 118 | 0 |
| D | 0 | 118 | 0 |
| Mode M9 | |||
|---|---|---|---|
| Quadrant | BADHDUFLAG | Total packets | Discarded packets |
| A | 0 | 16 | 0 |
| B | 0 | 16 | 0 |
| C | 0 | 16 | 0 |
| D | 0 | 17 | 0 |
| Quadrant | Total seconds | Saturated seconds | Saturation percentage |
|---|---|---|---|
| A | 5846 | 140 | 2.394800% |
| B | 5846 | 188 | 3.215874% |
| C | 5846 | 35 | 0.598700% |
| D | 5846 | 90 | 1.539514% |
Noise dominated data is calculated using 1-second bins in cleaned event files. If a bin has >2000 counts, and if more than 50% of those come from <1% of pixels, then it is considered to be noise-dominated and hence unusable.
| Quadrant | # 1 sec bins | Bins with >0 counts | Bins with >2000 counts | High rate bins dominated by noise | Noise dominated (total time) | Noise dominated (detector-on time) | Marked lightcurve |
|---|---|---|---|---|---|---|---|
| A | 7128 | 5847 | 99 | 99 | 1.39% | 1.69% | 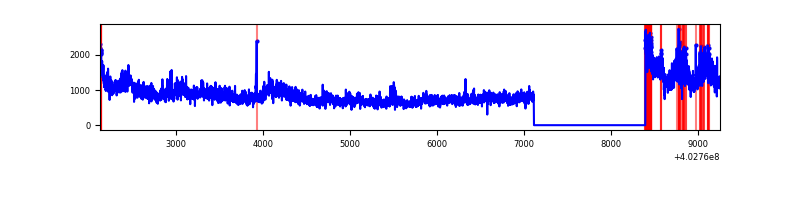 |
| B | 7128 | 5847 | 134 | 134 | 1.88% | 2.29% | 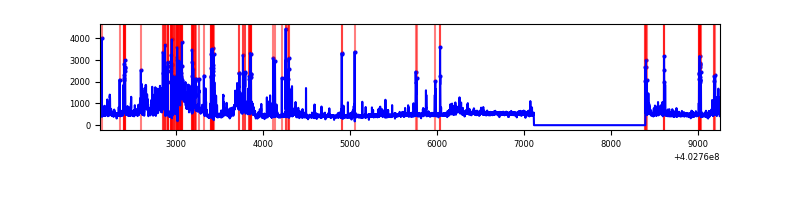 |
| C | 7128 | 5847 | 29 | 29 | 0.41% | 0.50% | 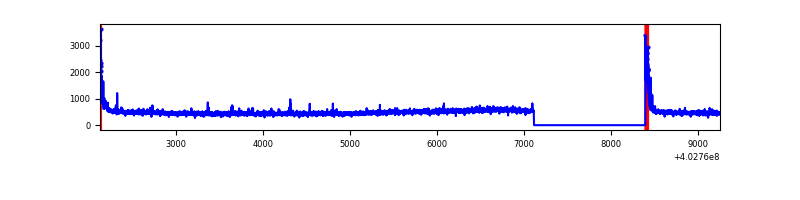 |
| D | 7128 | 5847 | 57 | 57 | 0.80% | 0.97% | 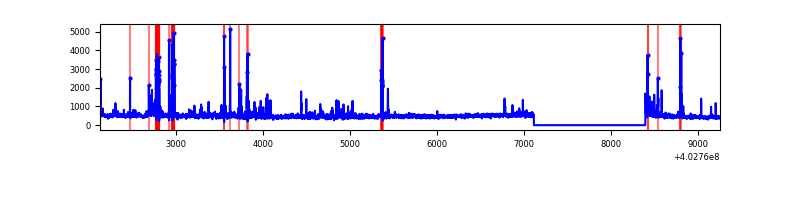 |
Top three noisy pixels from each quadrant. If the there are fewer than three noisy pixels in the level2.evt file, extra rows are filled as -1
| Pixel properties | Quadrant properties | ||||||
|---|---|---|---|---|---|---|---|
| Quadrant | DetID | PixID | Counts | Sigma | Mean | Median | Sigma |
| A | 15 | 222 | 2374828 | 17804.68 | 653 | 641 | 133.3 |
| A | 10 | 83 | 406983 | 3047.27 | 653 | 641 | 133.3 |
| A | 12 | 16 | 62902 | 466.91 | 653 | 641 | 133.3 |
| B | 5 | 184 | 605859 | 4797.8 | 651 | 633 | 126.1 |
| B | 0 | 229 | 137312 | 1083.49 | 651 | 633 | 126.1 |
| B | 12 | 18 | 123567 | 974.53 | 651 | 633 | 126.1 |
| C | 15 | 214 | 248354 | 1651.35 | 641 | 645 | 150.0 |
| C | 0 | 10 | 154199 | 1023.67 | 641 | 645 | 150.0 |
| C | 14 | 254 | 24189 | 156.96 | 641 | 645 | 150.0 |
| D | 7 | 223 | 200187 | 1290.69 | 636 | 619 | 154.6 |
| D | 10 | 199 | 170245 | 1097.04 | 636 | 619 | 154.6 |
| D | 13 | 249 | 68063 | 436.19 | 636 | 619 | 154.6 |
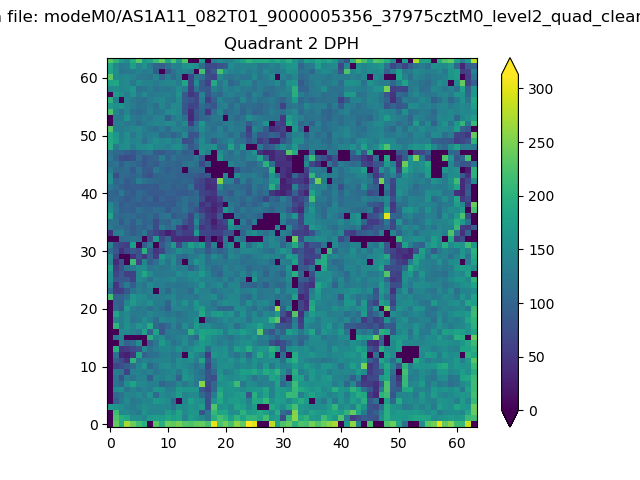
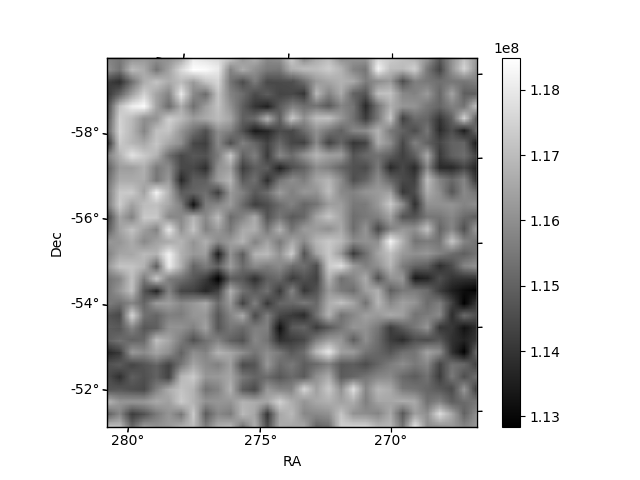
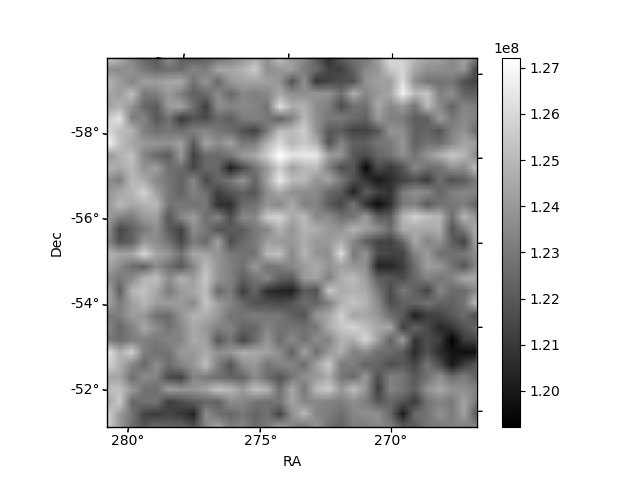
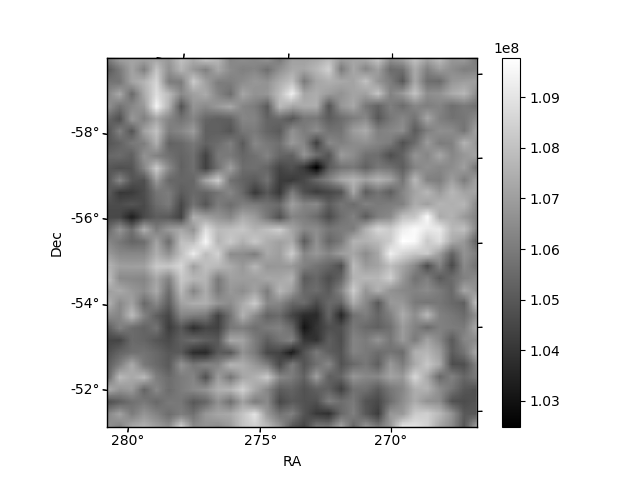
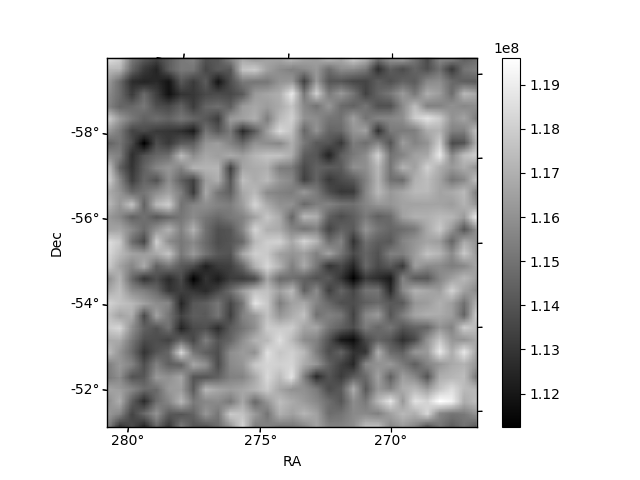
Histogram calculated using DETX and DETY for each event in the final _common_clean file
| Quadrant A | 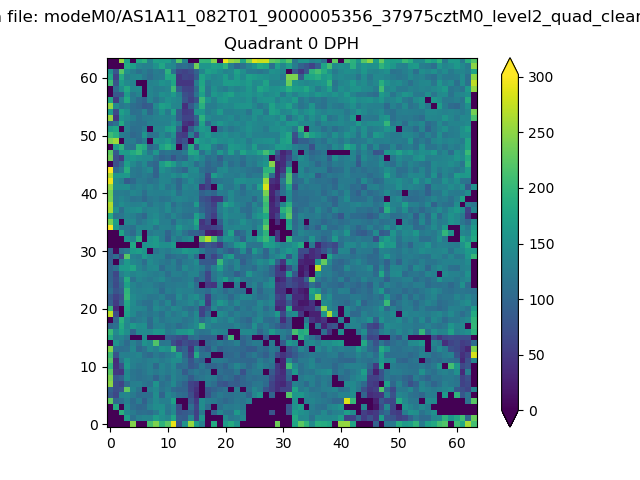 |
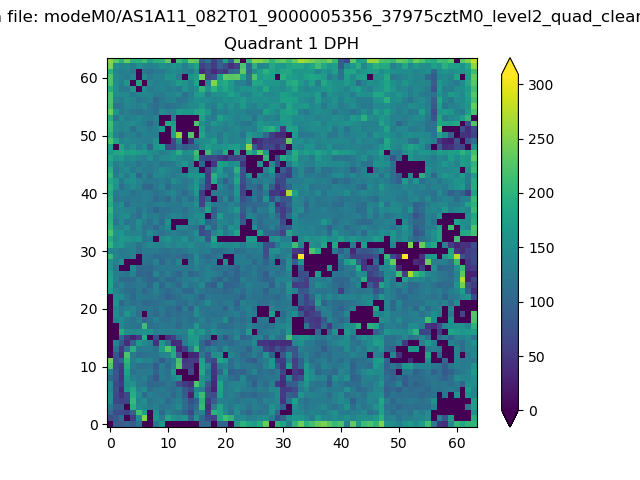 |
Quadrant B |
|---|---|---|---|
| Quadrant D | 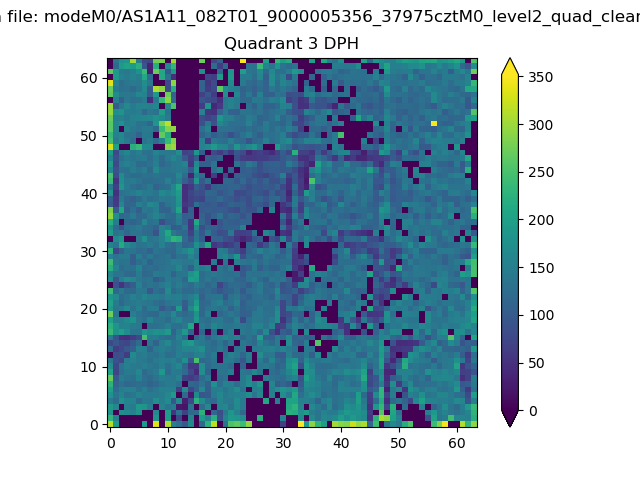 |
 |
Quadrant C |
| Plot type | Count rate plots | Images |
|---|---|---|
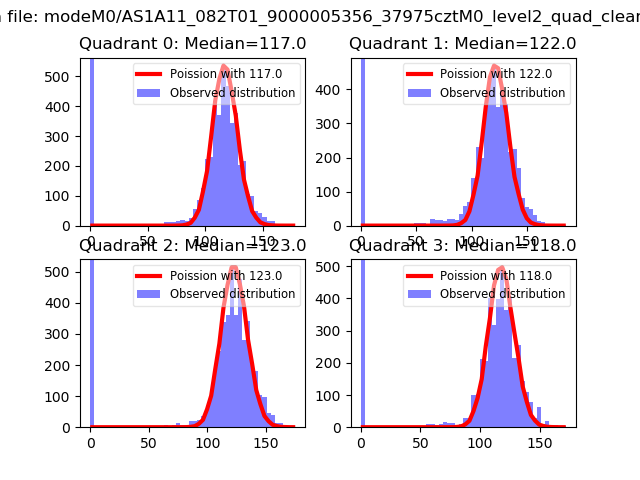
| Comparison with Poisson distribution Blue bars denote a histogram of data divided into 1 sec bins. Red curve is a Poisson curve with rate = median count rate of data. |
 |
 |
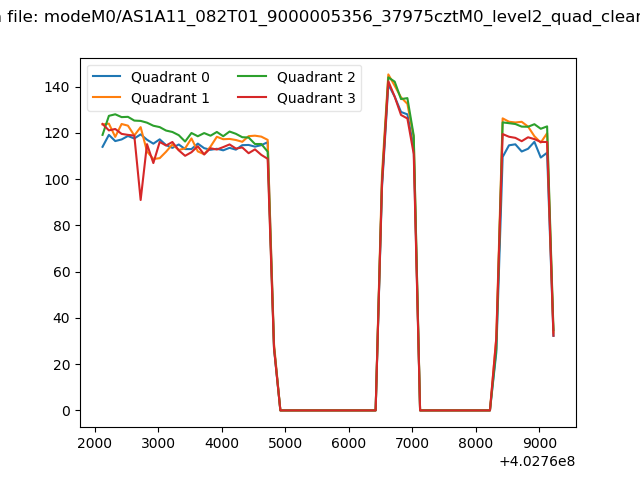
| Quadrant-wise count rates Data is divided into 100 sec bins |
 |
|
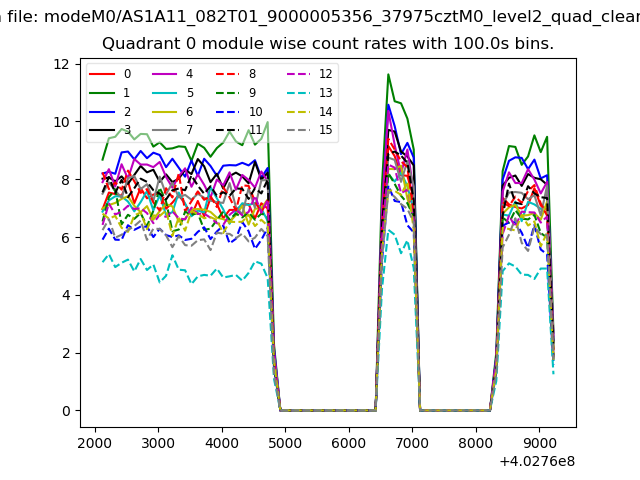
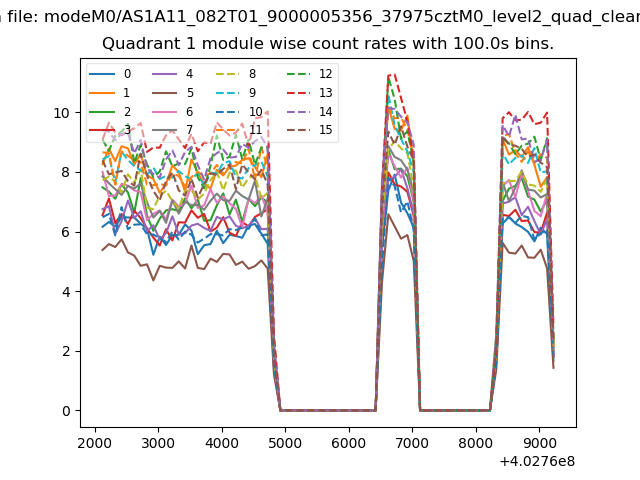
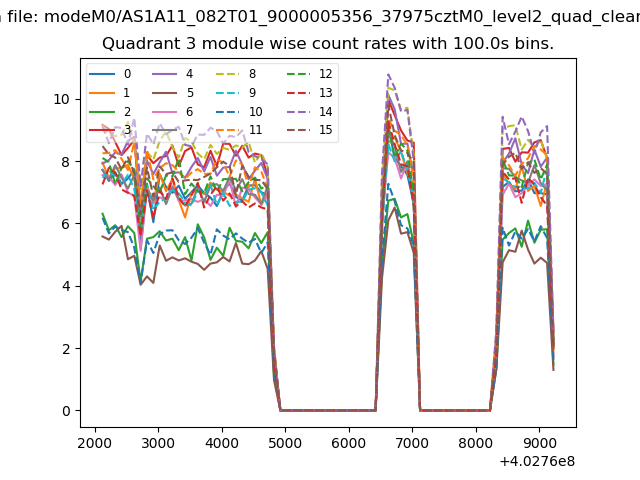
| Module-wise count rates for Quadrant A Data is divided into 100 sec bins |
 |
 |
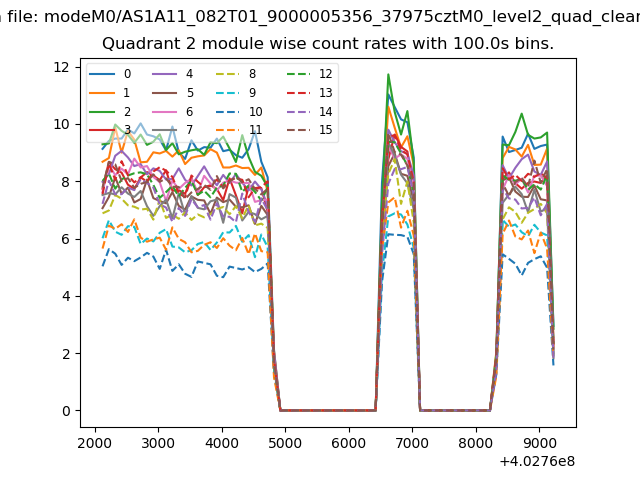
| Module-wise count rates for Quadrant B Data is divided into 100 sec bins |
 |
 |
| Module-wise count rates for Quadrant C Data is divided into 100 sec bins |
 |
 |
| Module-wise count rates for Quadrant D Data is divided into 100 sec bins |
 |
 |
| Parameter | Plot |
|---|---|
| CZT HV Monitor | 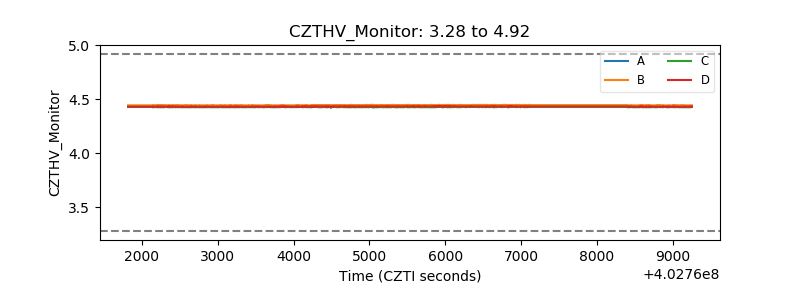 |
| D_VDD | 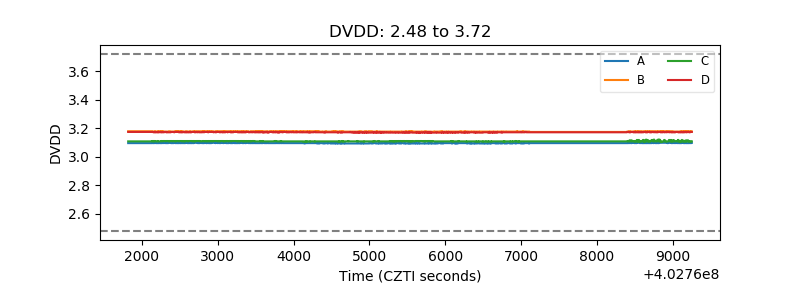 |
| Temperature 1 | 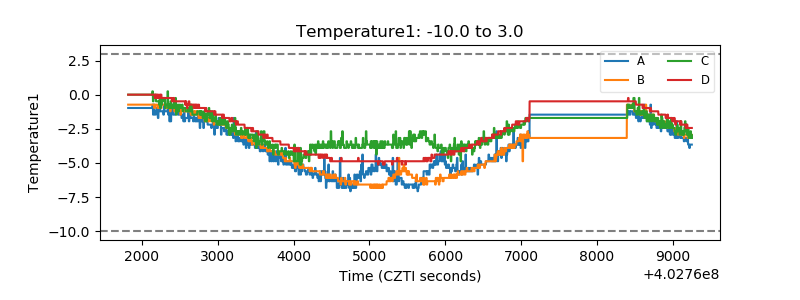 |
| Veto HV Monitor | 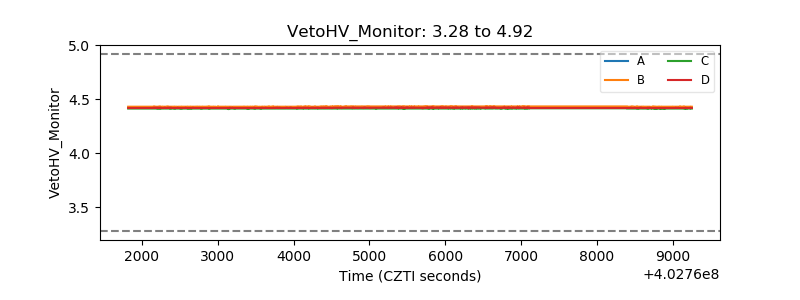 |
| Veto LLD | 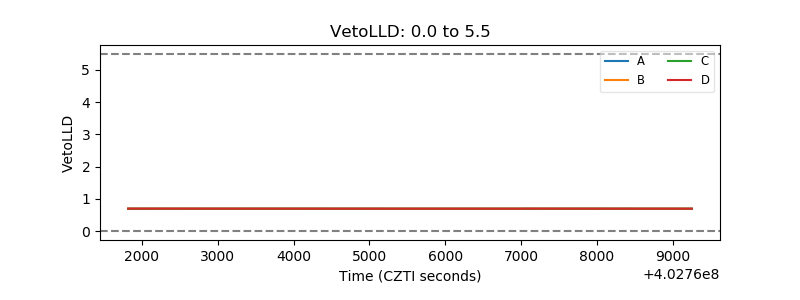 |
| Alpha Counter | 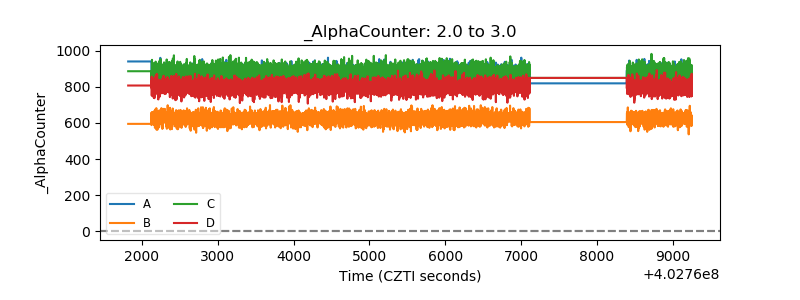 |
| _CPM_Rate | 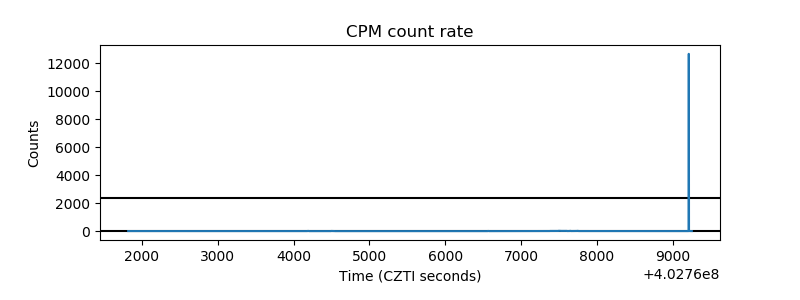 |
| CZT Counter | 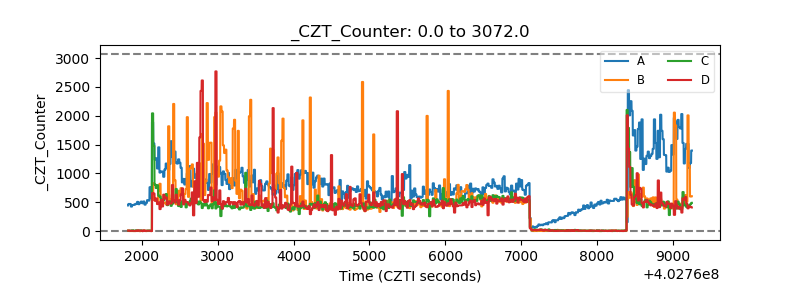 |
| +2.5 Volts monitor |  |
| +5 Volts monitor | 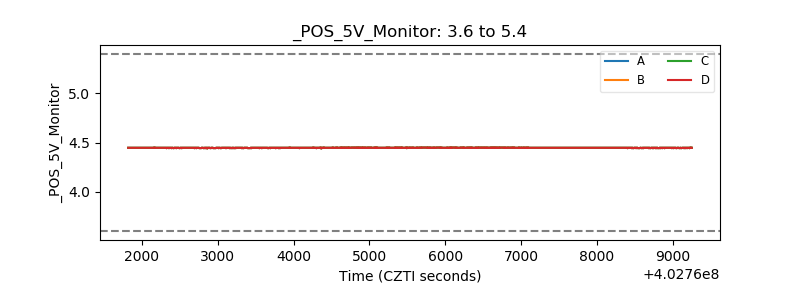 |
| _ROLL_ROT | 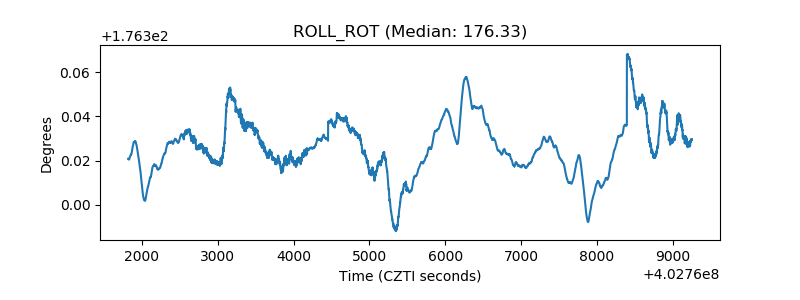 |
| _Roll_DEC | 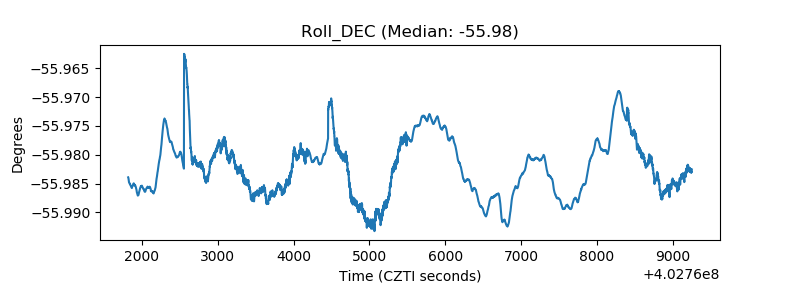 |
| _Roll_RA | 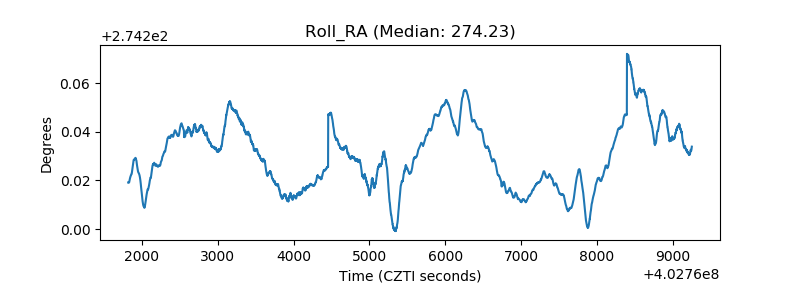 |
| Veto Counter | 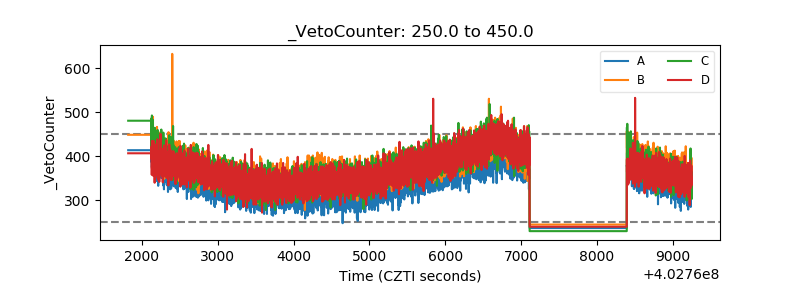 |