| Param | Original file | Final file |
|---|---|---|
| Filename | modeM0/AS1A11_082T01_9000005356_37978cztM0_level2.fits | modeM0/AS1A11_082T01_9000005356_37978cztM0_level2_quad_clean.evt |
| Size (bytes) | 1,121,420,160 | 186,278,400 |
| Size | 1.0 GB | 177.6 MB |
| Events in quadrant A | 16,400,522 | 1,140,718 |
| Events in quadrant B | 8,013,502 | 1,198,472 |
| Events in quadrant C | 7,540,388 | 1,172,514 |
| Events in quadrant D | 8,361,627 | 1,060,172 |
| Mode M0 | |||
|---|---|---|---|
| Quadrant | BADHDUFLAG | Total packets | Discarded packets |
| A | 0 | 59731 | 5 |
| B | 0 | 34065 | 4 |
| C | 0 | 31988 | 4 |
| D | 0 | 35714 | 4 |
| Mode SS | |||
|---|---|---|---|
| Quadrant | BADHDUFLAG | Total packets | Discarded packets |
| A | 0 | 316 | 0 |
| B | 0 | 316 | 0 |
| C | 0 | 316 | 0 |
| D | 0 | 316 | 0 |
| Mode M9 | |||
|---|---|---|---|
| Quadrant | BADHDUFLAG | Total packets | Discarded packets |
| A | 0 | 44 | 0 |
| B | 0 | 44 | 0 |
| C | 0 | 44 | 0 |
| D | 0 | 45 | 0 |
| Quadrant | Total seconds | Saturated seconds | Saturation percentage |
|---|---|---|---|
| A | 15471 | 608 | 3.929933% |
| B | 15471 | 209 | 1.350915% |
| C | 15471 | 32 | 0.206839% |
| D | 15471 | 300 | 1.939112% |
Noise dominated data is calculated using 1-second bins in cleaned event files. If a bin has >2000 counts, and if more than 50% of those come from <1% of pixels, then it is considered to be noise-dominated and hence unusable.
| Quadrant | # 1 sec bins | Bins with >0 counts | Bins with >2000 counts | High rate bins dominated by noise | Noise dominated (total time) | Noise dominated (detector-on time) | Marked lightcurve |
|---|---|---|---|---|---|---|---|
| A | 19679 | 15474 | 459 | 459 | 2.33% | 2.97% | 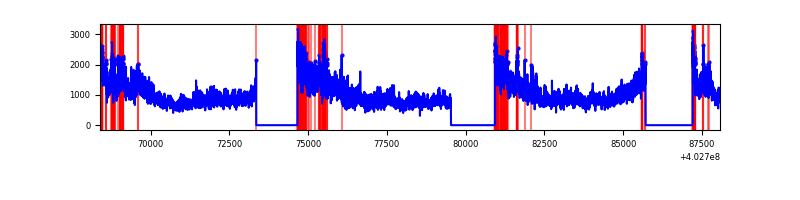 |
| B | 19679 | 15474 | 120 | 120 | 0.61% | 0.78% | 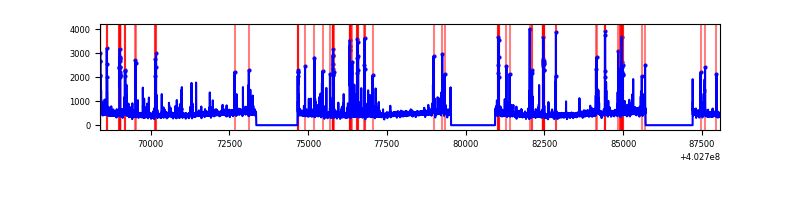 |
| C | 19679 | 15474 | 27 | 27 | 0.14% | 0.17% | 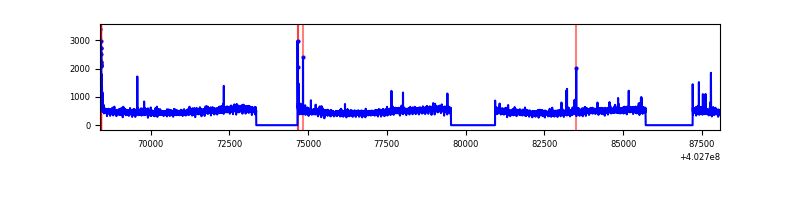 |
| D | 19679 | 15474 | 236 | 236 | 1.20% | 1.53% | 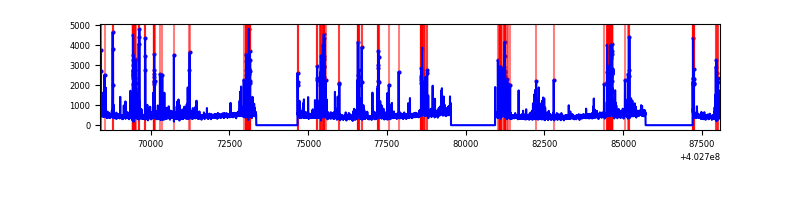 |
Top three noisy pixels from each quadrant. If the there are fewer than three noisy pixels in the level2.evt file, extra rows are filled as -1
| Pixel properties | Quadrant properties | ||||||
|---|---|---|---|---|---|---|---|
| Quadrant | DetID | PixID | Counts | Sigma | Mean | Median | Sigma |
| A | 15 | 222 | 8500980 | 24453.07 | 1728 | 1696 | 347.6 |
| A | 10 | 83 | 917474 | 2634.76 | 1728 | 1696 | 347.6 |
| A | 12 | 16 | 169407 | 482.52 | 1728 | 1696 | 347.6 |
| B | 5 | 172 | 416696 | 1257.66 | 1743 | 1697 | 330.0 |
| B | 5 | 184 | 218533 | 657.12 | 1743 | 1697 | 330.0 |
| B | 0 | 189 | 124471 | 372.07 | 1743 | 1697 | 330.0 |
| C | 15 | 214 | 650694 | 1625.59 | 1711 | 1723 | 399.2 |
| C | 0 | 10 | 117272 | 289.44 | 1711 | 1723 | 399.2 |
| C | 14 | 254 | 73300 | 179.29 | 1711 | 1723 | 399.2 |
| D | 10 | 199 | 450491 | 1107.05 | 1689 | 1642 | 405.4 |
| D | 5 | 157 | 383851 | 942.69 | 1689 | 1642 | 405.4 |
| D | 1 | 52 | 203149 | 497.0 | 1689 | 1642 | 405.4 |
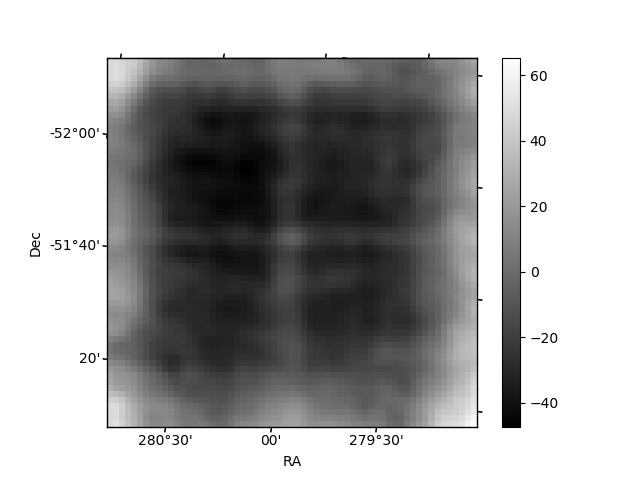
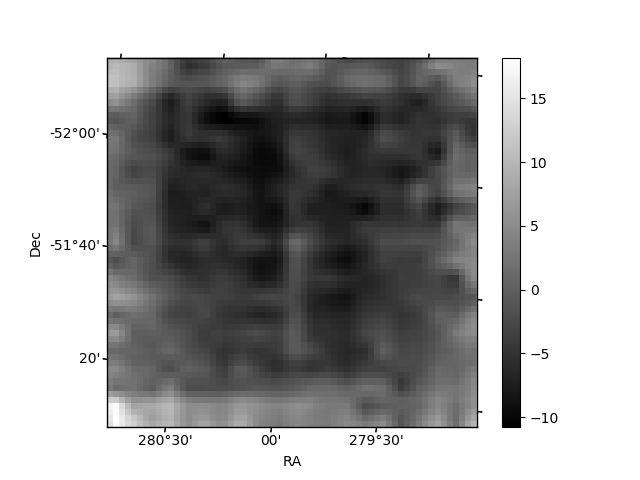
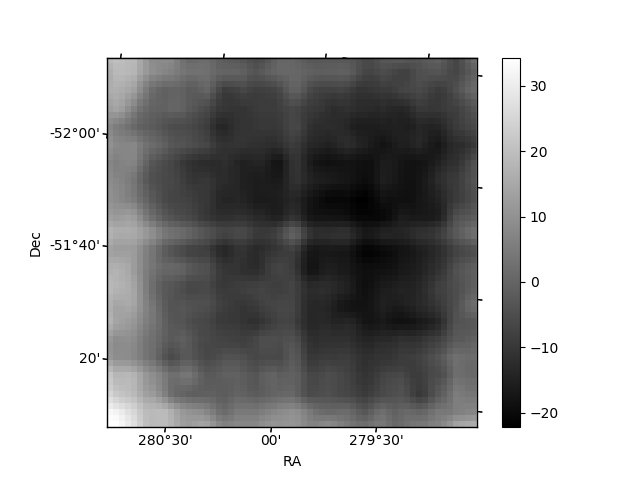
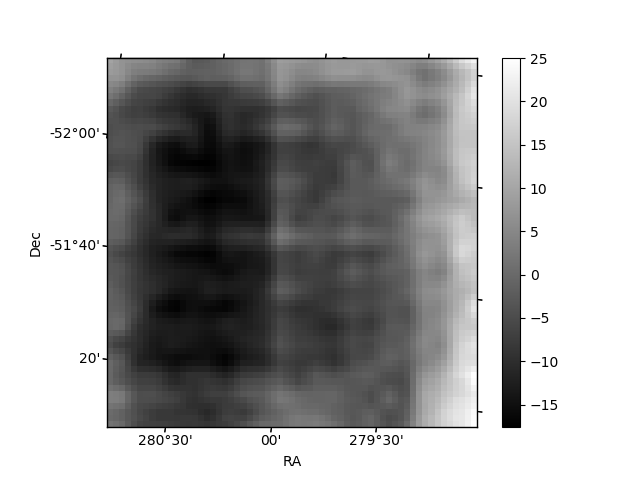
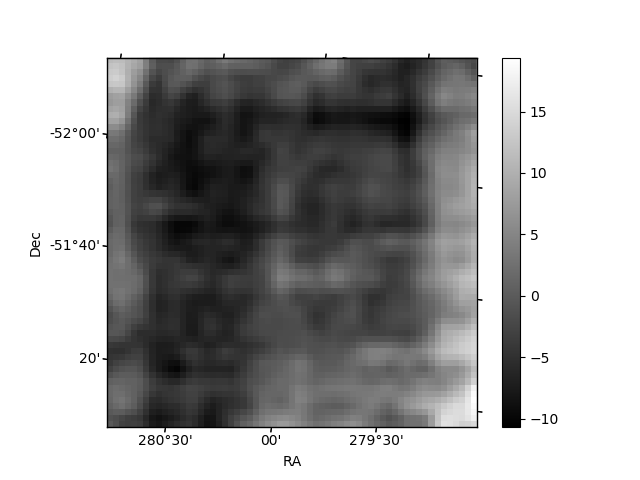
Histogram calculated using DETX and DETY for each event in the final _common_clean file
| Quadrant A | 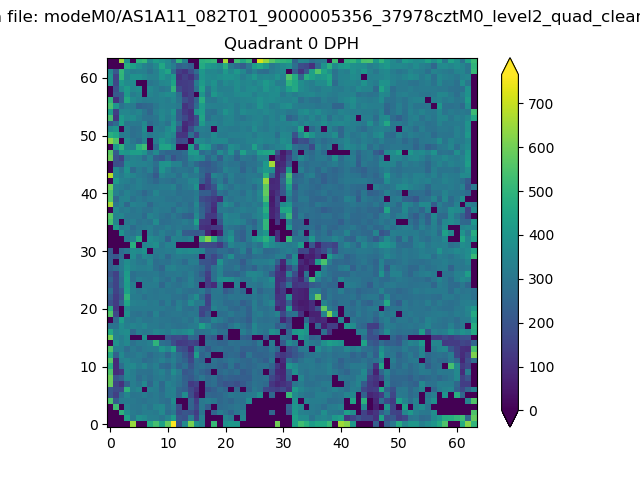 |
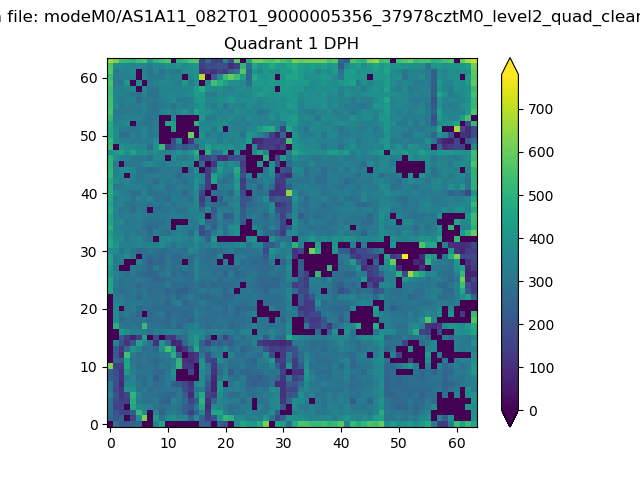 |
Quadrant B |
|---|---|---|---|
| Quadrant D | 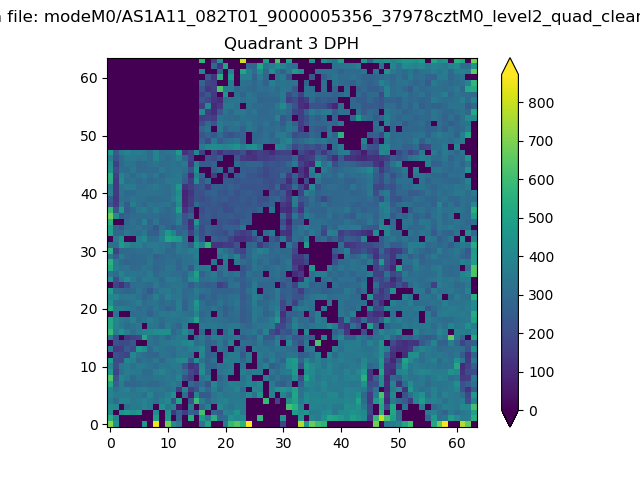 |
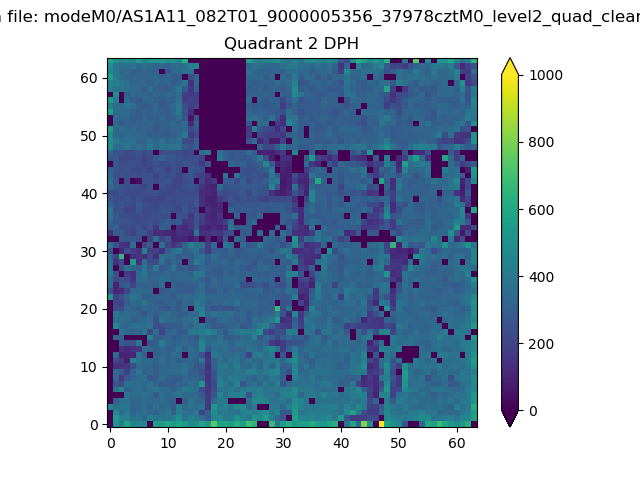 |
Quadrant C |
| Plot type | Count rate plots | Images |
|---|---|---|
| Comparison with Poisson distribution Blue bars denote a histogram of data divided into 1 sec bins. Red curve is a Poisson curve with rate = median count rate of data. |
 |
 |
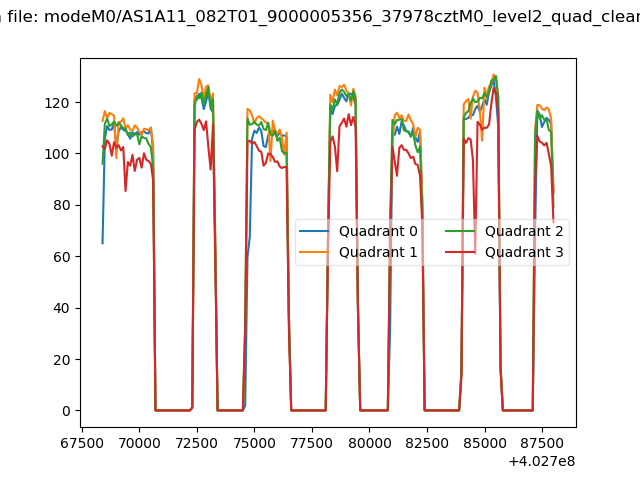
| Quadrant-wise count rates Data is divided into 100 sec bins |
 |
|
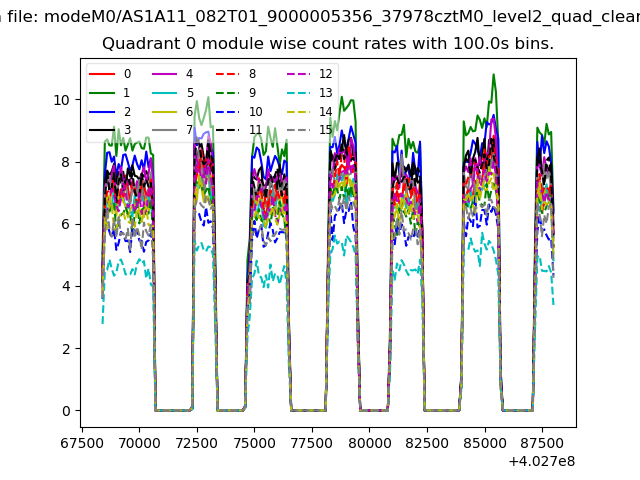
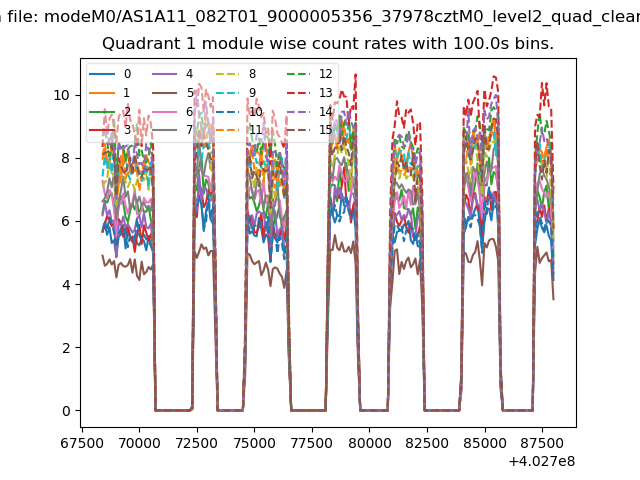
| Module-wise count rates for Quadrant A Data is divided into 100 sec bins |
 |
 |
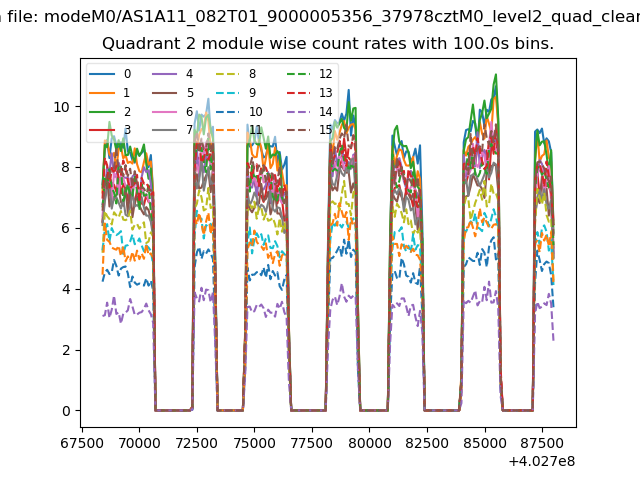
| Module-wise count rates for Quadrant B Data is divided into 100 sec bins |
 |
 |
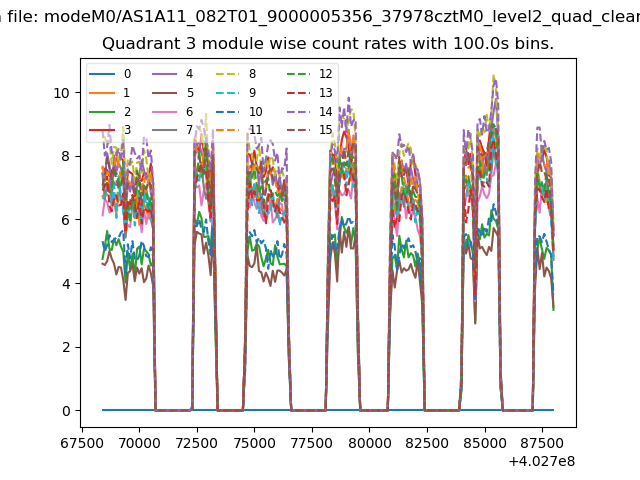
| Module-wise count rates for Quadrant C Data is divided into 100 sec bins |
 |
 |
| Module-wise count rates for Quadrant D Data is divided into 100 sec bins |
 |
 |
| Parameter | Plot |
|---|---|
| CZT HV Monitor | 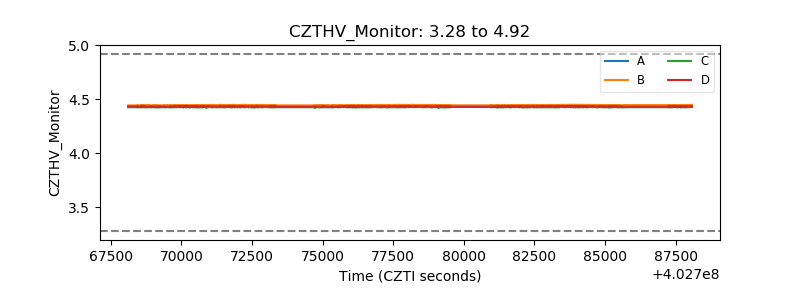 |
| D_VDD | 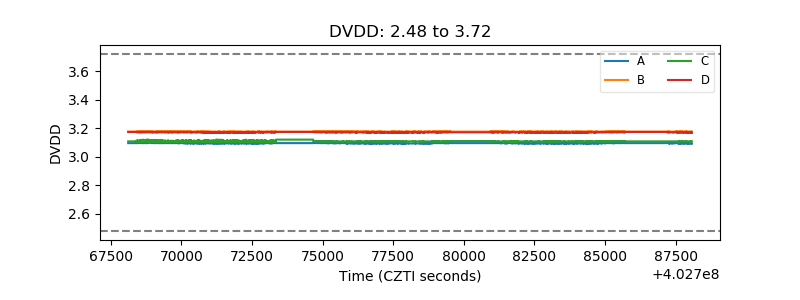 |
| Temperature 1 | 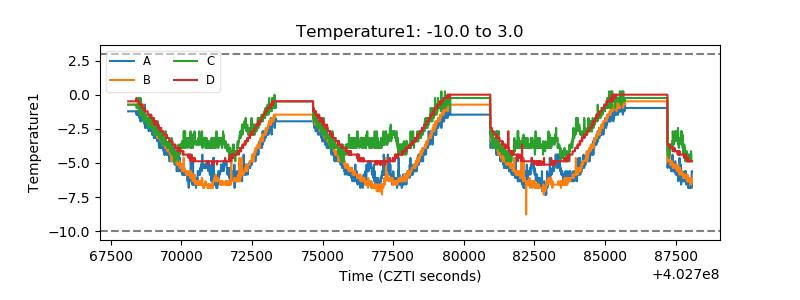 |
| Veto HV Monitor | 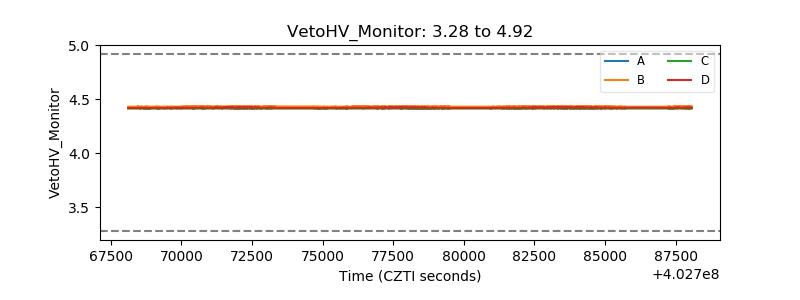 |
| Veto LLD | 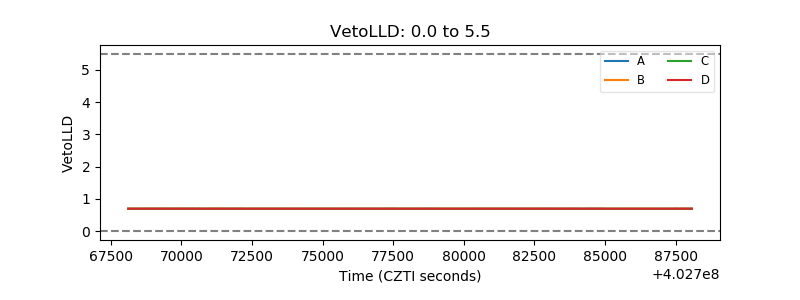 |
| Alpha Counter | 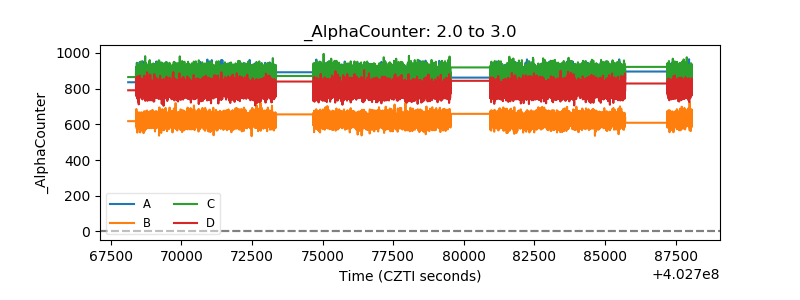 |
| _CPM_Rate | 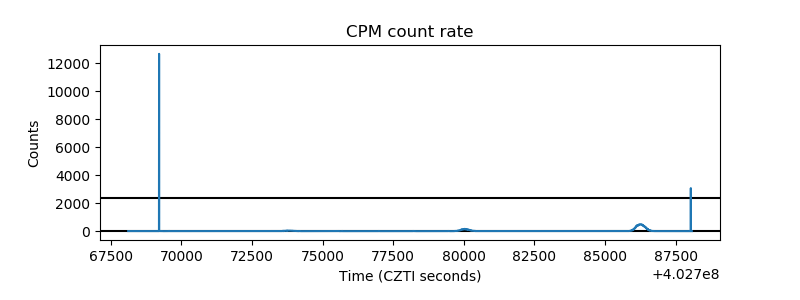 |
| CZT Counter | 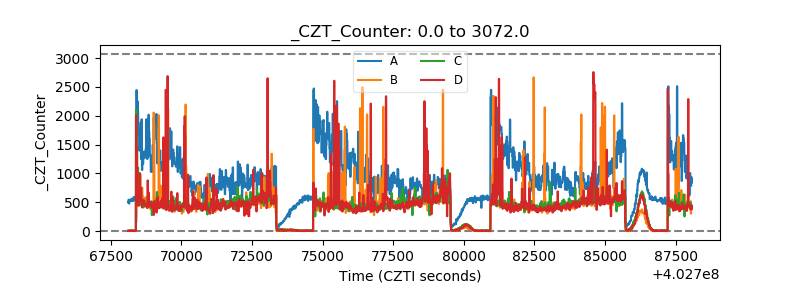 |
| +2.5 Volts monitor | 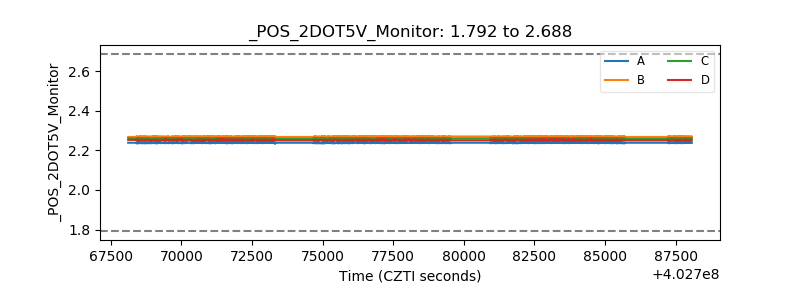 |
| +5 Volts monitor | 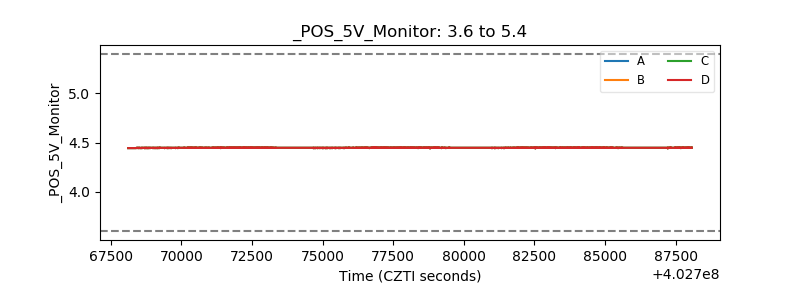 |
| _ROLL_ROT | 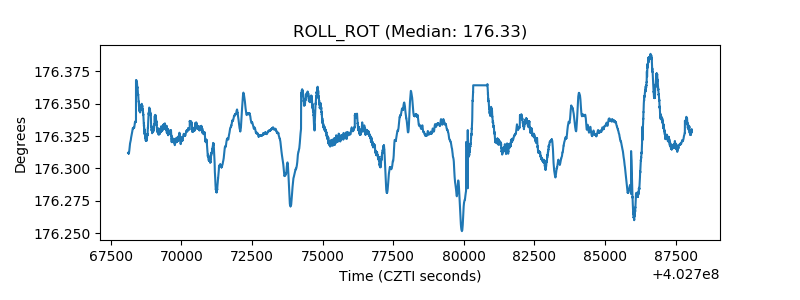 |
| _Roll_DEC | 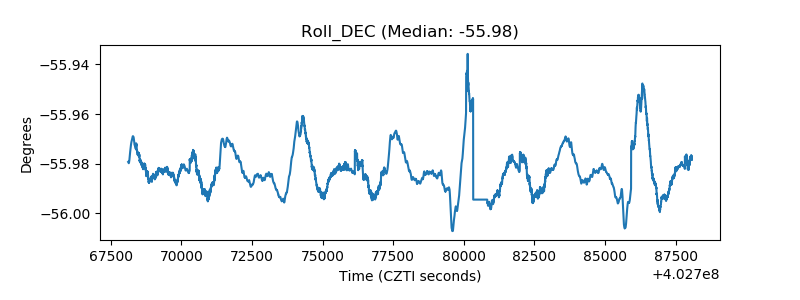 |
| _Roll_RA | 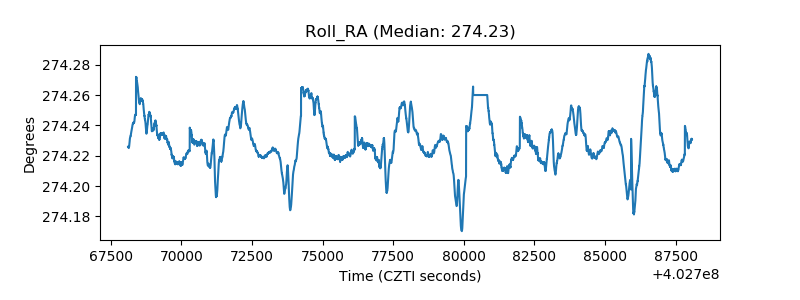 |
| Veto Counter | 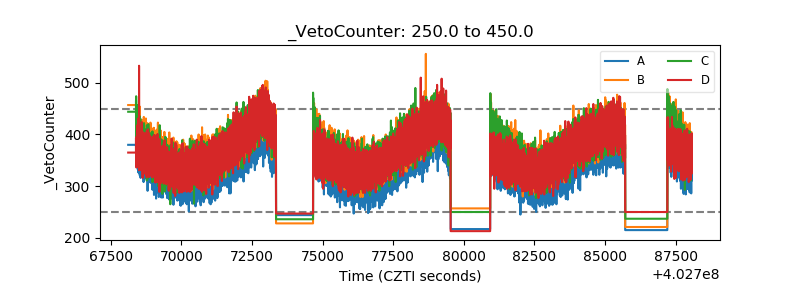 |