| Param | Original file | Final file |
|---|---|---|
| Filename | modeM0/AS1A11_082T01_9000005356_37979cztM0_level2.evt | modeM0/AS1A11_082T01_9000005356_37979cztM0_level2_quad_clean.evt |
| Size (bytes) | 501,791,040 | 63,717,120 |
| Size | 478.5 MB | 60.8 MB |
| Events in quadrant A | 6,258,299 | 379,339 |
| Events in quadrant B | 2,793,622 | 409,469 |
| Events in quadrant C | 2,737,057 | 399,920 |
| Events in quadrant D | 3,037,580 | 357,699 |
| Mode M0 | |||
|---|---|---|---|
| Quadrant | BADHDUFLAG | Total packets | Discarded packets |
| A | 0 | 22458 | 3 |
| B | 0 | 11931 | 2 |
| C | 0 | 11393 | 2 |
| D | 0 | 12860 | 2 |
| Mode SS | |||
|---|---|---|---|
| Quadrant | BADHDUFLAG | Total packets | Discarded packets |
| A | 0 | 114 | 0 |
| B | 0 | 114 | 0 |
| C | 0 | 114 | 0 |
| D | 0 | 114 | 0 |
| Mode M9 | |||
|---|---|---|---|
| Quadrant | BADHDUFLAG | Total packets | Discarded packets |
| A | 0 | 31 | 0 |
| B | 0 | 31 | 0 |
| C | 0 | 31 | 0 |
| D | 0 | 31 | 0 |
| Quadrant | Total seconds | Saturated seconds | Saturation percentage |
|---|---|---|---|
| A | 5464 | 308 | 5.636896% |
| B | 5464 | 52 | 0.951684% |
| C | 5464 | 10 | 0.183016% |
| D | 5464 | 107 | 1.958272% |
Noise dominated data is calculated using 1-second bins in cleaned event files. If a bin has >2000 counts, and if more than 50% of those come from <1% of pixels, then it is considered to be noise-dominated and hence unusable.
| Quadrant | # 1 sec bins | Bins with >0 counts | Bins with >2000 counts | High rate bins dominated by noise | Noise dominated (total time) | Noise dominated (detector-on time) | Marked lightcurve |
|---|---|---|---|---|---|---|---|
| A | 8602 | 5466 | 194 | 194 | 2.26% | 3.55% | 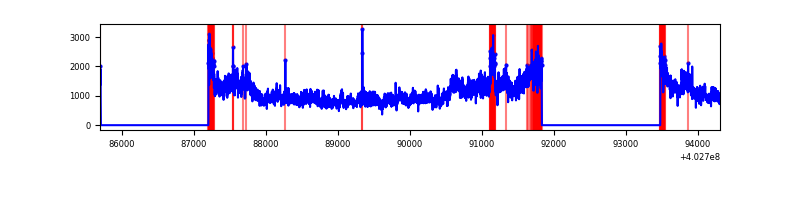 |
| B | 8602 | 5466 | 34 | 34 | 0.40% | 0.62% | 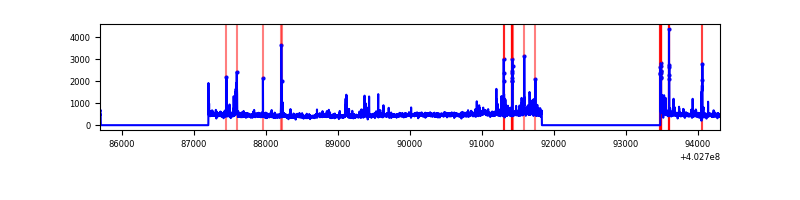 |
| C | 8602 | 5466 | 5 | 5 | 0.06% | 0.09% | 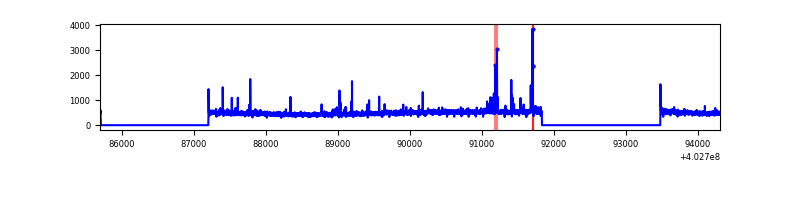 |
| D | 8602 | 5466 | 87 | 87 | 1.01% | 1.59% | 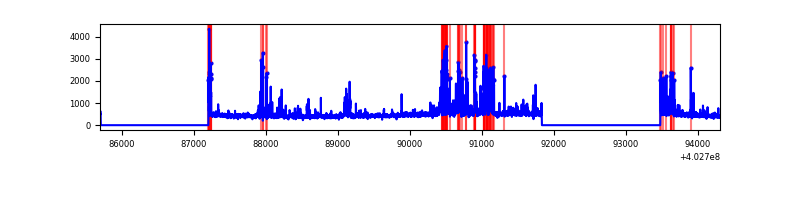 |
Top three noisy pixels from each quadrant. If the there are fewer than three noisy pixels in the level2.evt file, extra rows are filled as -1
| Pixel properties | Quadrant properties | ||||||
|---|---|---|---|---|---|---|---|
| Quadrant | DetID | PixID | Counts | Sigma | Mean | Median | Sigma |
| A | 15 | 222 | 3475369 | 27937.11 | 609 | 597 | 124.4 |
| A | 10 | 83 | 359576 | 2886.19 | 609 | 597 | 124.4 |
| A | 13 | 6 | 17179 | 133.32 | 609 | 597 | 124.4 |
| B | 5 | 172 | 154819 | 1290.12 | 617 | 602 | 119.5 |
| B | 5 | 200 | 55079 | 455.73 | 617 | 602 | 119.5 |
| B | 5 | 184 | 54830 | 453.65 | 617 | 602 | 119.5 |
| C | 15 | 214 | 233764 | 1640.49 | 608 | 613 | 142.1 |
| C | 14 | 254 | 42591 | 295.36 | 608 | 613 | 142.1 |
| C | 2 | 16 | 42559 | 295.14 | 608 | 613 | 142.1 |
| D | 12 | 227 | 261496 | 1774.71 | 601 | 583 | 147.0 |
| D | 2 | 250 | 98360 | 665.07 | 601 | 583 | 147.0 |
| D | 10 | 118 | 72902 | 491.91 | 601 | 583 | 147.0 |
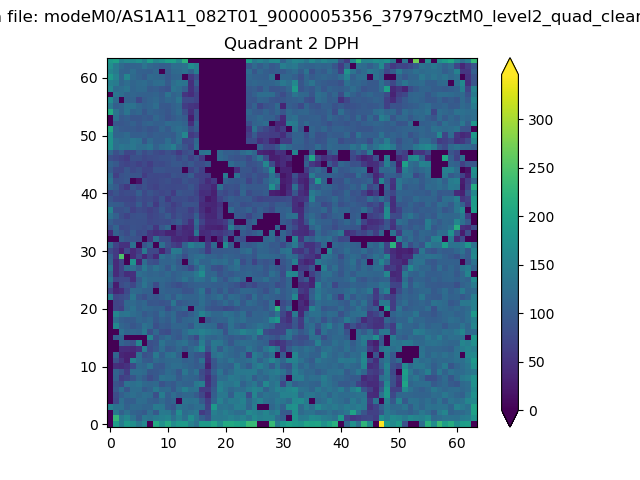
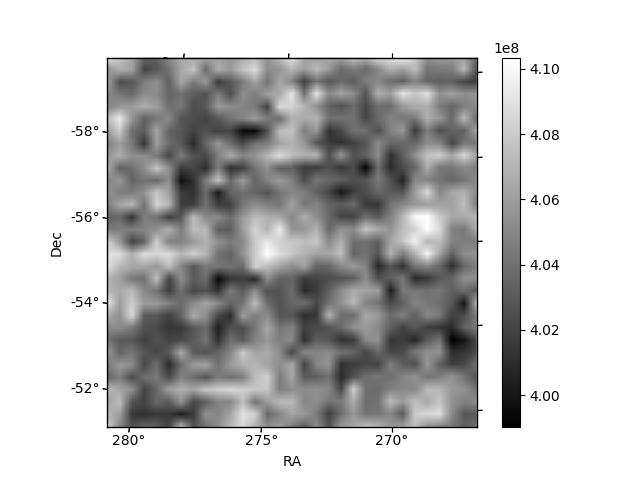
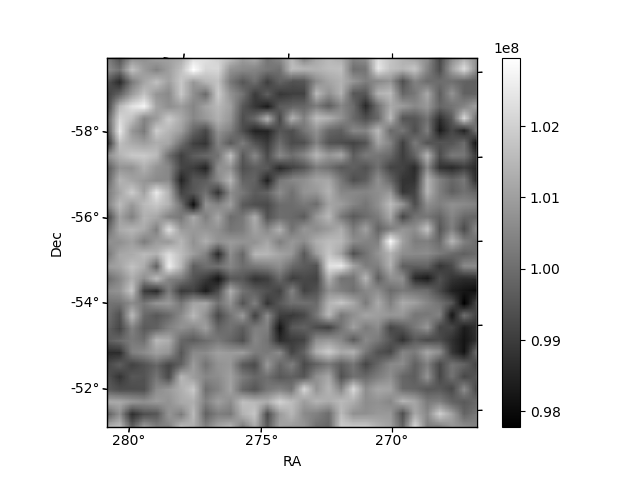
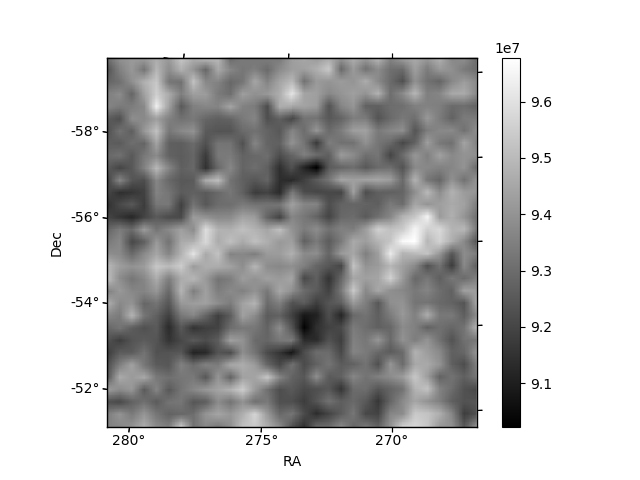
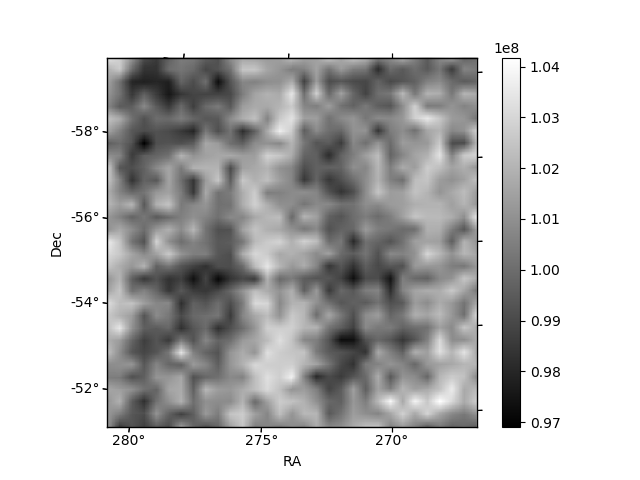
Histogram calculated using DETX and DETY for each event in the final _common_clean file
| Quadrant A | 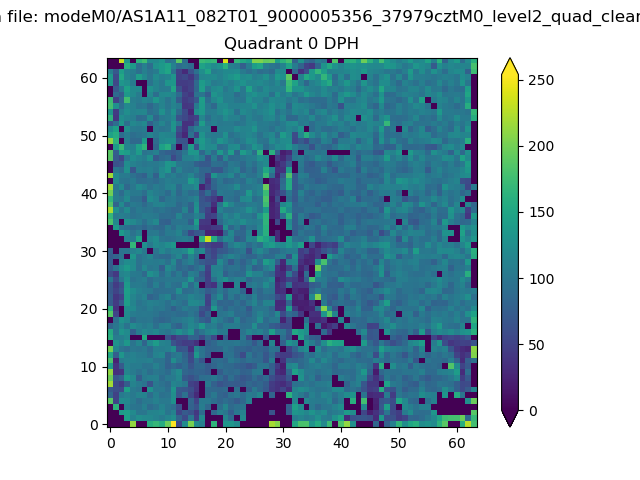 |
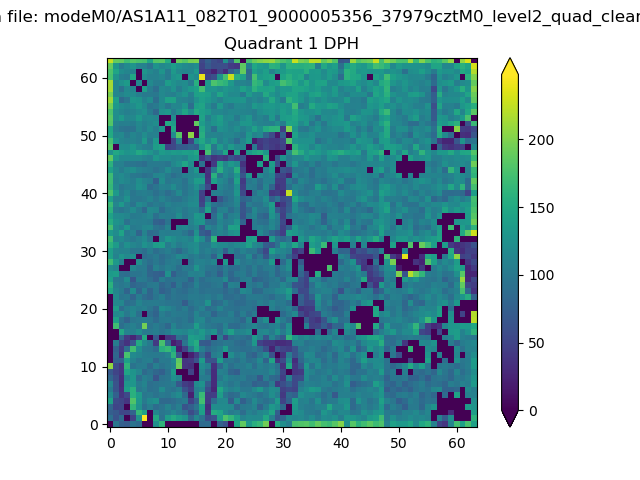 |
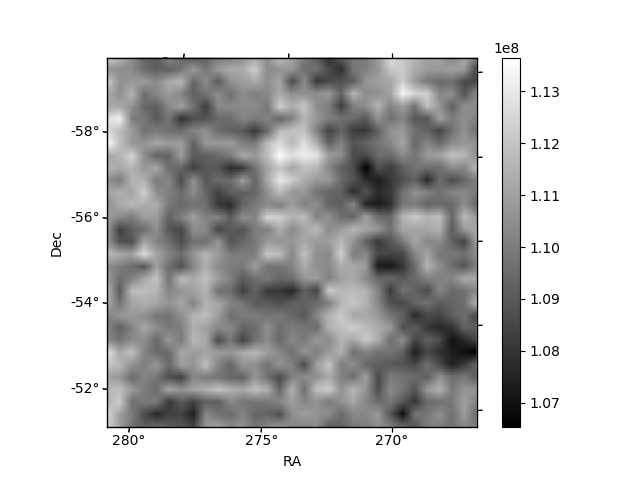
Quadrant B |
|---|---|---|---|
| Quadrant D | 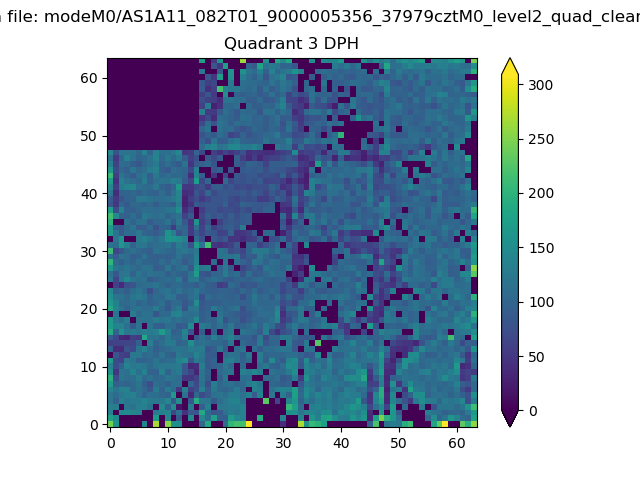 |
 |
Quadrant C |
| Plot type | Count rate plots | Images |
|---|---|---|
| Comparison with Poisson distribution Blue bars denote a histogram of data divided into 1 sec bins. Red curve is a Poisson curve with rate = median count rate of data. |
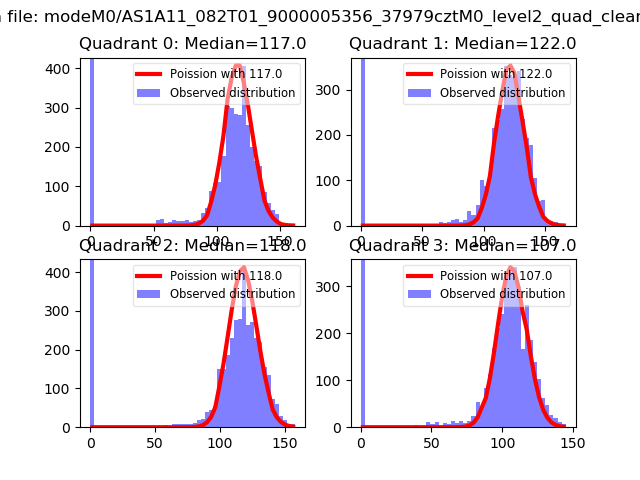 |
 |
| Quadrant-wise count rates Data is divided into 100 sec bins |
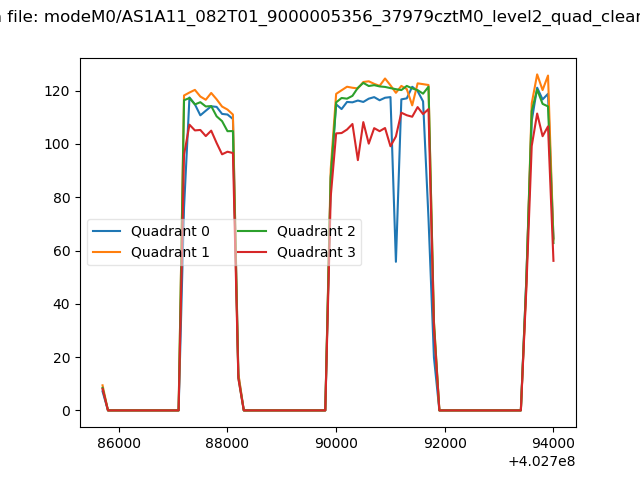 |
|
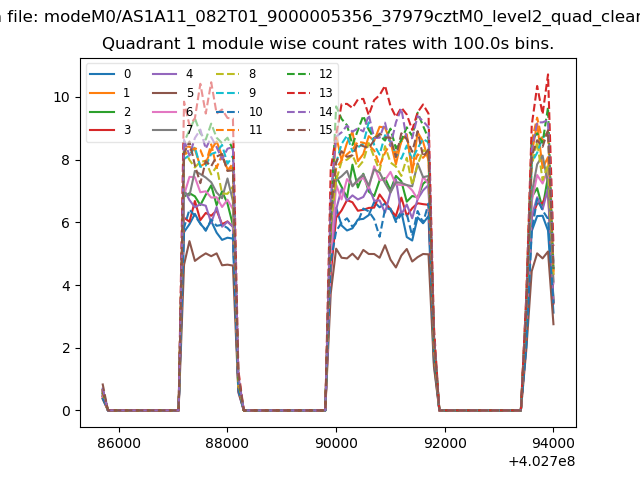
| Module-wise count rates for Quadrant A Data is divided into 100 sec bins |
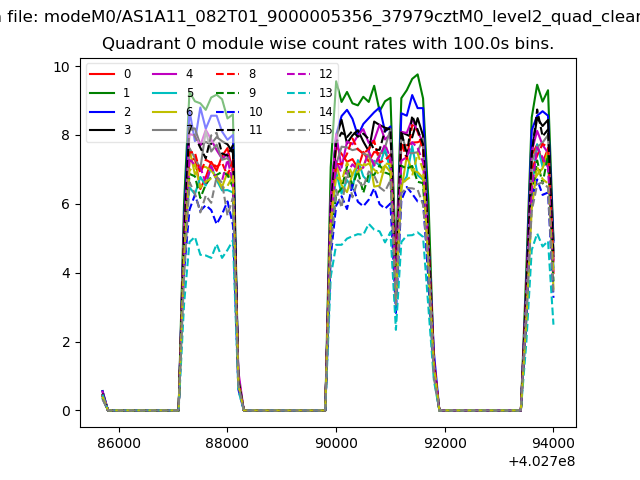 |
 |
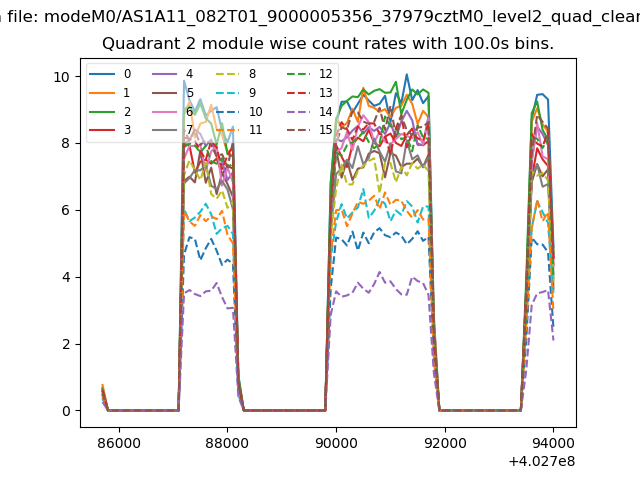
| Module-wise count rates for Quadrant B Data is divided into 100 sec bins |
 |
 |
| Module-wise count rates for Quadrant C Data is divided into 100 sec bins |
 |
 |
| Module-wise count rates for Quadrant D Data is divided into 100 sec bins |
 |
 |
| Parameter | Plot |
|---|---|
| CZT HV Monitor | 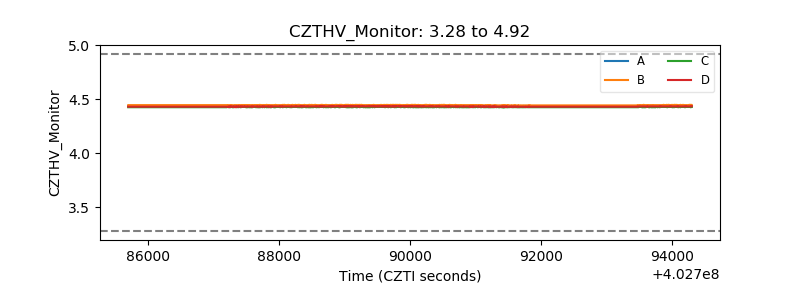 |
| D_VDD | 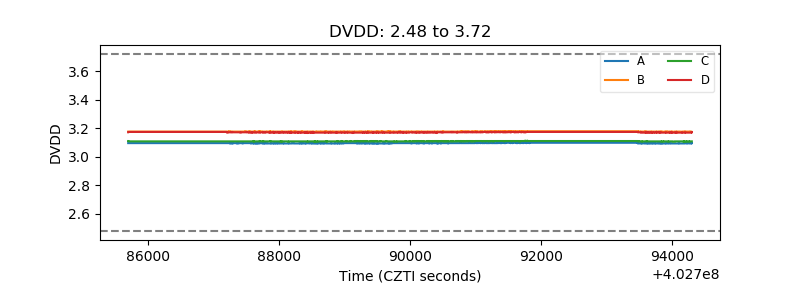 |
| Temperature 1 | 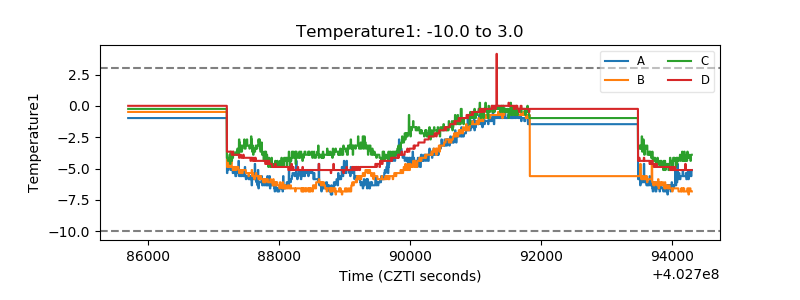 |
| Veto HV Monitor |  |
| Veto LLD | 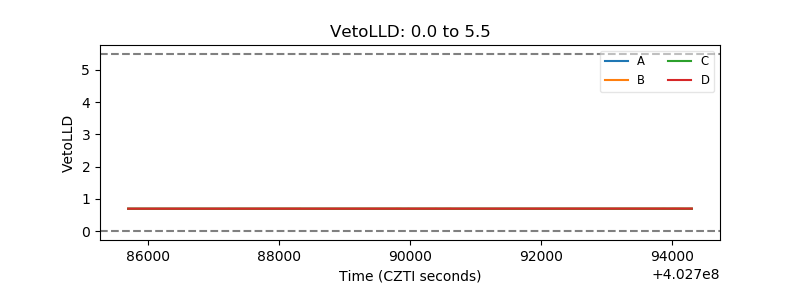 |
| Alpha Counter | 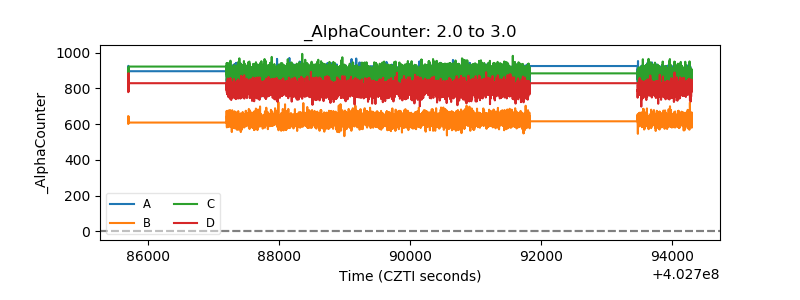 |
| _CPM_Rate | 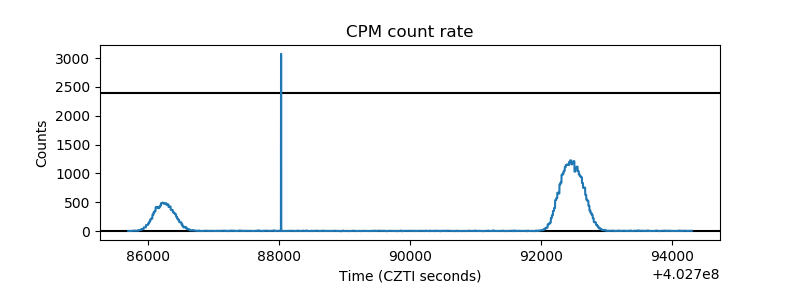 |
| CZT Counter | 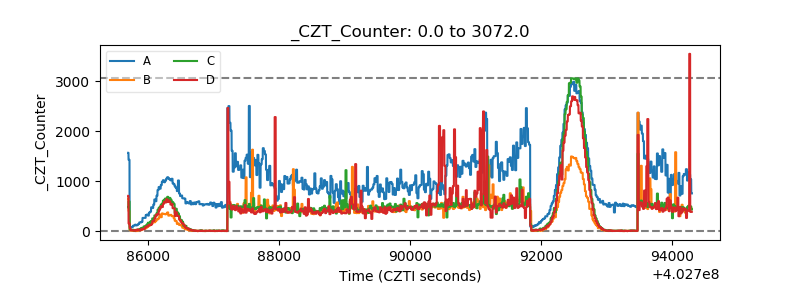 |
| +2.5 Volts monitor | 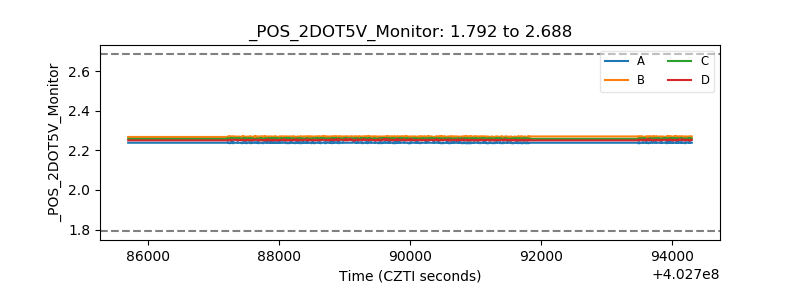 |
| +5 Volts monitor | 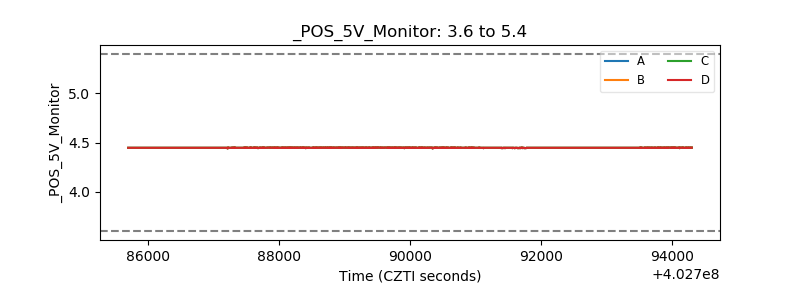 |
| _ROLL_ROT | 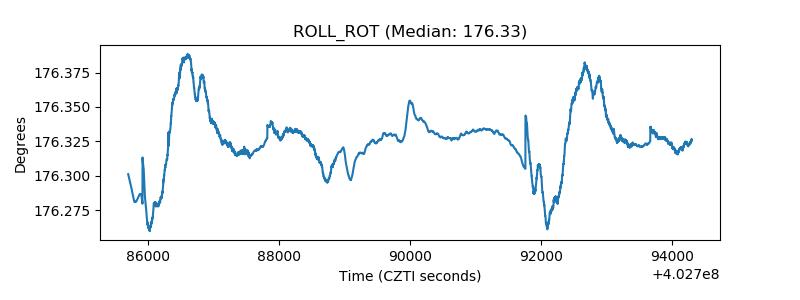 |
| _Roll_DEC | 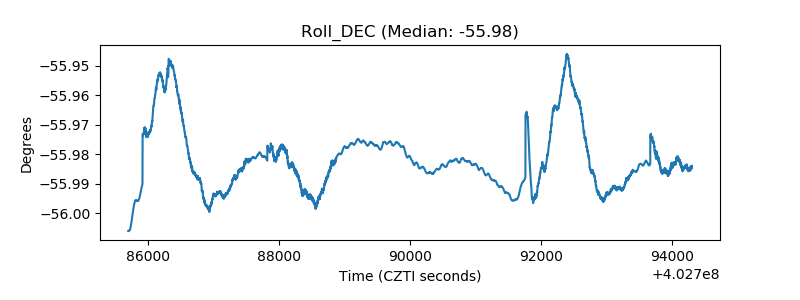 |
| _Roll_RA | 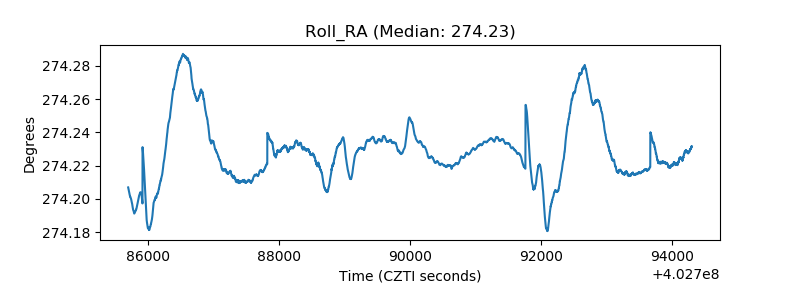 |
| Veto Counter | 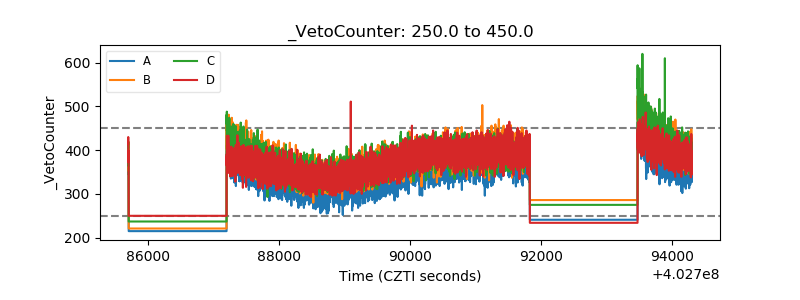 |