| Param | Original file | Final file |
|---|---|---|
| Filename | modeM0/AS1A11_082T01_9000005356_37982cztM0_level2.fits | modeM0/AS1A11_082T01_9000005356_37982cztM0_level2_quad_clean.evt |
| Size (bytes) | 494,308,800 | 45,648,000 |
| Size | 471.4 MB | 43.5 MB |
| Events in quadrant A | 9,580,425 | 125,835 |
| Events in quadrant B | 2,862,811 | 303,346 |
| Events in quadrant C | 2,702,841 | 306,820 |
| Events in quadrant D | 2,740,385 | 276,183 |
| Mode M0 | |||
|---|---|---|---|
| Quadrant | BADHDUFLAG | Total packets | Discarded packets |
| A | 0 | 32108 | 3 |
| B | 0 | 11718 | 2 |
| C | 0 | 10876 | 2 |
| D | 0 | 11472 | 2 |
| Mode SS | |||
|---|---|---|---|
| Quadrant | BADHDUFLAG | Total packets | Discarded packets |
| A | 0 | 108 | 0 |
| B | 0 | 108 | 0 |
| C | 0 | 108 | 0 |
| D | 0 | 108 | 0 |
| Mode M9 | |||
|---|---|---|---|
| Quadrant | BADHDUFLAG | Total packets | Discarded packets |
| A | 0 | 32 | 0 |
| B | 0 | 32 | 0 |
| C | 0 | 32 | 0 |
| D | 0 | 33 | 0 |
| Quadrant | Total seconds | Saturated seconds | Saturation percentage |
|---|---|---|---|
| A | 5283 | 2681 | 50.747681% |
| B | 5283 | 88 | 1.665720% |
| C | 5283 | 5 | 0.094643% |
| D | 5283 | 33 | 0.624645% |
Noise dominated data is calculated using 1-second bins in cleaned event files. If a bin has >2000 counts, and if more than 50% of those come from <1% of pixels, then it is considered to be noise-dominated and hence unusable.
| Quadrant | # 1 sec bins | Bins with >0 counts | Bins with >2000 counts | High rate bins dominated by noise | Noise dominated (total time) | Noise dominated (detector-on time) | Marked lightcurve |
|---|---|---|---|---|---|---|---|
| A | 7196 | 5284 | 2288 | 2288 | 31.80% | 43.30% | 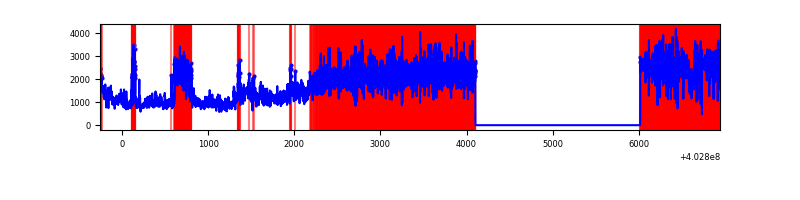 |
| B | 7196 | 5284 | 54 | 54 | 0.75% | 1.02% |  |
| C | 7196 | 5284 | 1 | 1 | 0.01% | 0.02% | 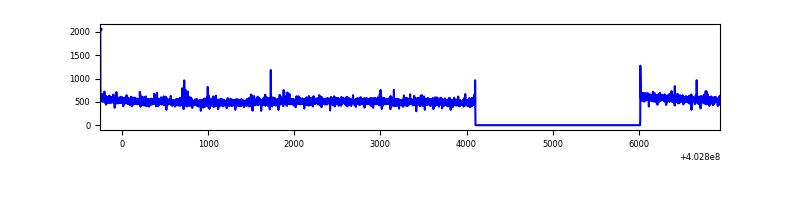 |
| D | 7196 | 5284 | 26 | 26 | 0.36% | 0.49% | 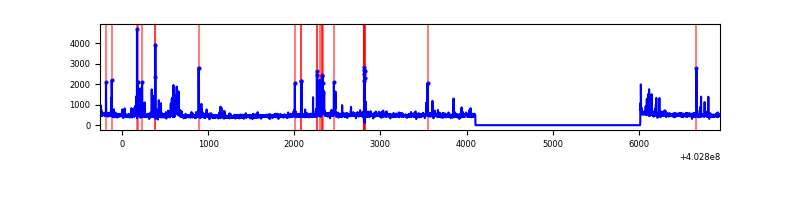 |
Top three noisy pixels from each quadrant. If the there are fewer than three noisy pixels in the level2.evt file, extra rows are filled as -1
| Pixel properties | Quadrant properties | ||||||
|---|---|---|---|---|---|---|---|
| Quadrant | DetID | PixID | Counts | Sigma | Mean | Median | Sigma |
| A | 15 | 222 | 7224633 | 68796.2 | 519 | 509 | 105.0 |
| A | 10 | 83 | 282981 | 2690.01 | 519 | 509 | 105.0 |
| A | 12 | 16 | 35063 | 329.06 | 519 | 509 | 105.0 |
| B | 4 | 67 | 165514 | 1376.36 | 631 | 616 | 119.8 |
| B | 5 | 172 | 98251 | 814.93 | 631 | 616 | 119.8 |
| B | 5 | 184 | 47209 | 388.9 | 631 | 616 | 119.8 |
| C | 15 | 214 | 226265 | 1560.12 | 628 | 632 | 144.6 |
| C | 14 | 254 | 11974 | 78.42 | 628 | 632 | 144.6 |
| C | 0 | 10 | 6423 | 40.04 | 628 | 632 | 144.6 |
| D | 10 | 199 | 77997 | 509.04 | 623 | 608 | 152.0 |
| D | 5 | 157 | 65847 | 429.13 | 623 | 608 | 152.0 |
| D | 13 | 249 | 38320 | 248.06 | 623 | 608 | 152.0 |
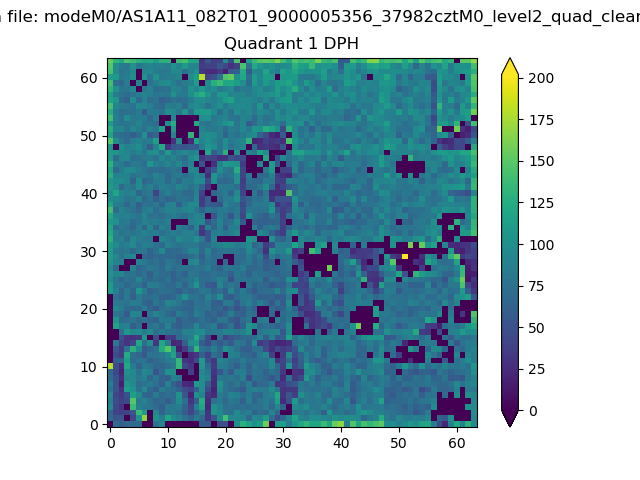
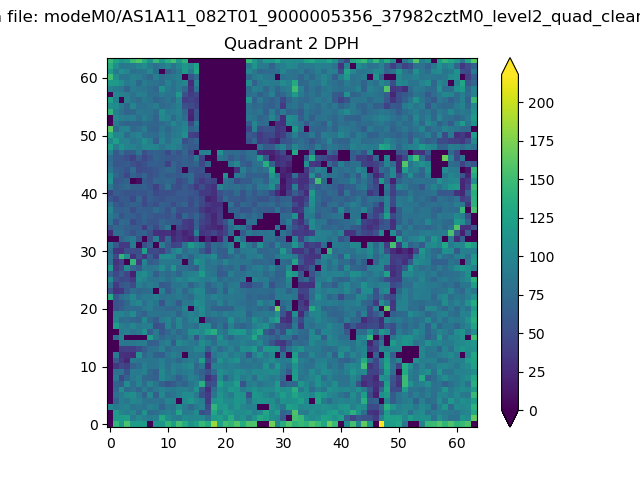
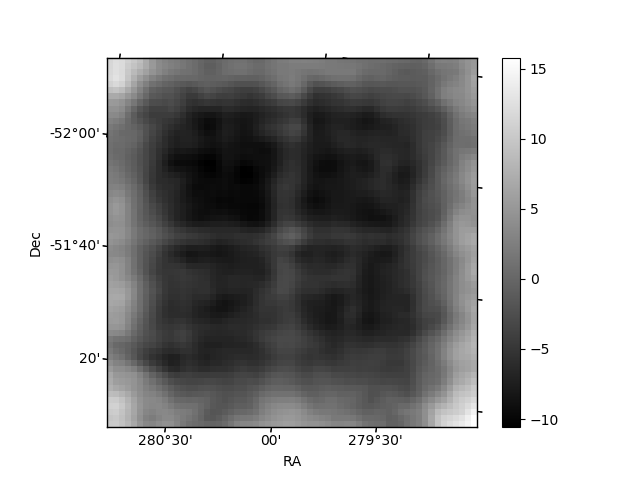
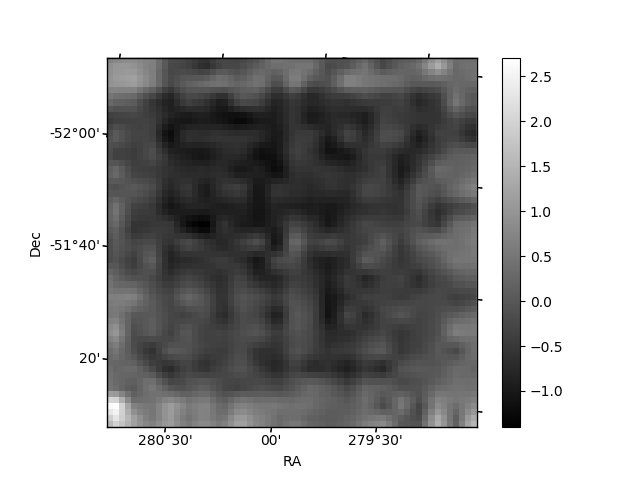
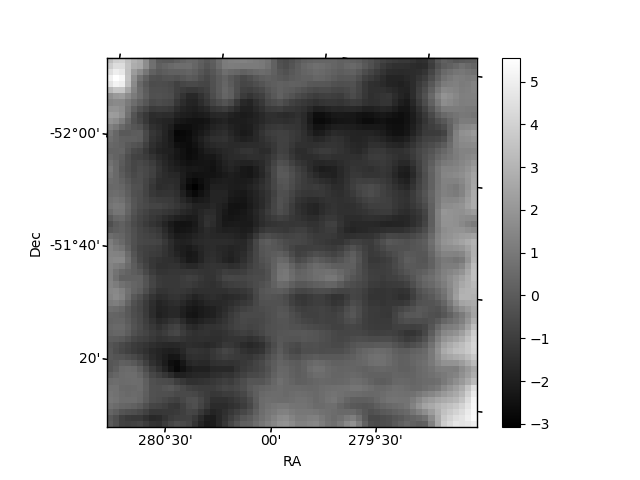
Histogram calculated using DETX and DETY for each event in the final _common_clean file
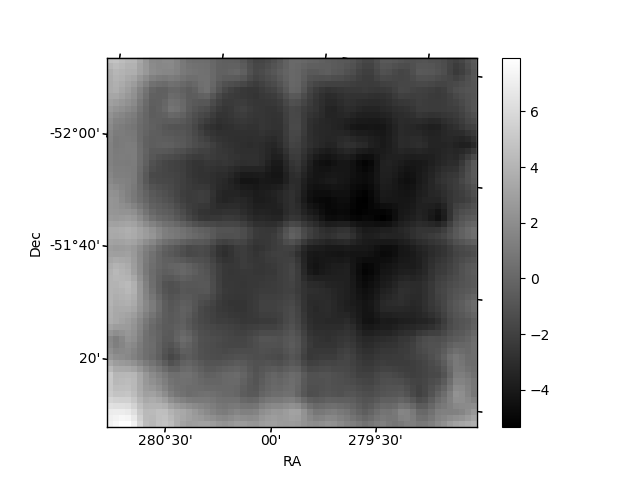
| Quadrant A | 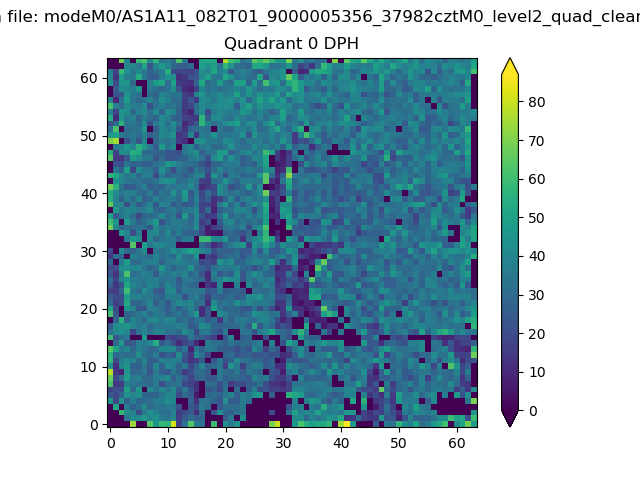 |
 |
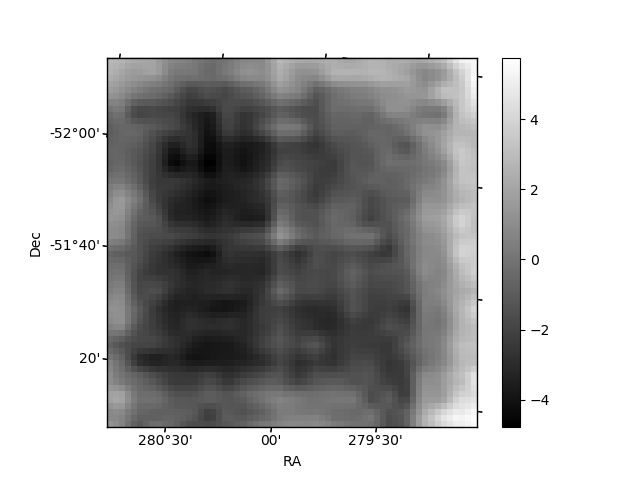
Quadrant B |
|---|---|---|---|
| Quadrant D | 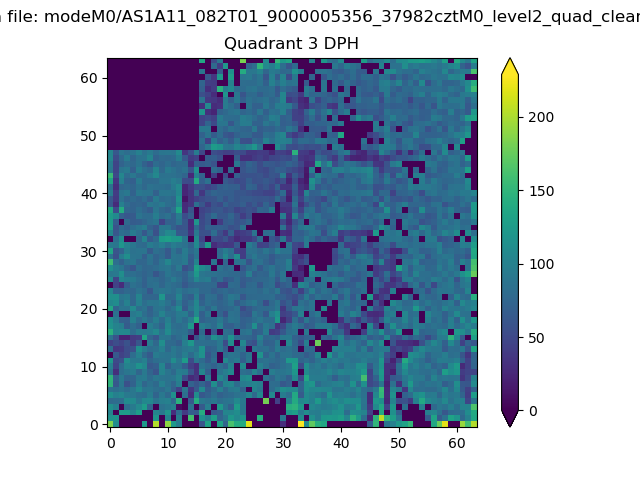 |
 |
Quadrant C |
| Plot type | Count rate plots | Images |
|---|---|---|
| Comparison with Poisson distribution Blue bars denote a histogram of data divided into 1 sec bins. Red curve is a Poisson curve with rate = median count rate of data. |
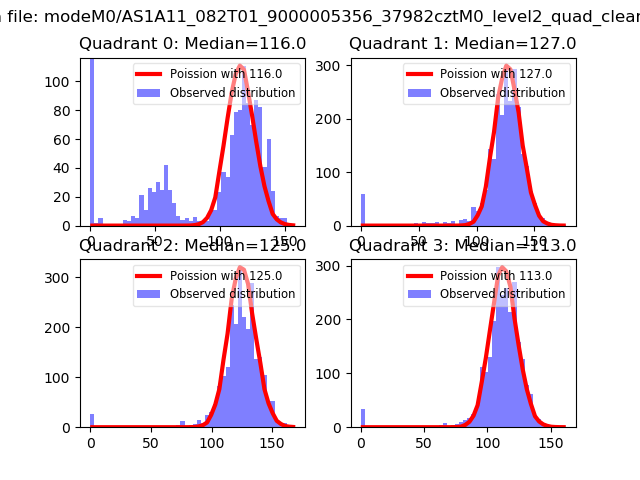 |
 |
| Quadrant-wise count rates Data is divided into 100 sec bins |
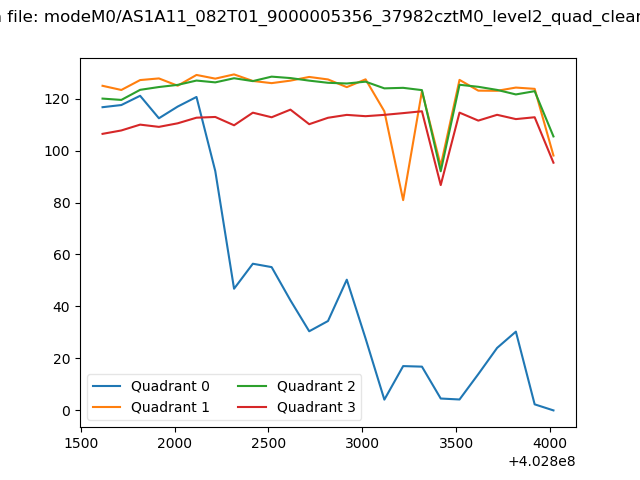 |
|
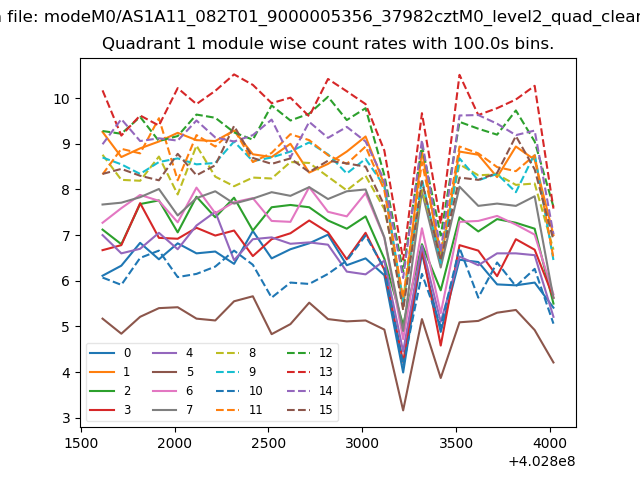
| Module-wise count rates for Quadrant A Data is divided into 100 sec bins |
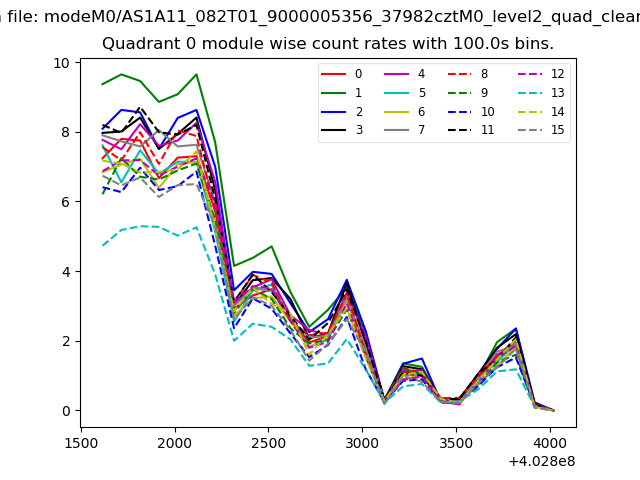 |
 |
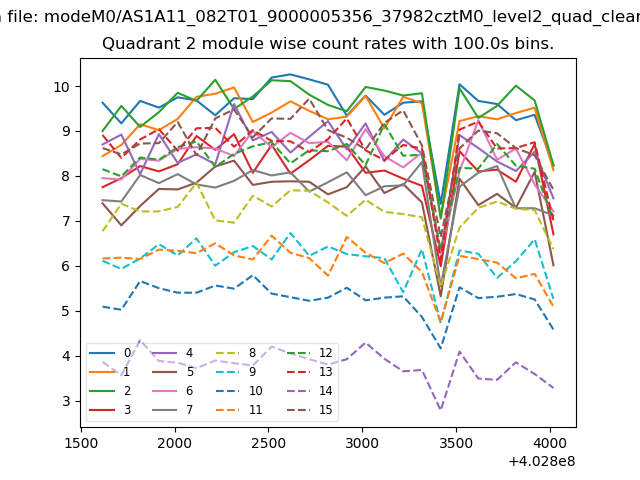
| Module-wise count rates for Quadrant B Data is divided into 100 sec bins |
 |
 |
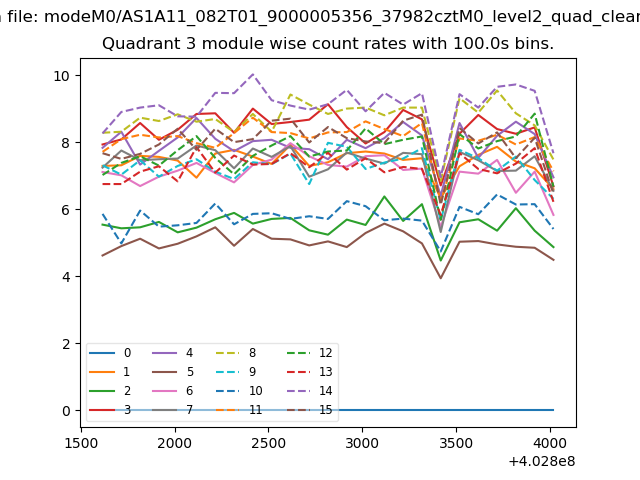
| Module-wise count rates for Quadrant C Data is divided into 100 sec bins |
 |
 |
| Module-wise count rates for Quadrant D Data is divided into 100 sec bins |
 |
 |
| Parameter | Plot |
|---|---|
| CZT HV Monitor |  |
| D_VDD | 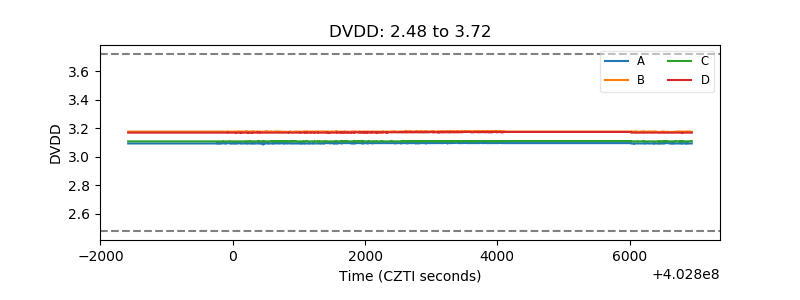 |
| Temperature 1 | 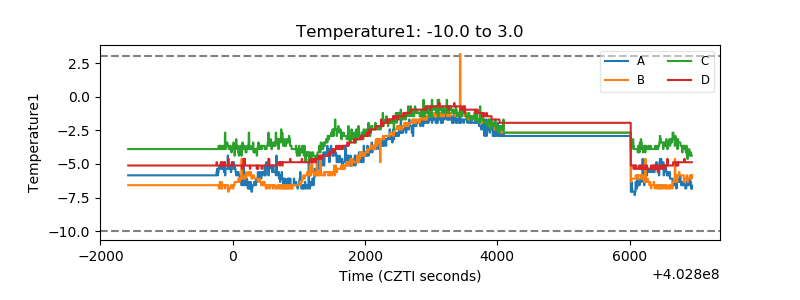 |
| Veto HV Monitor | 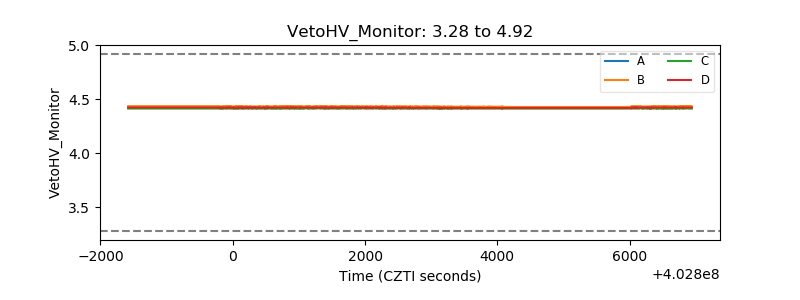 |
| Veto LLD | 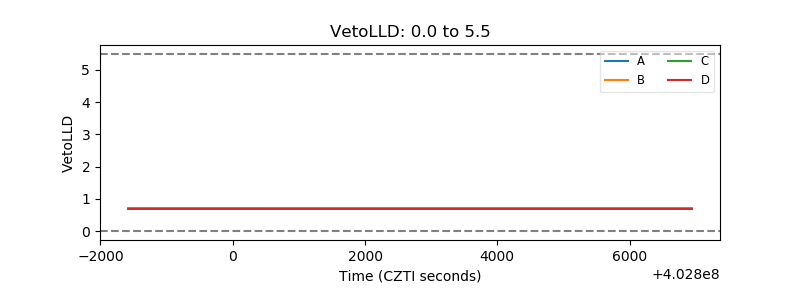 |
| Alpha Counter | 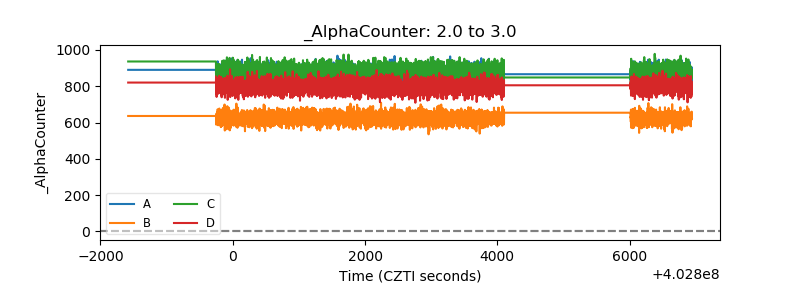 |
| _CPM_Rate | 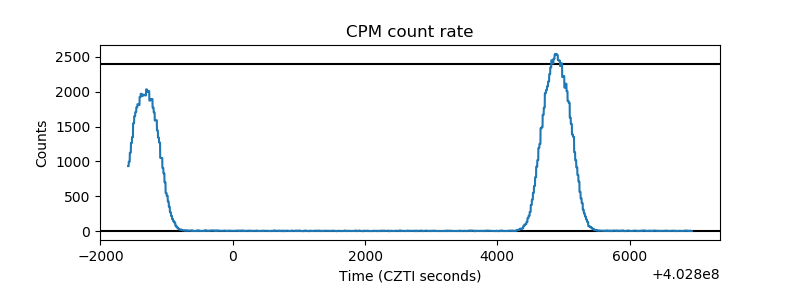 |
| CZT Counter | 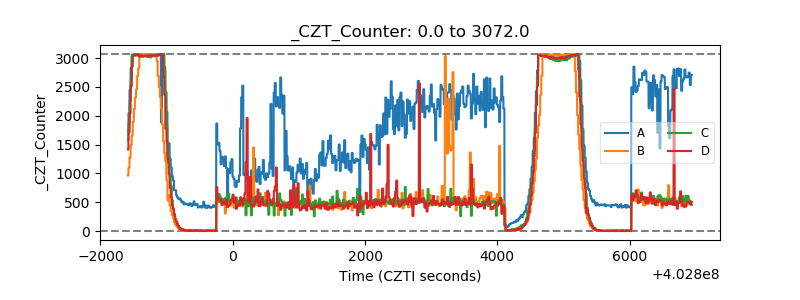 |
| +2.5 Volts monitor |  |
| +5 Volts monitor |  |
| _ROLL_ROT | 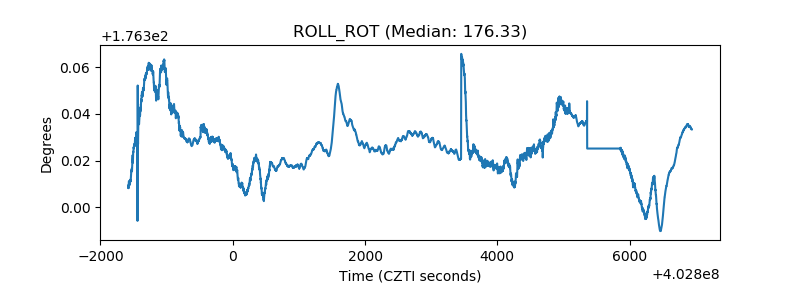 |
| _Roll_DEC | 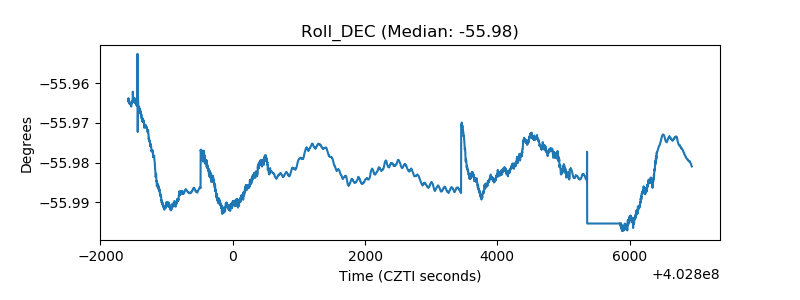 |
| _Roll_RA | 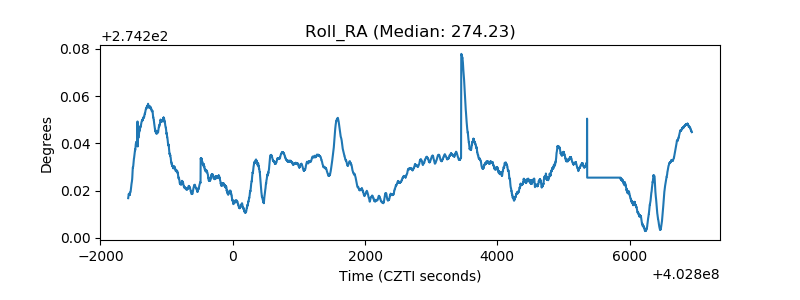 |
| Veto Counter | 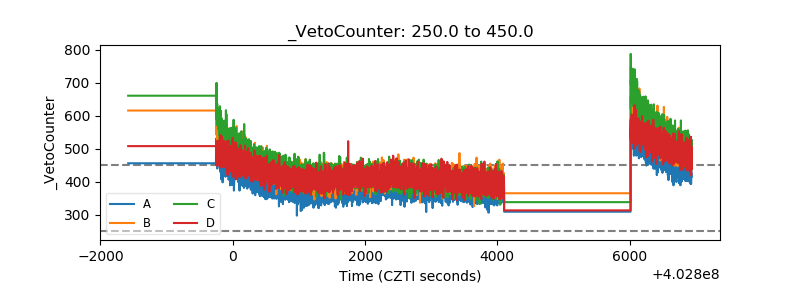 |