| Param | Original file | Final file |
|---|---|---|
| Filename | modeM0/AS1A11_082T01_9000005356_37983cztM0_level2.fits | modeM0/AS1A11_082T01_9000005356_37983cztM0_level2_quad_clean.evt |
| Size (bytes) | 609,344,640 | 44,988,480 |
| Size | 581.1 MB | 42.9 MB |
| Events in quadrant A | 13,219,702 | 5,775 |
| Events in quadrant B | 3,322,599 | 337,060 |
| Events in quadrant C | 2,790,572 | 343,808 |
| Events in quadrant D | 2,818,606 | 311,692 |
| Mode M0 | |||
|---|---|---|---|
| Quadrant | BADHDUFLAG | Total packets | Discarded packets |
| A | 0 | 42867 | 3 |
| B | 0 | 12973 | 2 |
| C | 0 | 11092 | 2 |
| D | 0 | 11455 | 2 |
| Mode SS | |||
|---|---|---|---|
| Quadrant | BADHDUFLAG | Total packets | Discarded packets |
| A | 0 | 106 | 0 |
| B | 0 | 106 | 0 |
| C | 0 | 106 | 0 |
| D | 0 | 106 | 0 |
| Mode M9 | |||
|---|---|---|---|
| Quadrant | BADHDUFLAG | Total packets | Discarded packets |
| A | 0 | 20 | 0 |
| B | 0 | 20 | 0 |
| C | 0 | 20 | 0 |
| D | 0 | 21 | 0 |
| Quadrant | Total seconds | Saturated seconds | Saturation percentage |
|---|---|---|---|
| A | 5190 | 5065 | 97.591522% |
| B | 5190 | 193 | 3.718690% |
| C | 5190 | 6 | 0.115607% |
| D | 5190 | 45 | 0.867052% |
Noise dominated data is calculated using 1-second bins in cleaned event files. If a bin has >2000 counts, and if more than 50% of those come from <1% of pixels, then it is considered to be noise-dominated and hence unusable.
| Quadrant | # 1 sec bins | Bins with >0 counts | Bins with >2000 counts | High rate bins dominated by noise | Noise dominated (total time) | Noise dominated (detector-on time) | Marked lightcurve |
|---|---|---|---|---|---|---|---|
| A | 7193 | 5190 | 4719 | 4719 | 65.61% | 90.92% | 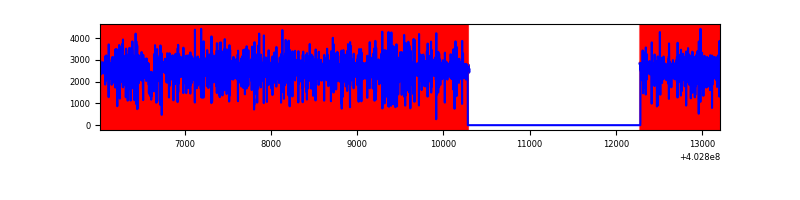 |
| B | 7193 | 5191 | 121 | 121 | 1.68% | 2.33% | 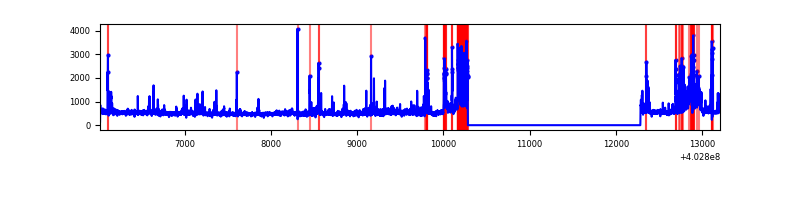 |
| C | 7193 | 5191 | 2 | 2 | 0.03% | 0.04% | 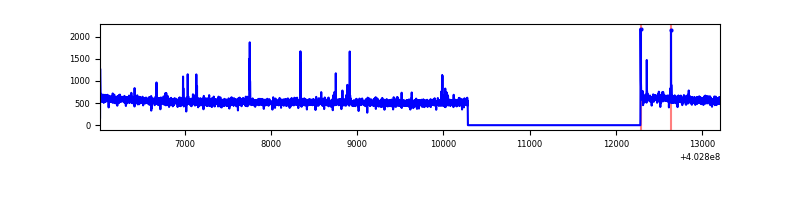 |
| D | 7193 | 5191 | 29 | 29 | 0.40% | 0.56% | 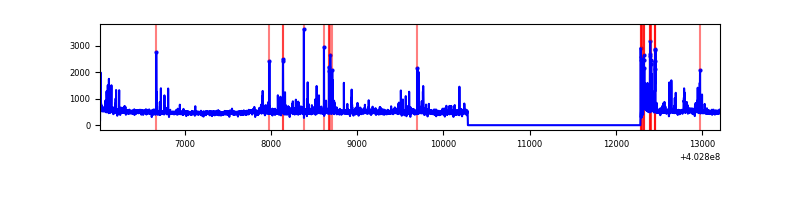 |
Top three noisy pixels from each quadrant. If the there are fewer than three noisy pixels in the level2.evt file, extra rows are filled as -1
| Pixel properties | Quadrant properties | ||||||
|---|---|---|---|---|---|---|---|
| Quadrant | DetID | PixID | Counts | Sigma | Mean | Median | Sigma |
| A | 15 | 222 | 11919122 | 203993.23 | 288 | 283 | 58.4 |
| A | 10 | 83 | 159217 | 2720.19 | 288 | 283 | 58.4 |
| A | 12 | 16 | 14769 | 247.93 | 288 | 283 | 58.4 |
| B | 5 | 184 | 464163 | 3896.09 | 640 | 626 | 119.0 |
| B | 5 | 172 | 183224 | 1534.76 | 640 | 626 | 119.0 |
| B | 0 | 189 | 52540 | 436.34 | 640 | 626 | 119.0 |
| C | 15 | 214 | 224158 | 1534.85 | 643 | 650 | 145.6 |
| C | 14 | 254 | 36187 | 244.04 | 643 | 650 | 145.6 |
| C | 0 | 10 | 8614 | 54.69 | 643 | 650 | 145.6 |
| D | 2 | 249 | 63884 | 409.95 | 639 | 621 | 154.3 |
| D | 10 | 199 | 55580 | 356.14 | 639 | 621 | 154.3 |
| D | 13 | 249 | 51013 | 326.55 | 639 | 621 | 154.3 |
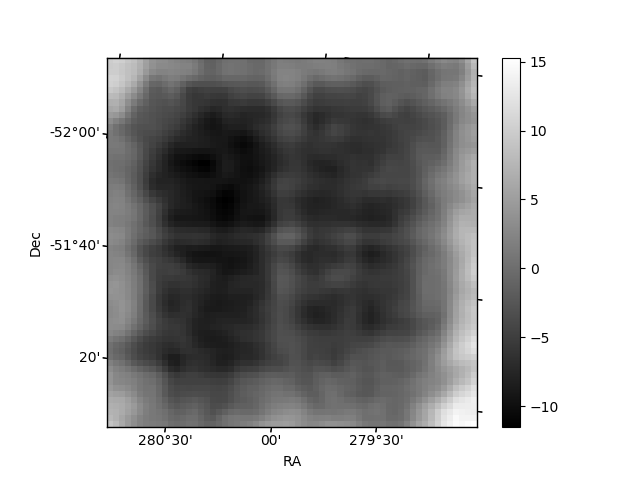
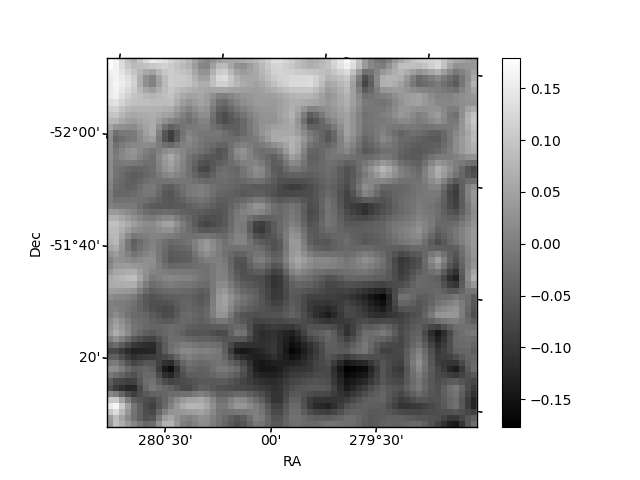
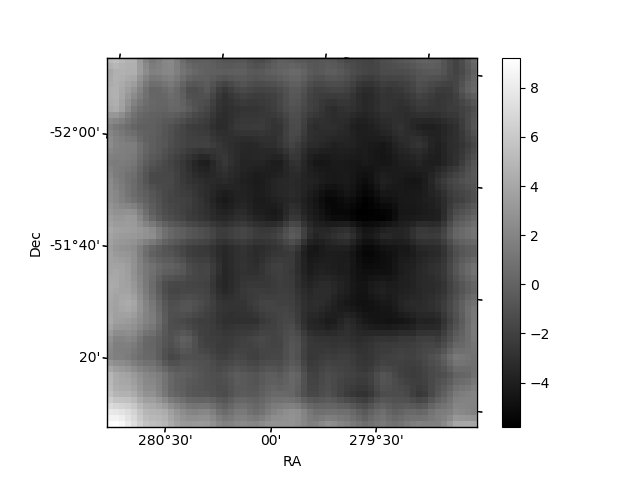
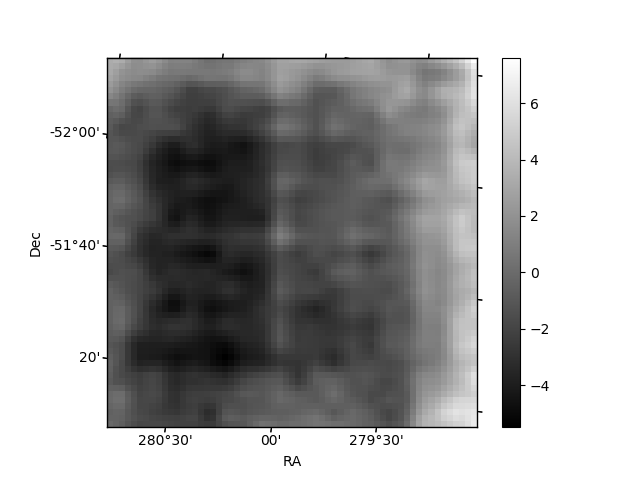
Histogram calculated using DETX and DETY for each event in the final _common_clean file
| Quadrant A | 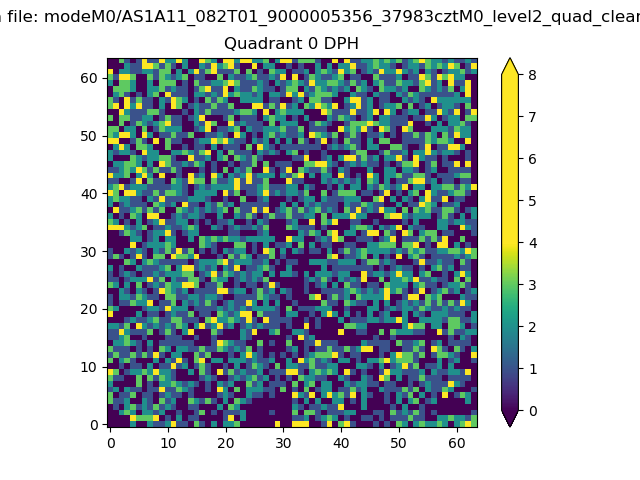 |
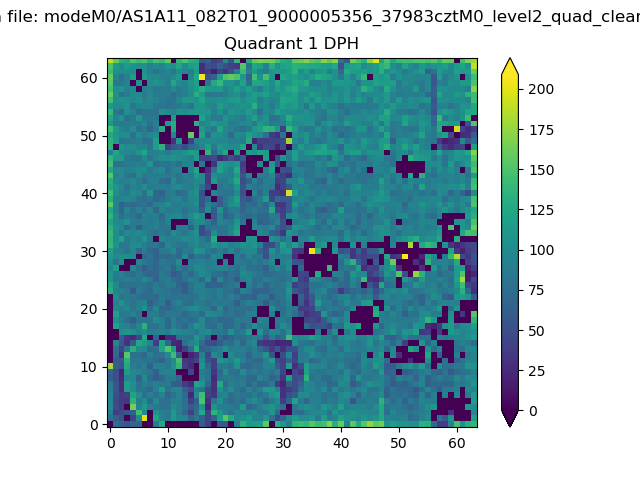 |
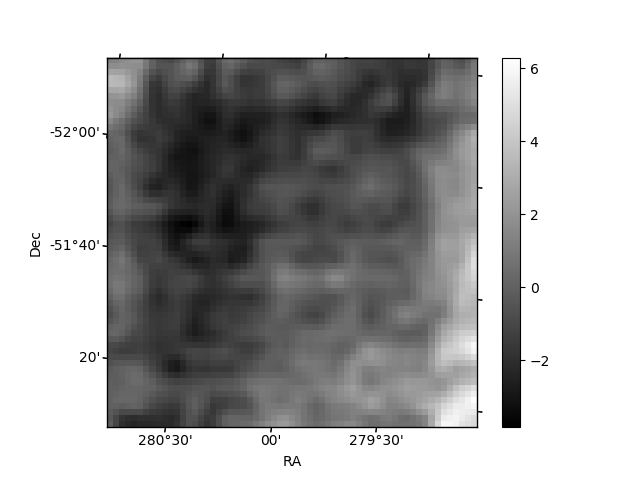
Quadrant B |
|---|---|---|---|
| Quadrant D | 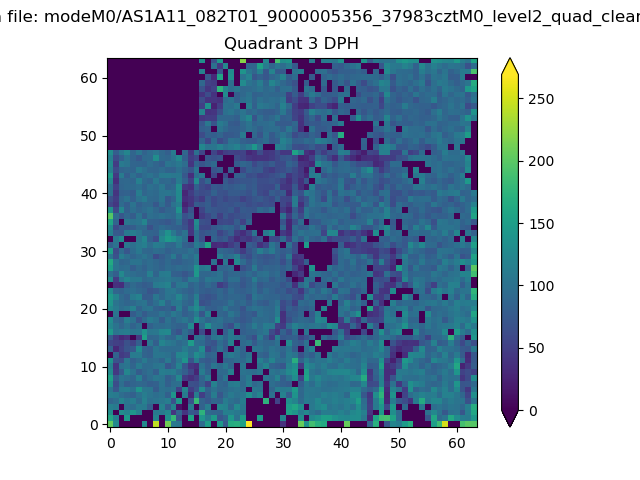 |
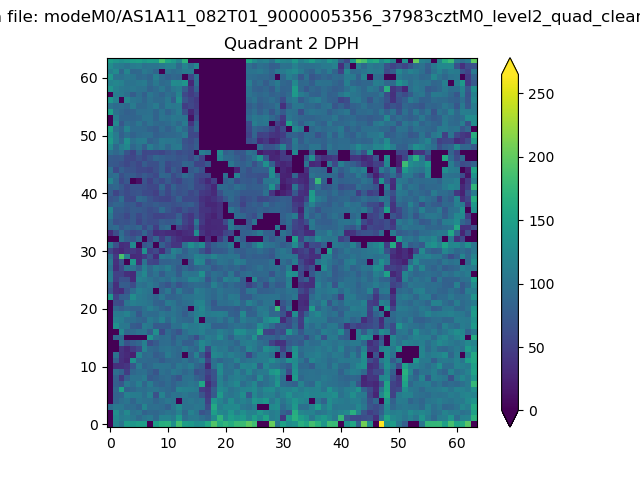 |
Quadrant C |
| Plot type | Count rate plots | Images |
|---|---|---|
| Comparison with Poisson distribution Blue bars denote a histogram of data divided into 1 sec bins. Red curve is a Poisson curve with rate = median count rate of data. |
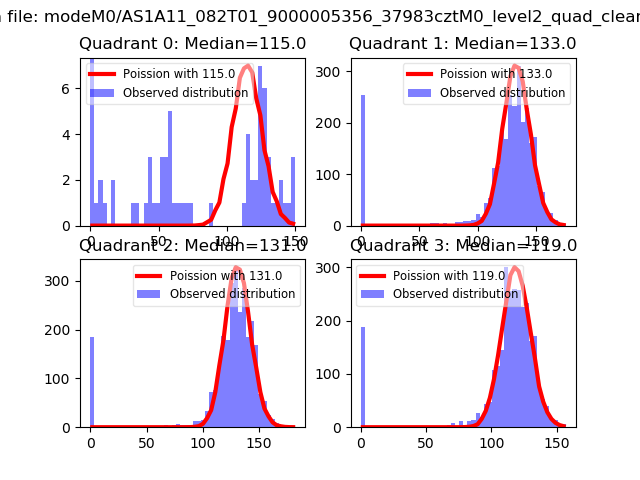 |
 |
| Quadrant-wise count rates Data is divided into 100 sec bins |
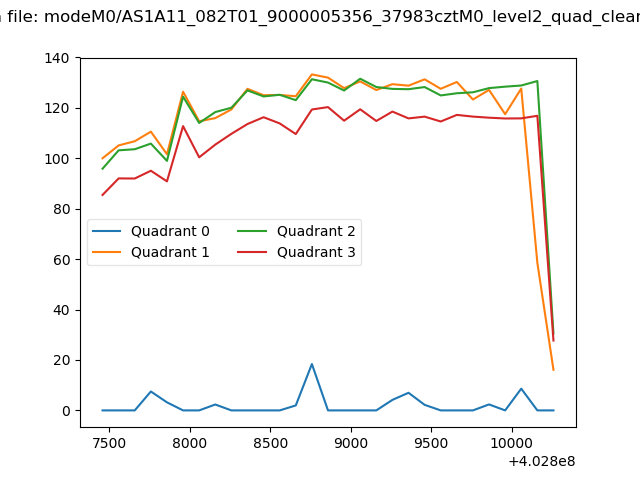 |
|
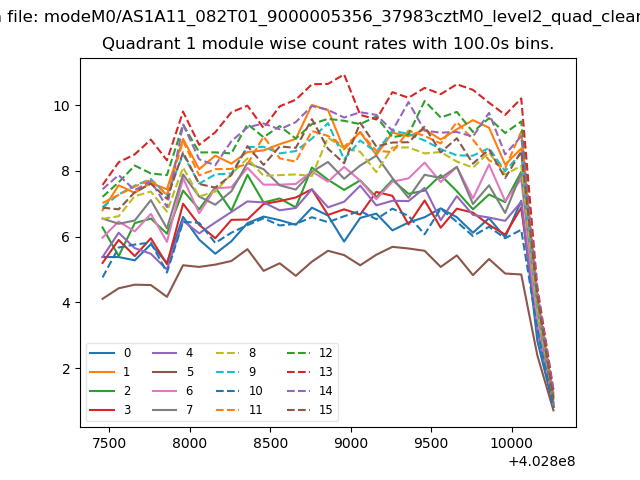
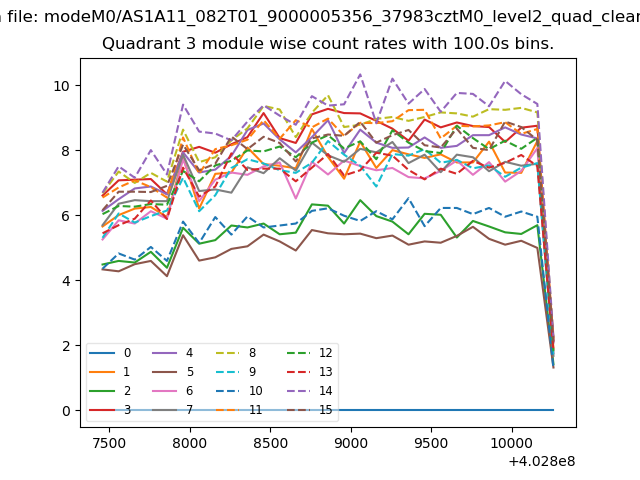
| Module-wise count rates for Quadrant A Data is divided into 100 sec bins |
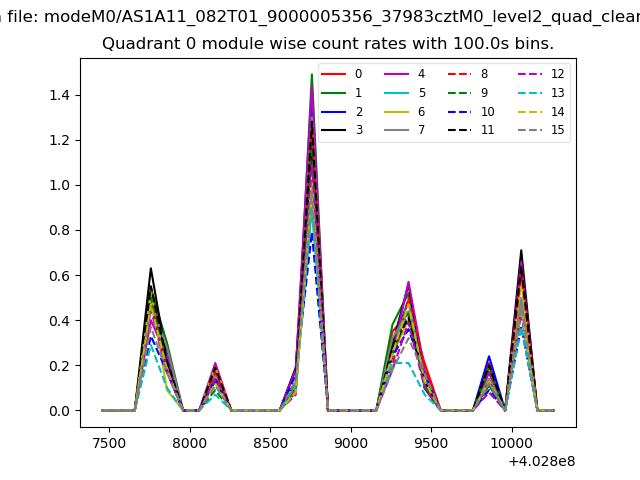 |
 |
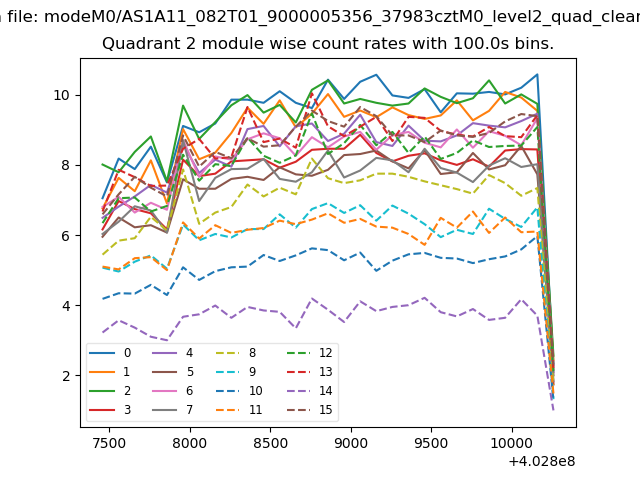
| Module-wise count rates for Quadrant B Data is divided into 100 sec bins |
 |
 |
| Module-wise count rates for Quadrant C Data is divided into 100 sec bins |
 |
 |
| Module-wise count rates for Quadrant D Data is divided into 100 sec bins |
 |
 |
| Parameter | Plot |
|---|---|
| CZT HV Monitor | 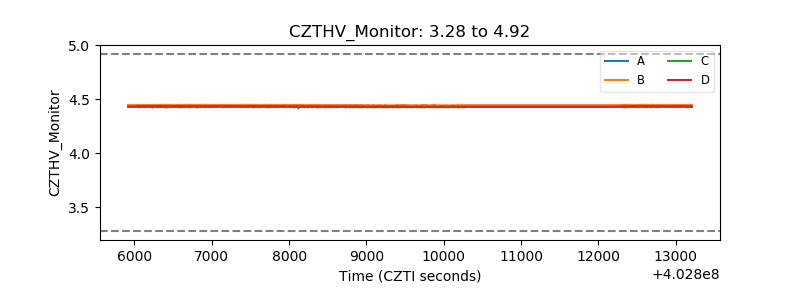 |
| D_VDD | 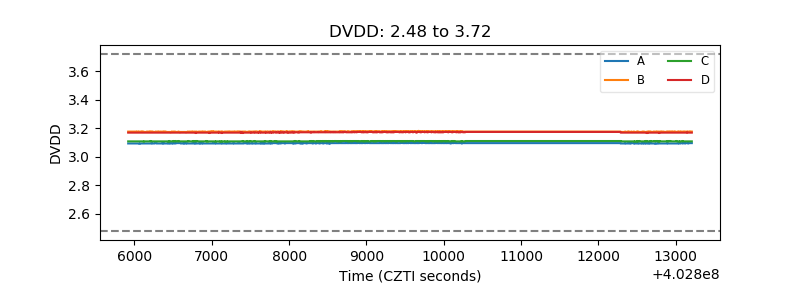 |
| Temperature 1 | 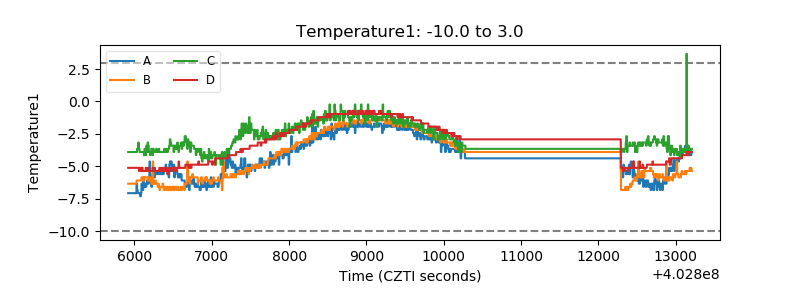 |
| Veto HV Monitor | 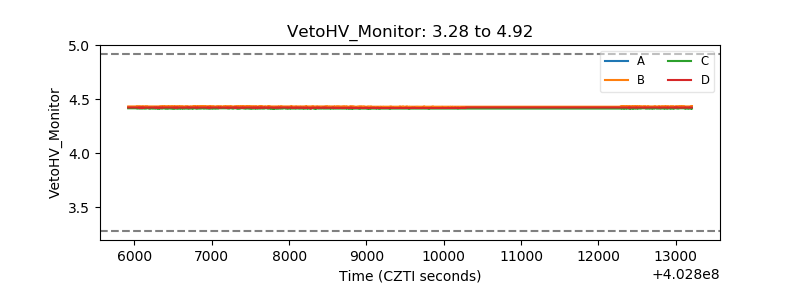 |
| Veto LLD | 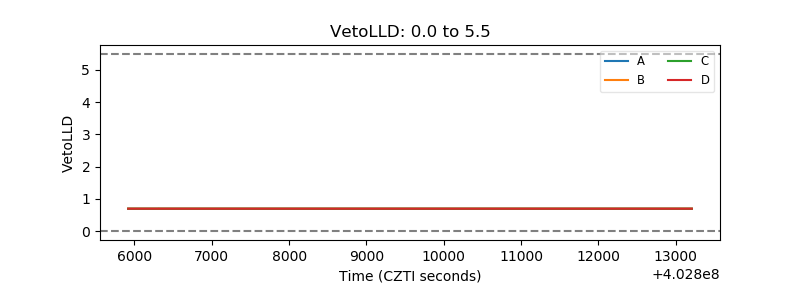 |
| Alpha Counter | 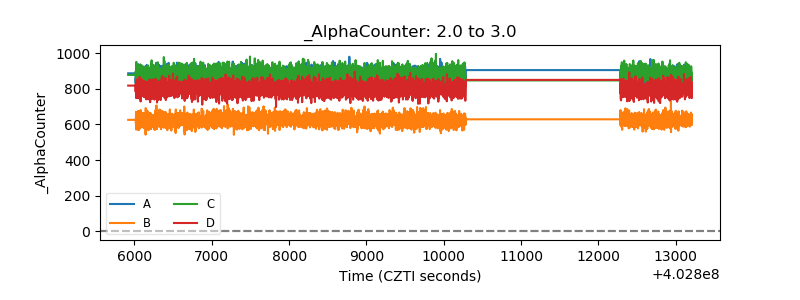 |
| _CPM_Rate |  |
| CZT Counter | 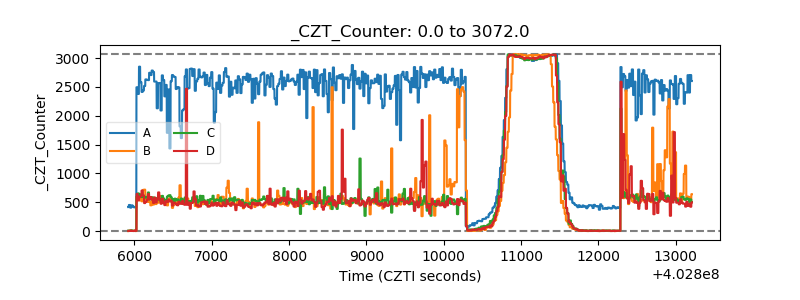 |
| +2.5 Volts monitor | 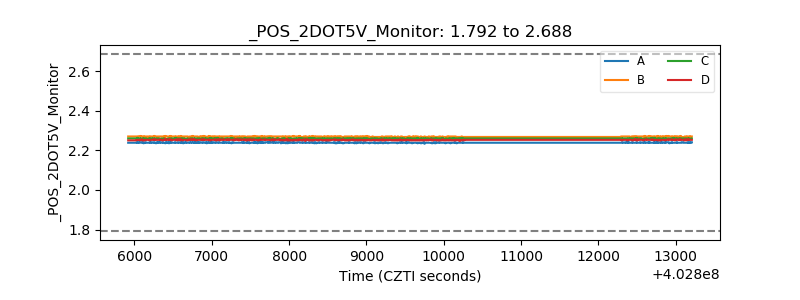 |
| +5 Volts monitor | 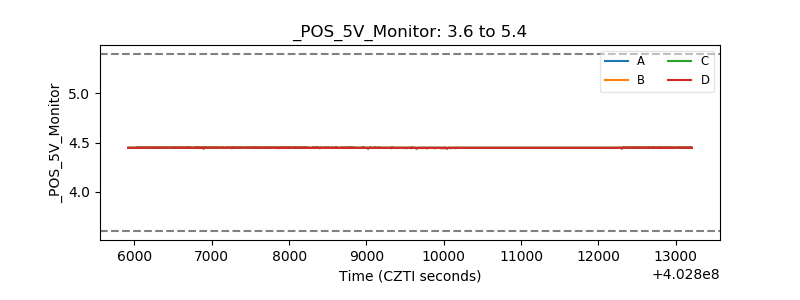 |
| _ROLL_ROT | 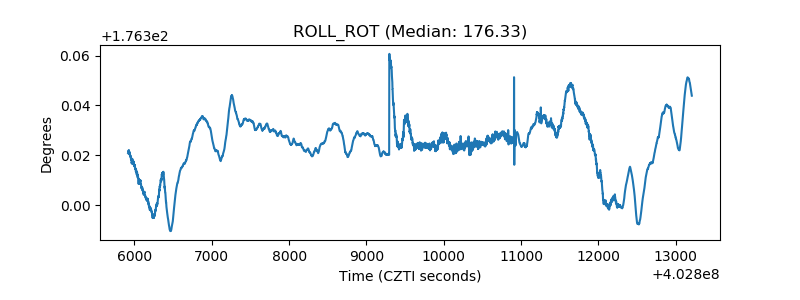 |
| _Roll_DEC | 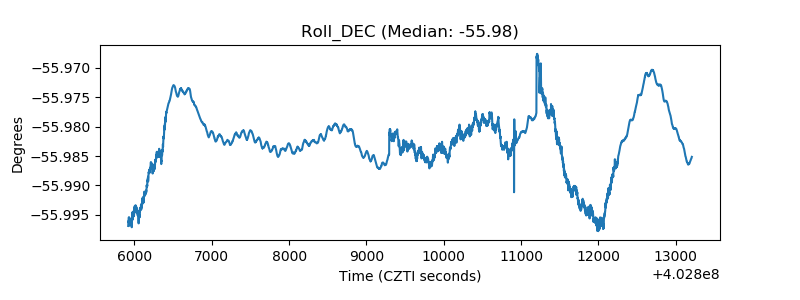 |
| _Roll_RA | 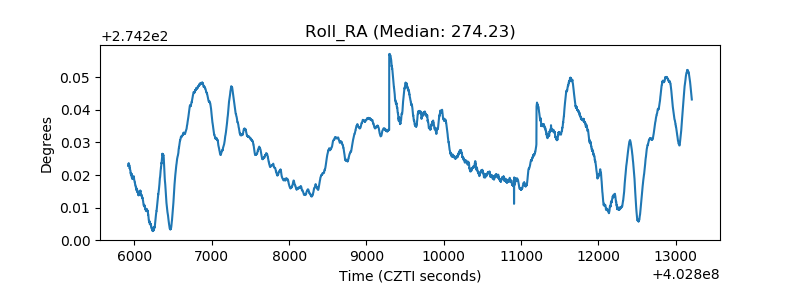 |
| Veto Counter | 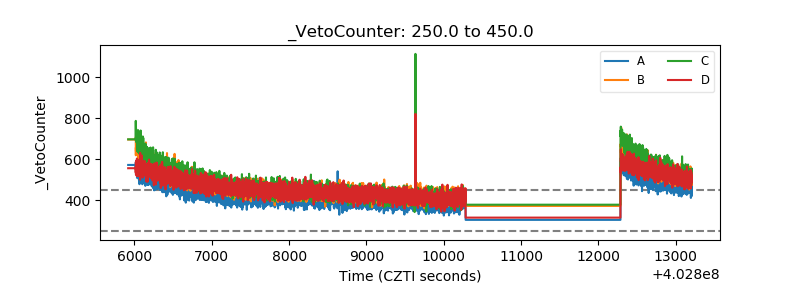 |