| Param | Original file | Final file |
|---|---|---|
| Filename | modeM0/AS1A11_082T01_9000005356_37985cztM0_level2.fits | modeM0/AS1A11_082T01_9000005356_37985cztM0_level2_quad_clean.evt |
| Size (bytes) | 381,035,520 | 55,252,800 |
| Size | 363.4 MB | 52.7 MB |
| Events in quadrant A | 5,055,609 | 335,933 |
| Events in quadrant B | 2,742,287 | 345,464 |
| Events in quadrant C | 2,543,164 | 346,455 |
| Events in quadrant D | 3,386,518 | 304,577 |
| Mode M0 | |||
|---|---|---|---|
| Quadrant | BADHDUFLAG | Total packets | Discarded packets |
| A | 0 | 18507 | 3 |
| B | 0 | 10976 | 2 |
| C | 0 | 10262 | 2 |
| D | 0 | 13120 | 2 |
| Mode SS | |||
|---|---|---|---|
| Quadrant | BADHDUFLAG | Total packets | Discarded packets |
| A | 0 | 98 | 0 |
| B | 0 | 98 | 0 |
| C | 0 | 98 | 0 |
| D | 0 | 98 | 0 |
| Mode M9 | |||
|---|---|---|---|
| Quadrant | BADHDUFLAG | Total packets | Discarded packets |
| A | 0 | 30 | 0 |
| B | 0 | 30 | 0 |
| C | 0 | 30 | 0 |
| D | 0 | 31 | 0 |
| Quadrant | Total seconds | Saturated seconds | Saturation percentage |
|---|---|---|---|
| A | 4855 | 99 | 2.039135% |
| B | 4855 | 67 | 1.380021% |
| C | 4855 | 8 | 0.164779% |
| D | 4855 | 187 | 3.851699% |
Noise dominated data is calculated using 1-second bins in cleaned event files. If a bin has >2000 counts, and if more than 50% of those come from <1% of pixels, then it is considered to be noise-dominated and hence unusable.
| Quadrant | # 1 sec bins | Bins with >0 counts | Bins with >2000 counts | High rate bins dominated by noise | Noise dominated (total time) | Noise dominated (detector-on time) | Marked lightcurve |
|---|---|---|---|---|---|---|---|
| A | 7009 | 4856 | 51 | 51 | 0.73% | 1.05% | 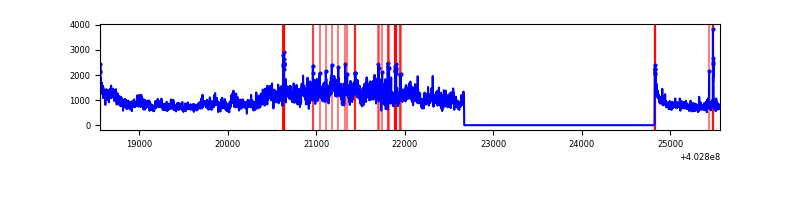 |
| B | 7009 | 4856 | 45 | 45 | 0.64% | 0.93% | 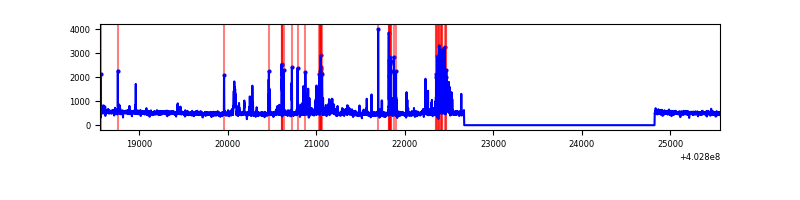 |
| C | 7009 | 4856 | 2 | 2 | 0.03% | 0.04% | 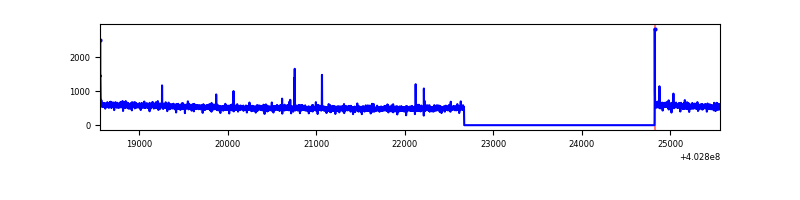 |
| D | 7009 | 4856 | 158 | 158 | 2.25% | 3.25% | 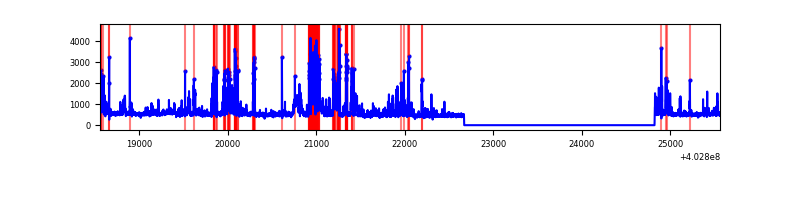 |
Top three noisy pixels from each quadrant. If the there are fewer than three noisy pixels in the level2.evt file, extra rows are filled as -1
| Pixel properties | Quadrant properties | ||||||
|---|---|---|---|---|---|---|---|
| Quadrant | DetID | PixID | Counts | Sigma | Mean | Median | Sigma |
| A | 15 | 222 | 2316526 | 19336.72 | 596 | 587 | 119.8 |
| A | 10 | 83 | 345021 | 2875.82 | 596 | 587 | 119.8 |
| A | 12 | 16 | 52379 | 432.43 | 596 | 587 | 119.8 |
| B | 4 | 81 | 117436 | 1047.03 | 595 | 581 | 111.6 |
| B | 5 | 184 | 107295 | 956.17 | 595 | 581 | 111.6 |
| B | 15 | 85 | 54011 | 478.74 | 595 | 581 | 111.6 |
| C | 15 | 214 | 209745 | 1545.54 | 590 | 595 | 135.3 |
| C | 0 | 10 | 12501 | 87.98 | 590 | 595 | 135.3 |
| C | 14 | 254 | 7374 | 50.09 | 590 | 595 | 135.3 |
| D | 12 | 233 | 420946 | 2962.78 | 584 | 568 | 141.9 |
| D | 2 | 249 | 189417 | 1330.99 | 584 | 568 | 141.9 |
| D | 1 | 47 | 115239 | 808.19 | 584 | 568 | 141.9 |
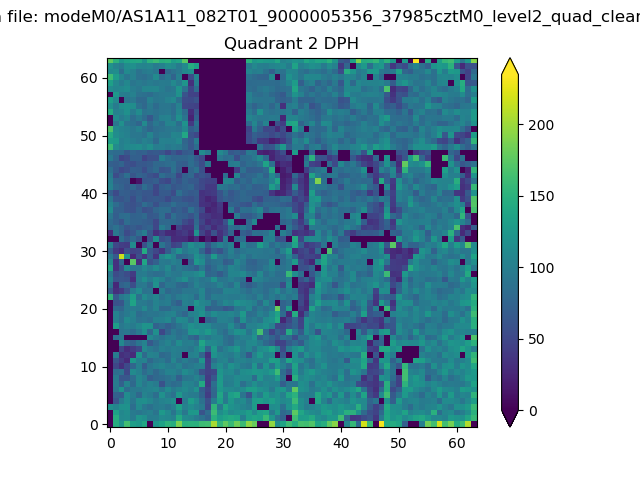
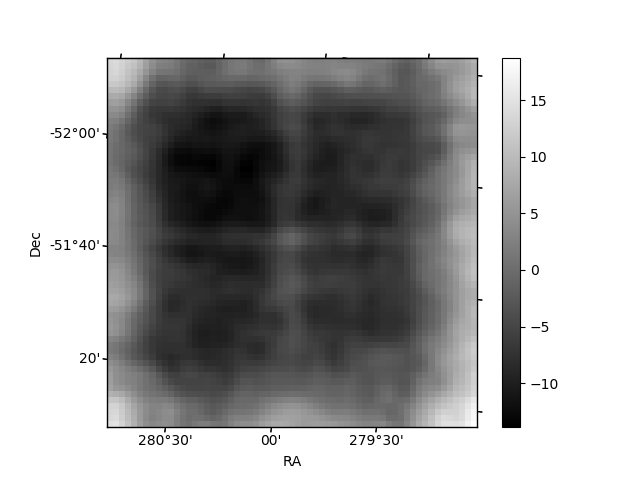
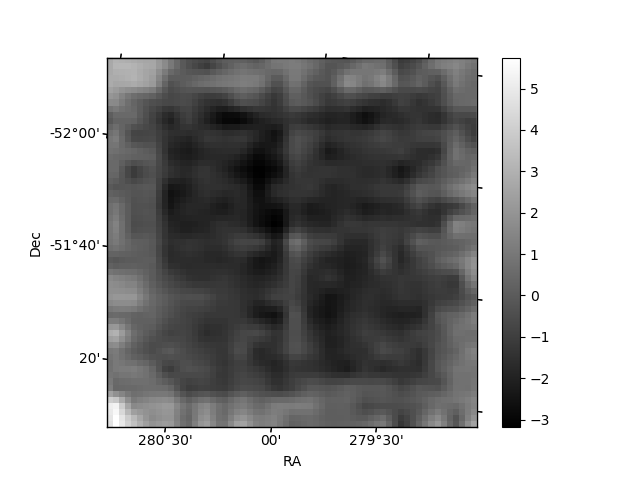
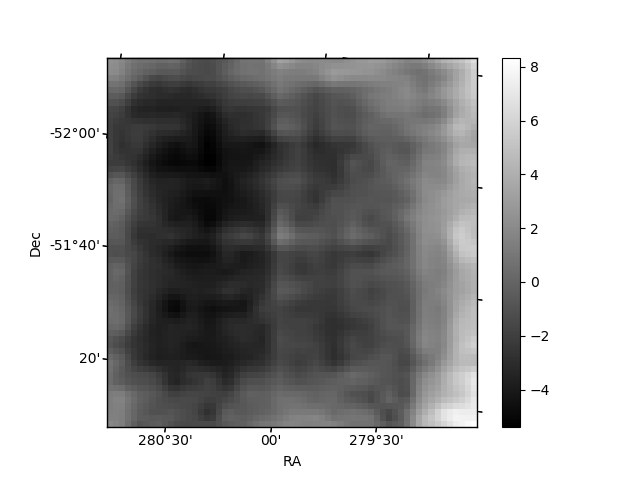
Histogram calculated using DETX and DETY for each event in the final _common_clean file
| Quadrant A | 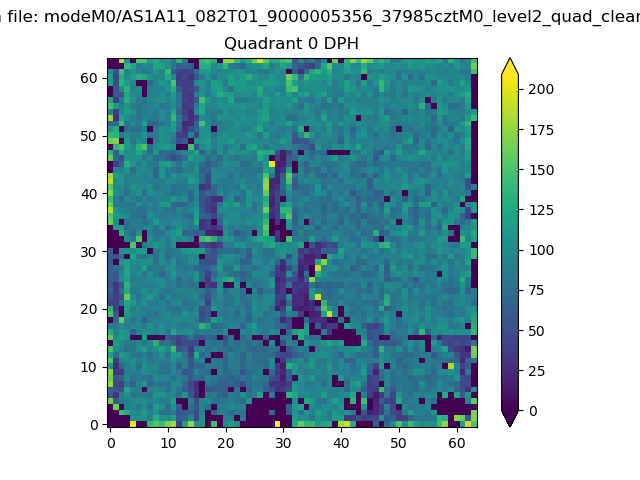 |
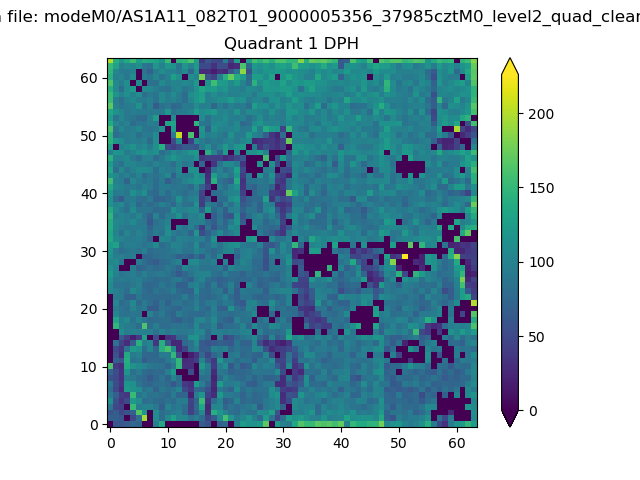 |
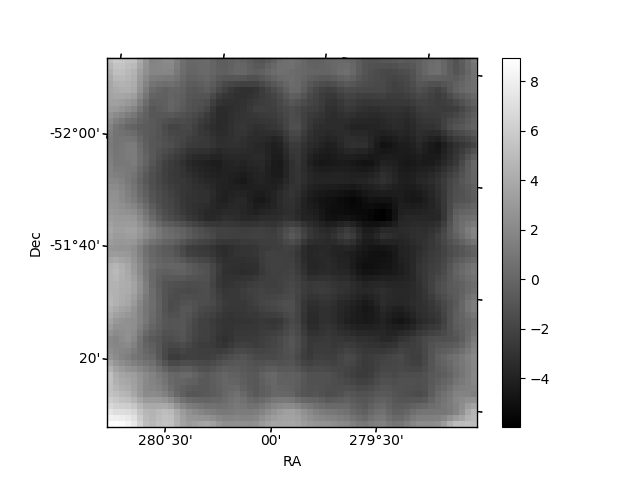
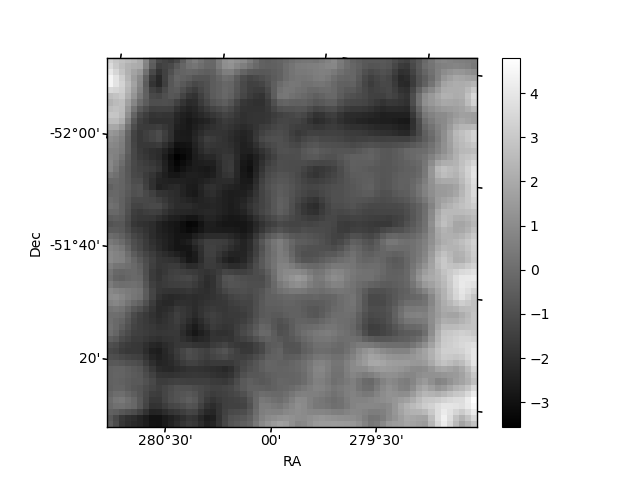
Quadrant B |
|---|---|---|---|
| Quadrant D | 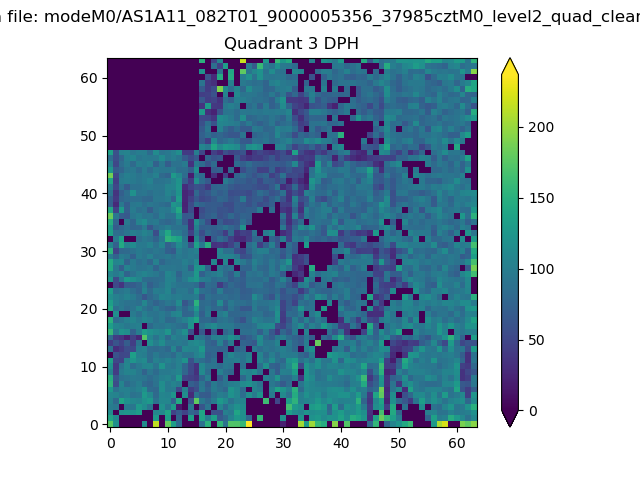 |
 |
Quadrant C |
| Plot type | Count rate plots | Images |
|---|---|---|
| Comparison with Poisson distribution Blue bars denote a histogram of data divided into 1 sec bins. Red curve is a Poisson curve with rate = median count rate of data. |
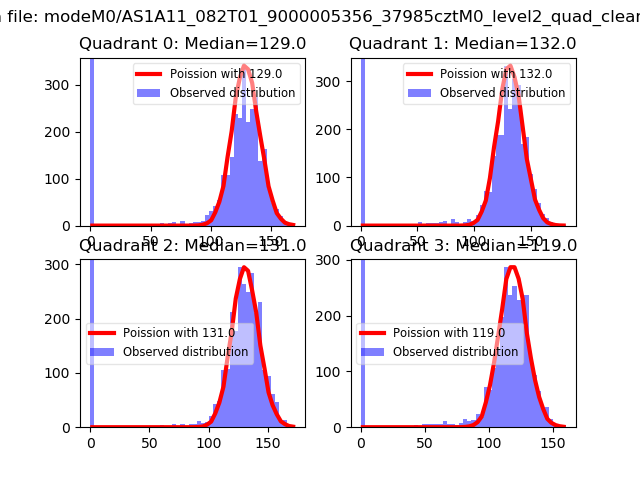 |
 |
| Quadrant-wise count rates Data is divided into 100 sec bins |
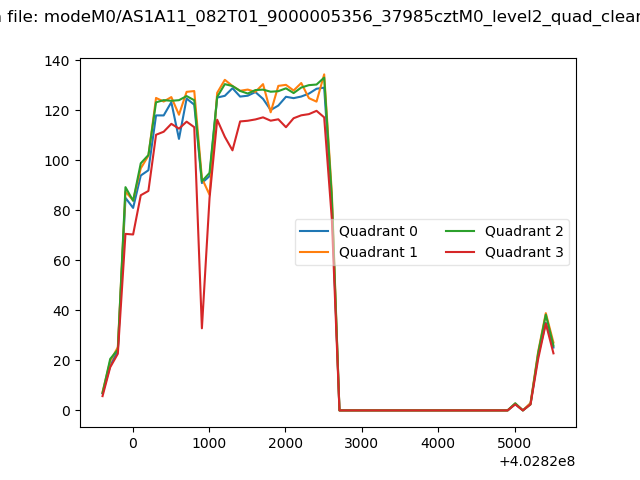 |
|
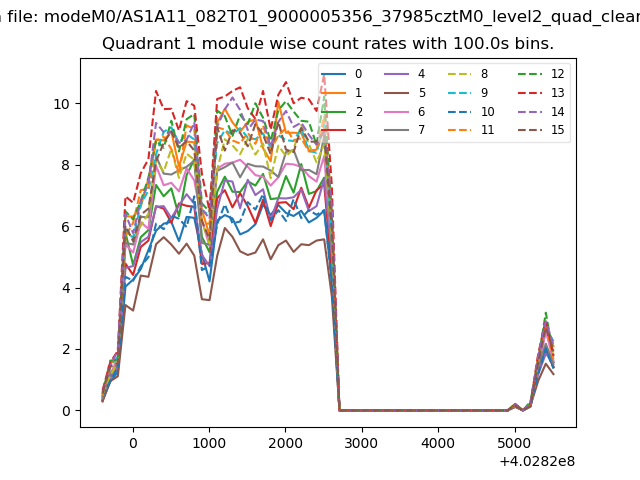
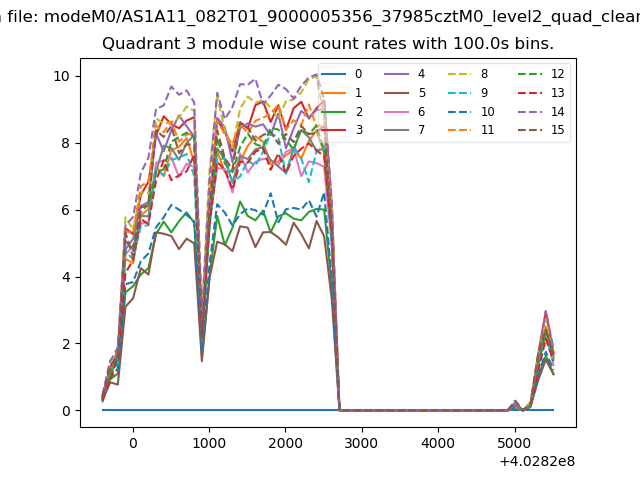
| Module-wise count rates for Quadrant A Data is divided into 100 sec bins |
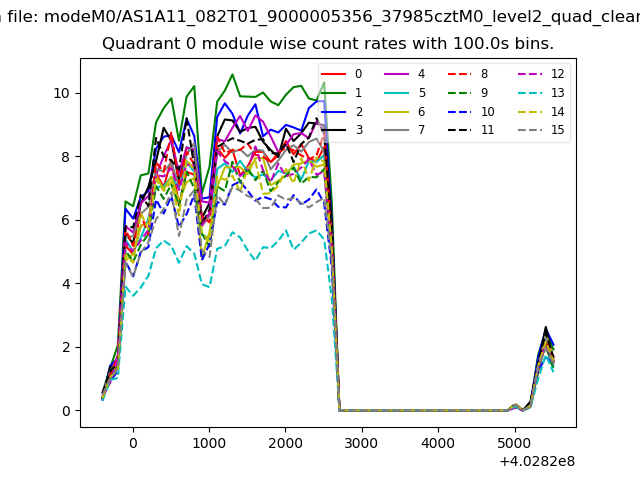 |
 |
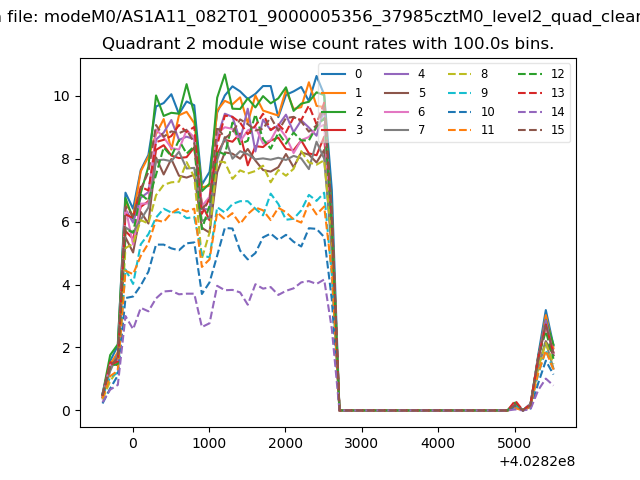
| Module-wise count rates for Quadrant B Data is divided into 100 sec bins |
 |
 |
| Module-wise count rates for Quadrant C Data is divided into 100 sec bins |
 |
 |
| Module-wise count rates for Quadrant D Data is divided into 100 sec bins |
 |
 |
| Parameter | Plot |
|---|---|
| CZT HV Monitor | 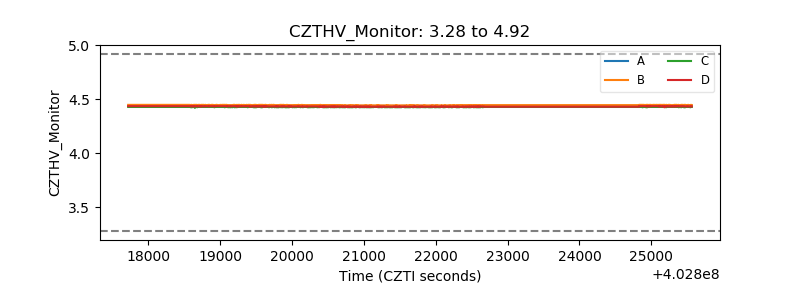 |
| D_VDD | 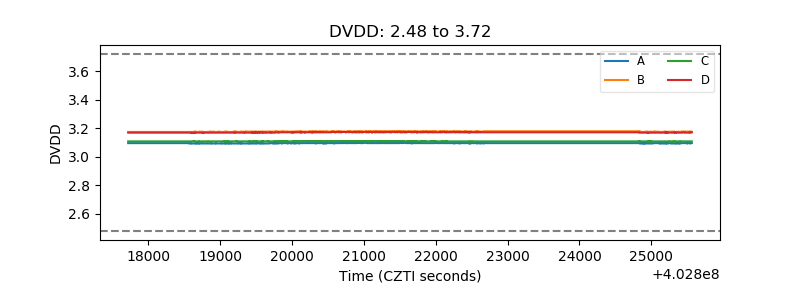 |
| Temperature 1 | 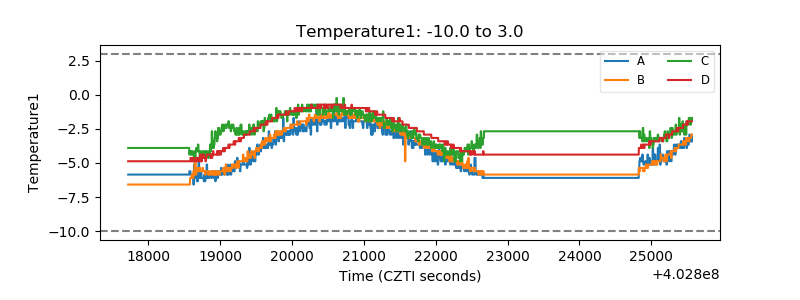 |
| Veto HV Monitor | 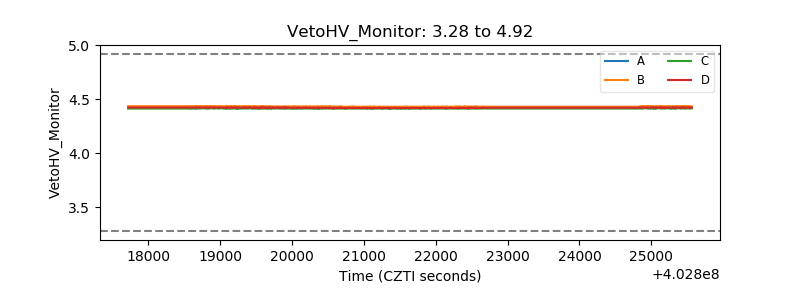 |
| Veto LLD | 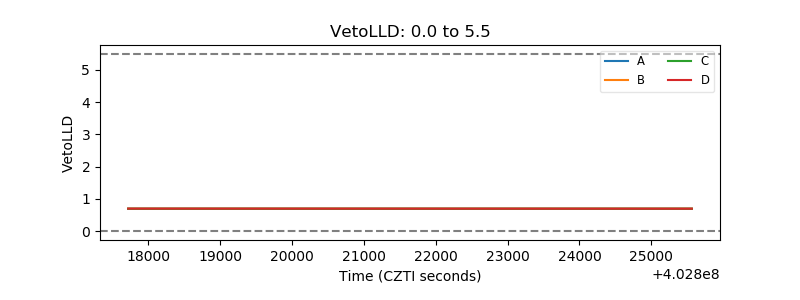 |
| Alpha Counter | 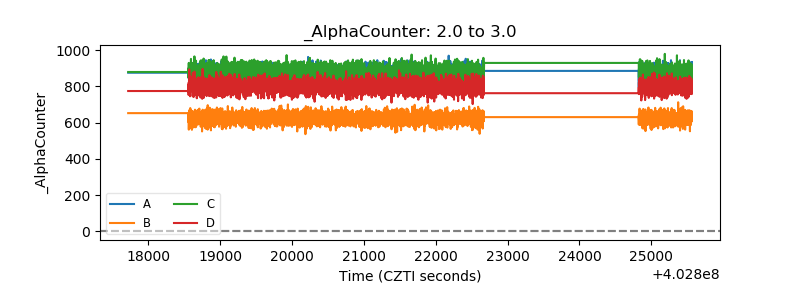 |
| _CPM_Rate | 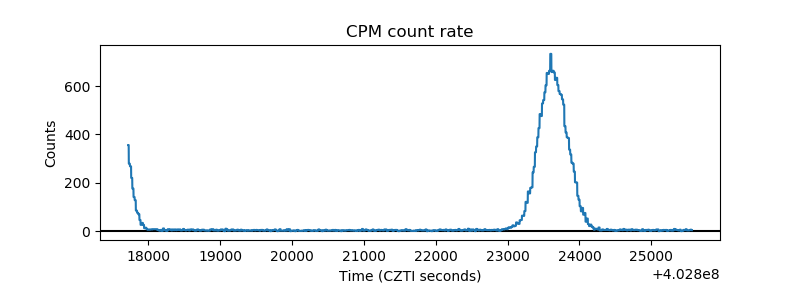 |
| CZT Counter | 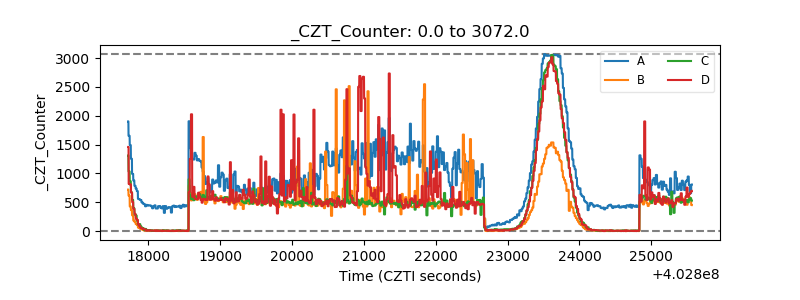 |
| +2.5 Volts monitor | 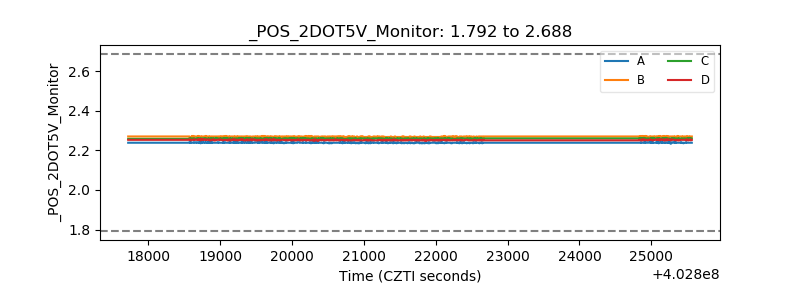 |
| +5 Volts monitor | 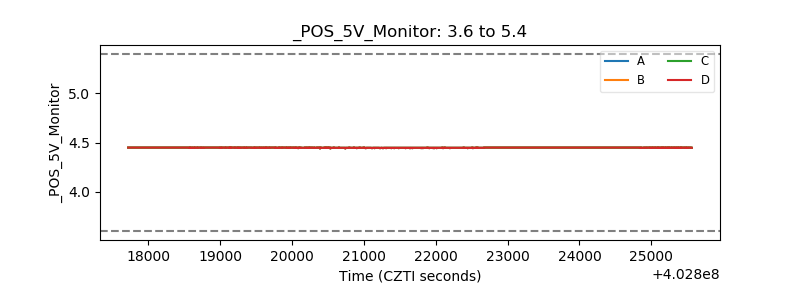 |
| _ROLL_ROT | 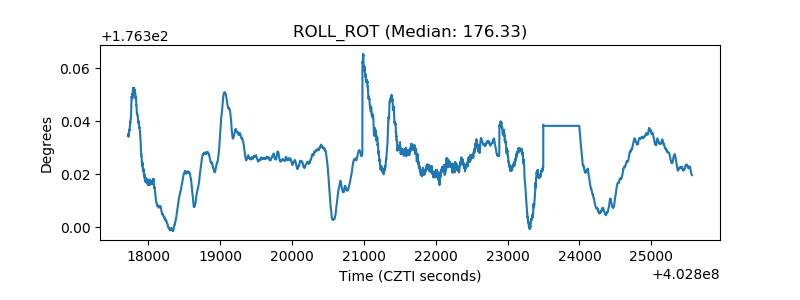 |
| _Roll_DEC | 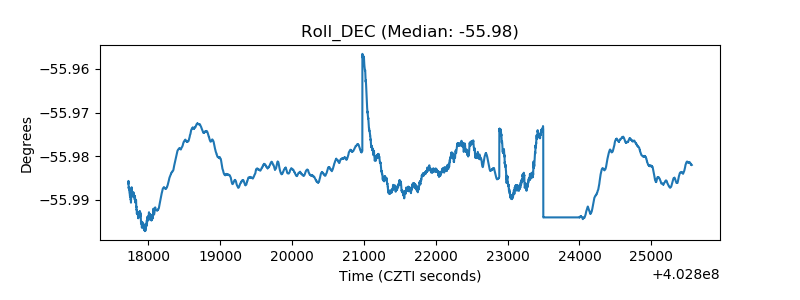 |
| _Roll_RA | 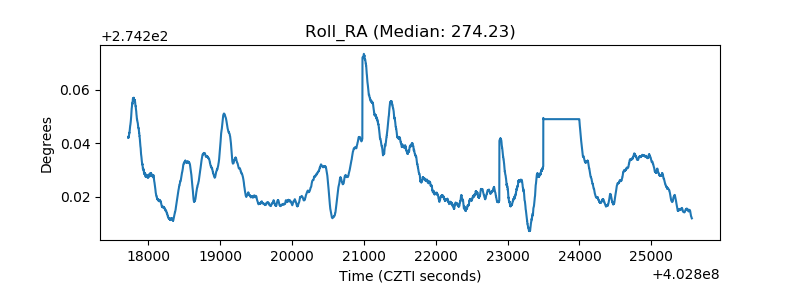 |
| Veto Counter | 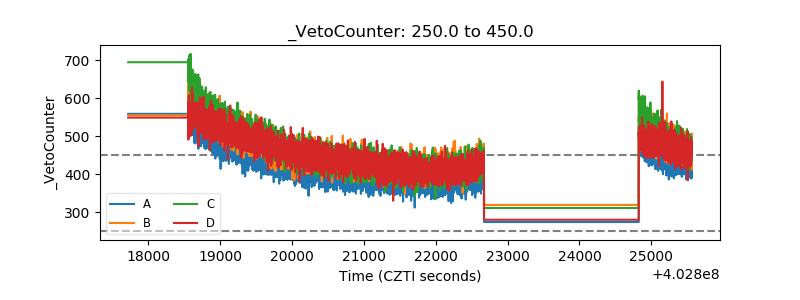 |