| Param | Original file | Final file |
|---|---|---|
| Filename | modeM0/AS1A11_082T01_9000005356_37986cztM0_level2.fits | modeM0/AS1A11_082T01_9000005356_37986cztM0_level2_quad_clean.evt |
| Size (bytes) | 379,238,400 | 76,011,840 |
| Size | 361.7 MB | 72.5 MB |
| Events in quadrant A | 5,088,898 | 489,663 |
| Events in quadrant B | 2,529,401 | 510,510 |
| Events in quadrant C | 2,491,187 | 503,380 |
| Events in quadrant D | 3,547,642 | 453,829 |
| Mode M0 | |||
|---|---|---|---|
| Quadrant | BADHDUFLAG | Total packets | Discarded packets |
| A | 0 | 18643 | 3 |
| B | 0 | 10553 | 2 |
| C | 0 | 10208 | 2 |
| D | 0 | 13736 | 2 |
| Mode SS | |||
|---|---|---|---|
| Quadrant | BADHDUFLAG | Total packets | Discarded packets |
| A | 0 | 100 | 0 |
| B | 0 | 100 | 0 |
| C | 0 | 100 | 0 |
| D | 0 | 100 | 0 |
| Mode M9 | |||
|---|---|---|---|
| Quadrant | BADHDUFLAG | Total packets | Discarded packets |
| A | 0 | 29 | 0 |
| B | 0 | 29 | 0 |
| C | 0 | 29 | 0 |
| D | 0 | 30 | 0 |
| Quadrant | Total seconds | Saturated seconds | Saturation percentage |
|---|---|---|---|
| A | 4907 | 115 | 2.343591% |
| B | 4907 | 45 | 0.917057% |
| C | 4907 | 10 | 0.203791% |
| D | 4907 | 82 | 1.671082% |
Noise dominated data is calculated using 1-second bins in cleaned event files. If a bin has >2000 counts, and if more than 50% of those come from <1% of pixels, then it is considered to be noise-dominated and hence unusable.
| Quadrant | # 1 sec bins | Bins with >0 counts | Bins with >2000 counts | High rate bins dominated by noise | Noise dominated (total time) | Noise dominated (detector-on time) | Marked lightcurve |
|---|---|---|---|---|---|---|---|
| A | 7000 | 4908 | 82 | 82 | 1.17% | 1.67% | 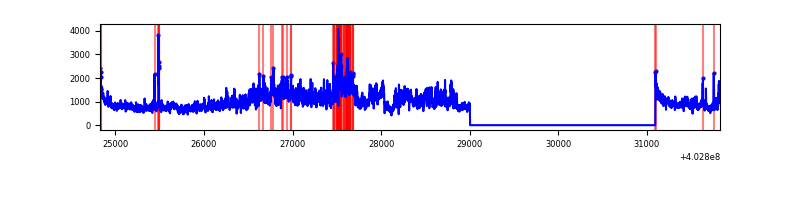 |
| B | 7000 | 4908 | 23 | 23 | 0.33% | 0.47% | 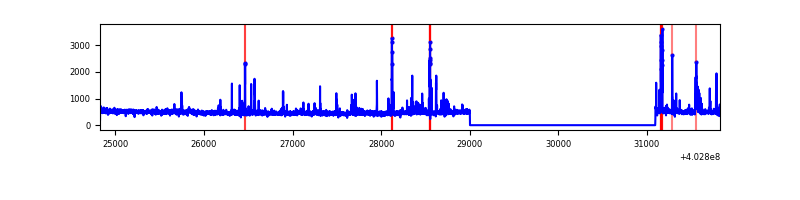 |
| C | 7000 | 4908 | 6 | 6 | 0.09% | 0.12% | 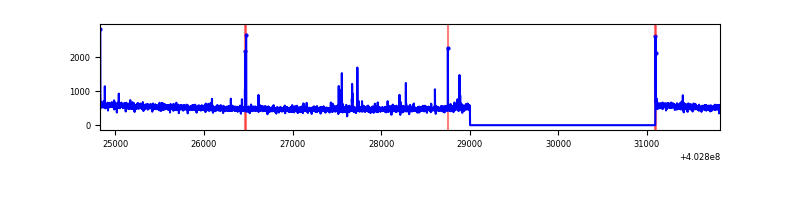 |
| D | 7000 | 4908 | 96 | 96 | 1.37% | 1.96% | 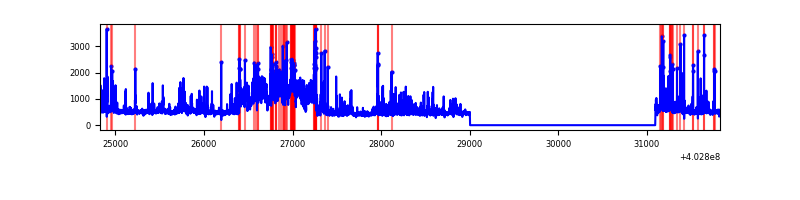 |
Top three noisy pixels from each quadrant. If the there are fewer than three noisy pixels in the level2.evt file, extra rows are filled as -1
| Pixel properties | Quadrant properties | ||||||
|---|---|---|---|---|---|---|---|
| Quadrant | DetID | PixID | Counts | Sigma | Mean | Median | Sigma |
| A | 15 | 222 | 2241534 | 19276.27 | 578 | 567 | 116.3 |
| A | 10 | 83 | 361262 | 3102.61 | 578 | 567 | 116.3 |
| A | 12 | 16 | 124880 | 1069.31 | 578 | 567 | 116.3 |
| B | 5 | 172 | 153209 | 1387.07 | 576 | 561 | 110.1 |
| B | 5 | 184 | 64980 | 585.36 | 576 | 561 | 110.1 |
| B | 4 | 81 | 22566 | 199.95 | 576 | 561 | 110.1 |
| C | 15 | 214 | 213118 | 1619.18 | 569 | 573 | 131.3 |
| C | 14 | 254 | 38889 | 291.89 | 569 | 573 | 131.3 |
| C | 0 | 10 | 13199 | 96.19 | 569 | 573 | 131.3 |
| D | 12 | 233 | 775729 | 5640.45 | 566 | 551 | 137.4 |
| D | 1 | 47 | 91972 | 665.21 | 566 | 551 | 137.4 |
| D | 1 | 52 | 80589 | 582.38 | 566 | 551 | 137.4 |
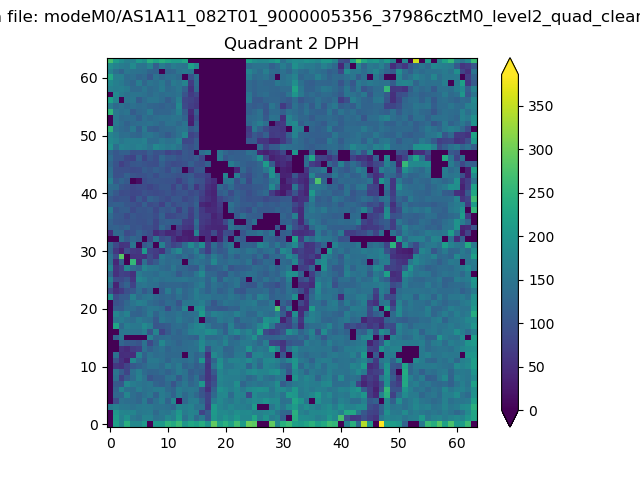
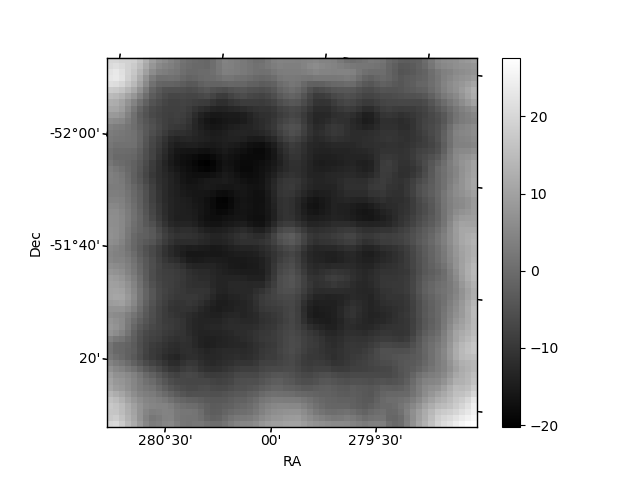
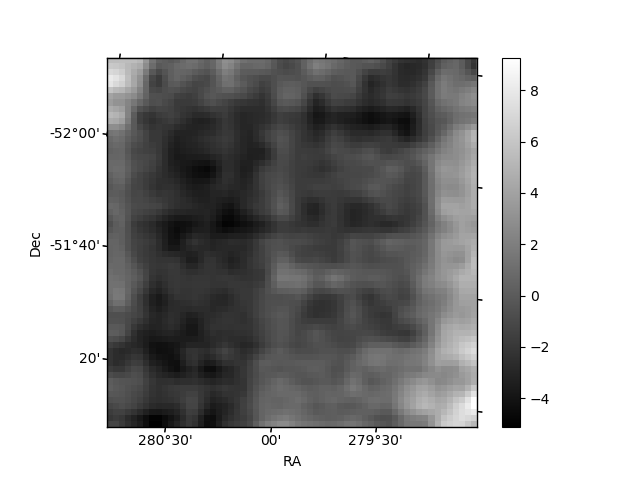
Histogram calculated using DETX and DETY for each event in the final _common_clean file
| Quadrant A | 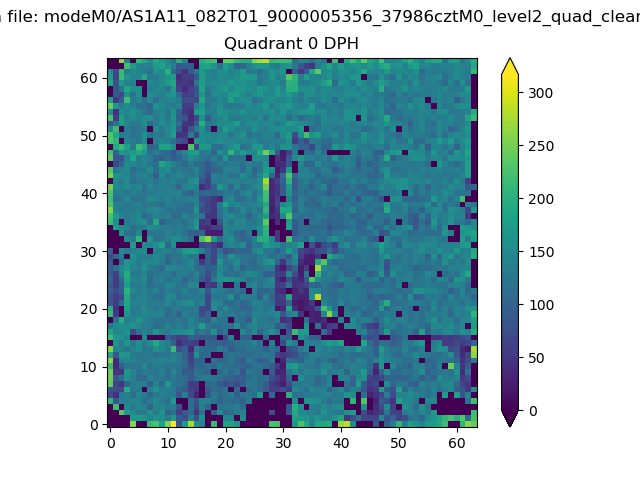 |
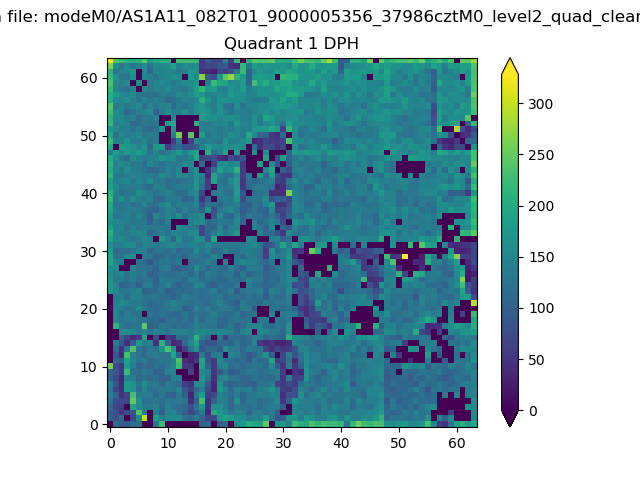 |
Quadrant B |
|---|---|---|---|
| Quadrant D | 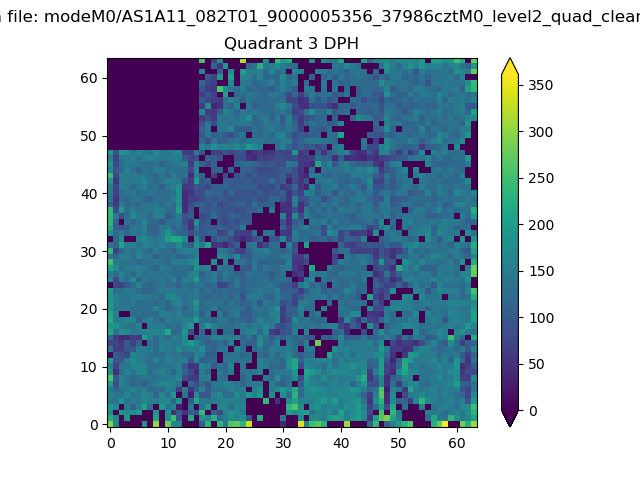 |
 |
Quadrant C |
| Plot type | Count rate plots | Images |
|---|---|---|
| Comparison with Poisson distribution Blue bars denote a histogram of data divided into 1 sec bins. Red curve is a Poisson curve with rate = median count rate of data. |
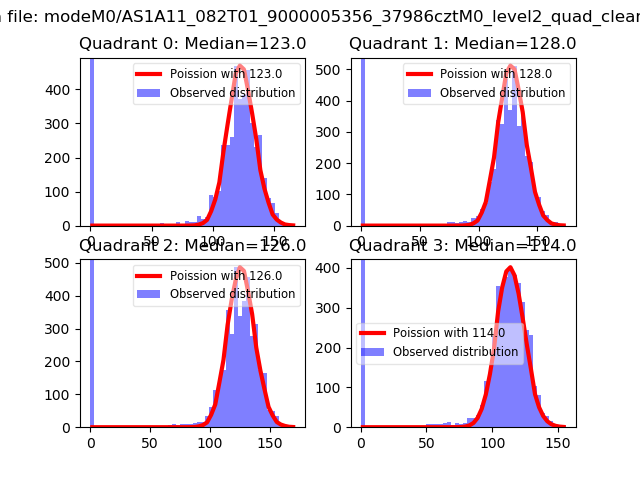 |
 |
| Quadrant-wise count rates Data is divided into 100 sec bins |
 |
|
| Module-wise count rates for Quadrant A Data is divided into 100 sec bins |
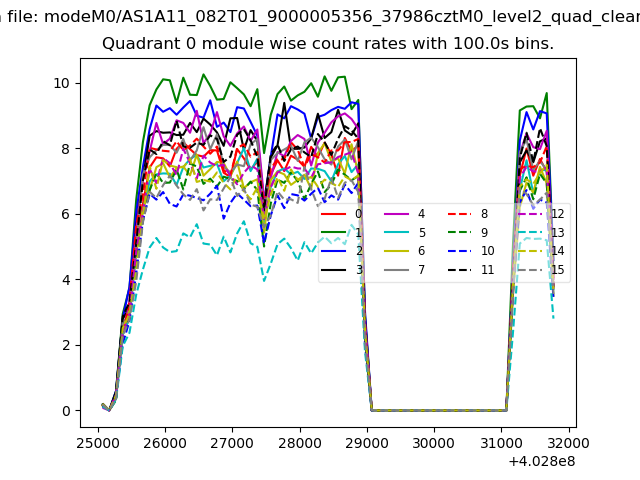 |
 |
| Module-wise count rates for Quadrant B Data is divided into 100 sec bins |
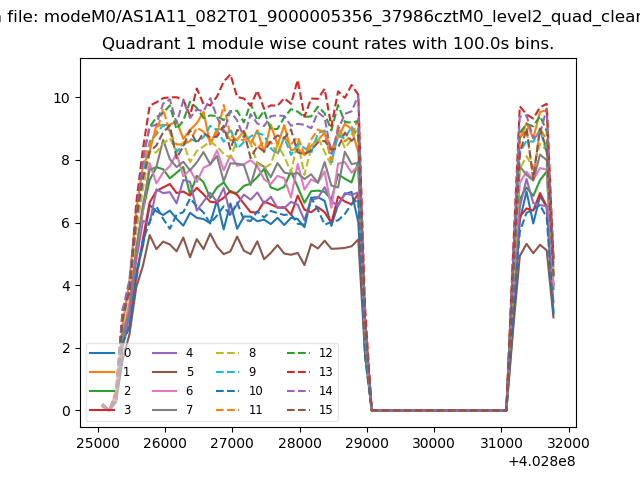 |
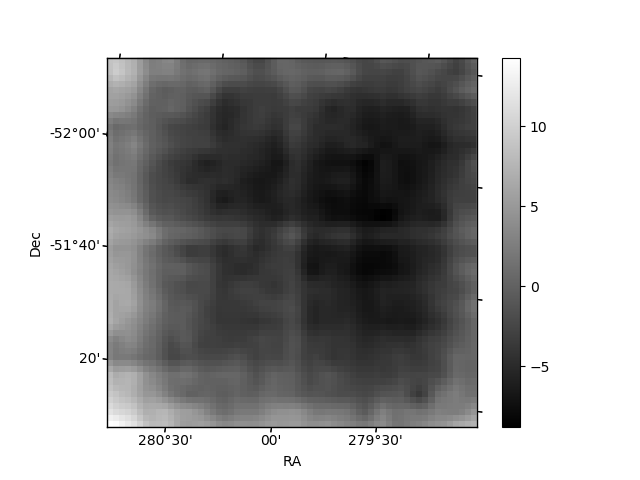 |
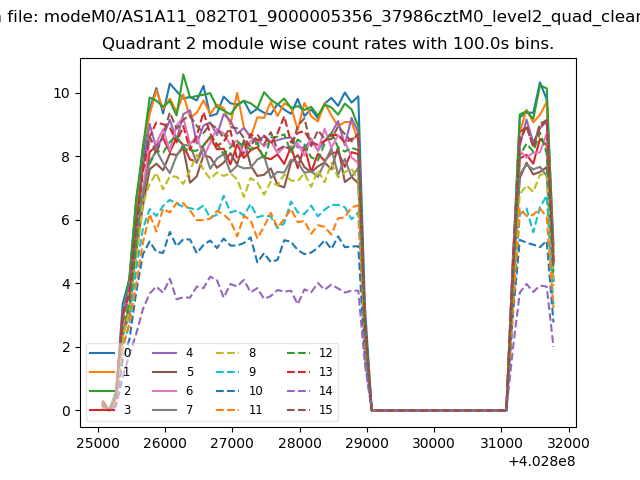
| Module-wise count rates for Quadrant C Data is divided into 100 sec bins |
 |
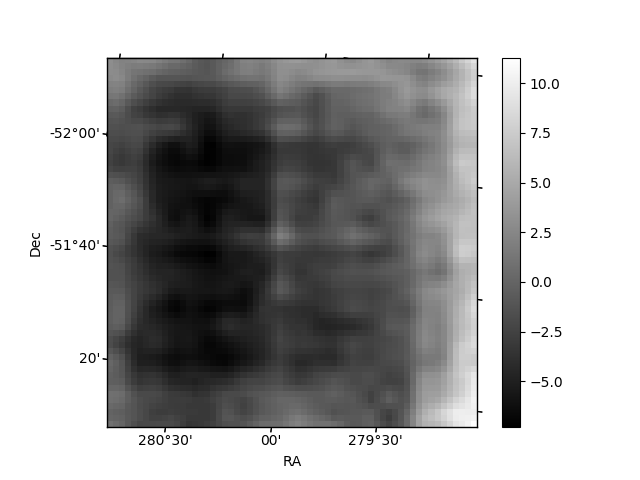 |
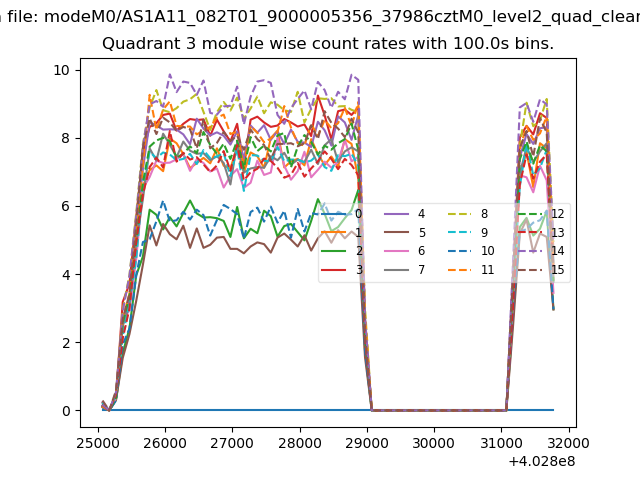
| Module-wise count rates for Quadrant D Data is divided into 100 sec bins |
 |
 |
| Parameter | Plot |
|---|---|
| CZT HV Monitor | 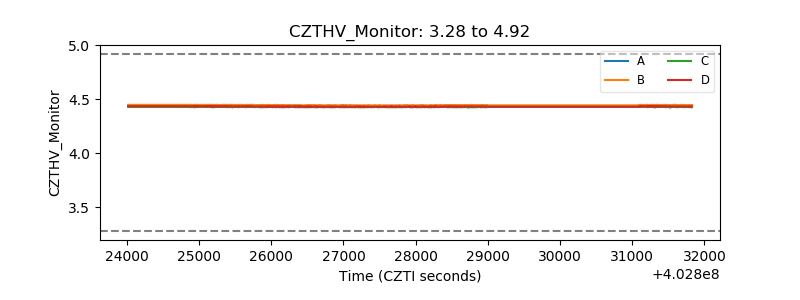 |
| D_VDD | 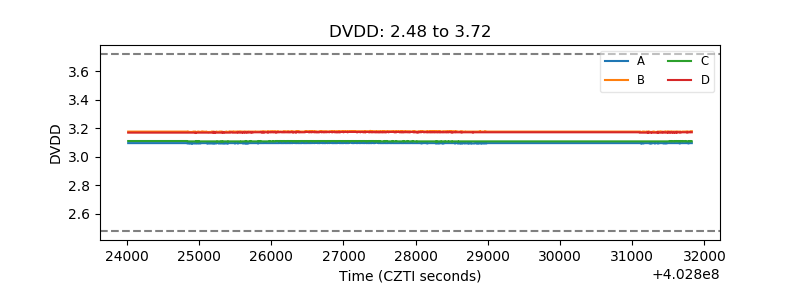 |
| Temperature 1 | 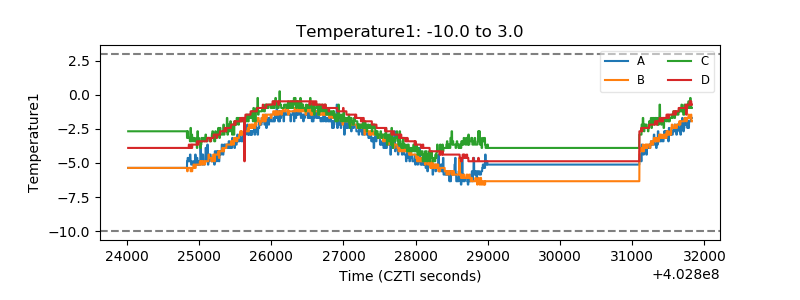 |
| Veto HV Monitor | 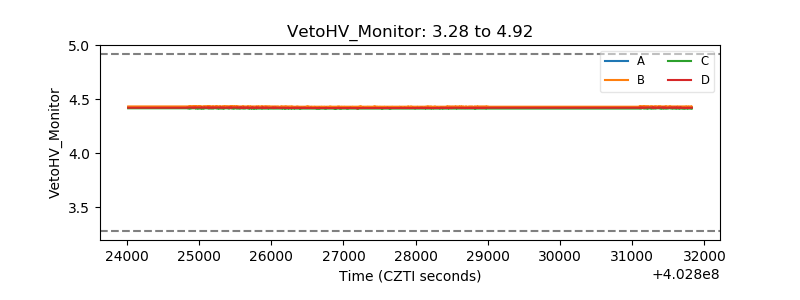 |
| Veto LLD | 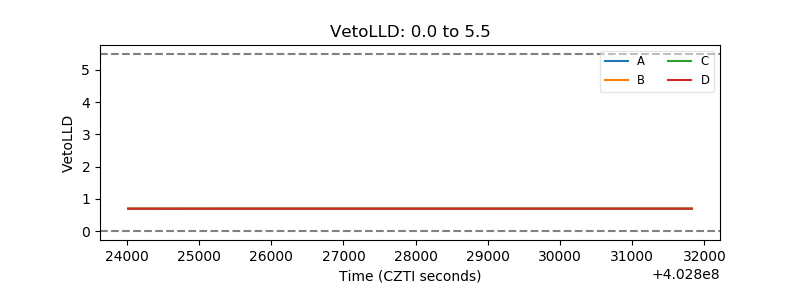 |
| Alpha Counter | 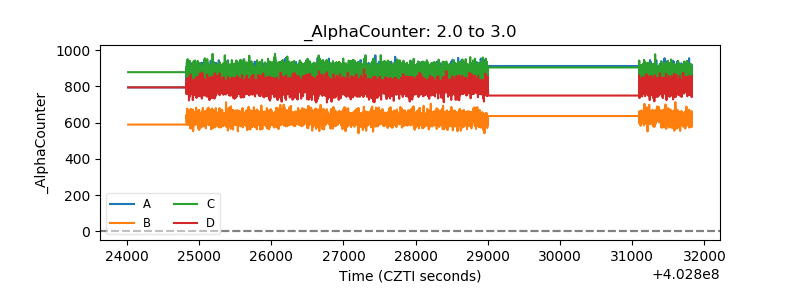 |
| _CPM_Rate | 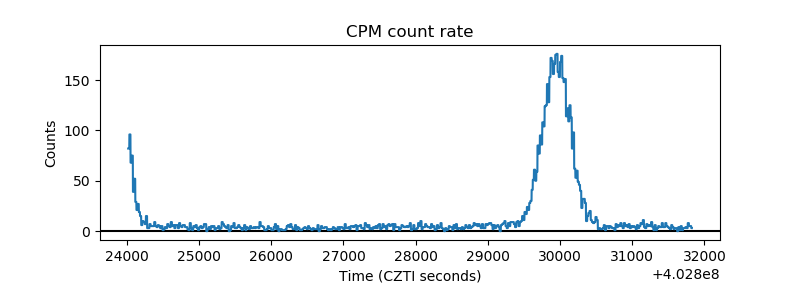 |
| CZT Counter | 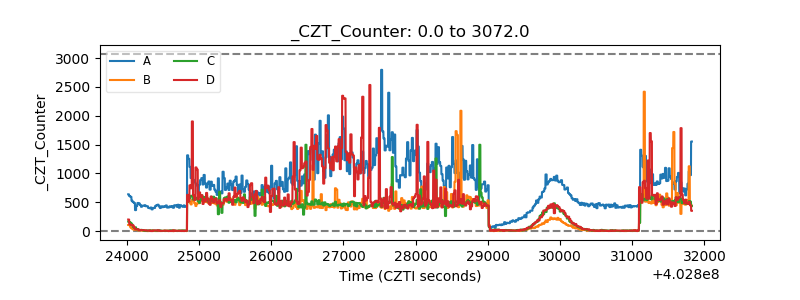 |
| +2.5 Volts monitor | 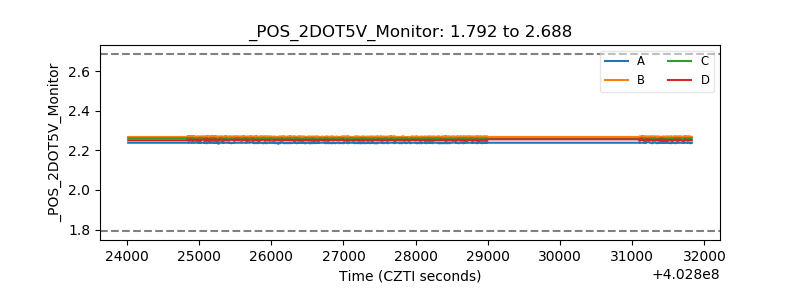 |
| +5 Volts monitor | 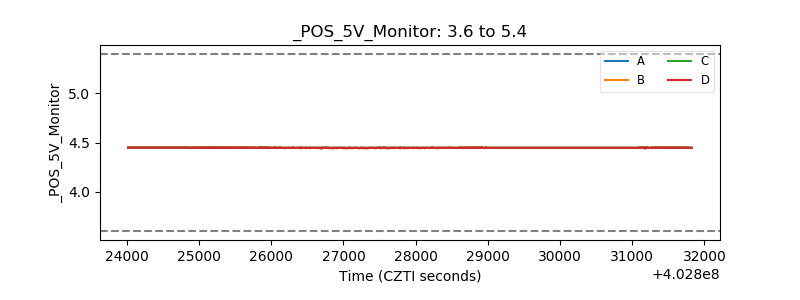 |
| _ROLL_ROT | 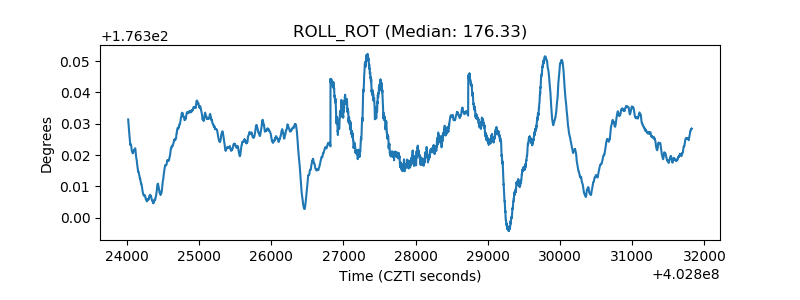 |
| _Roll_DEC | 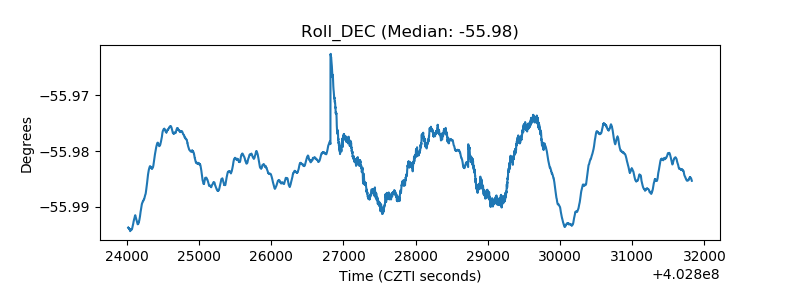 |
| _Roll_RA | 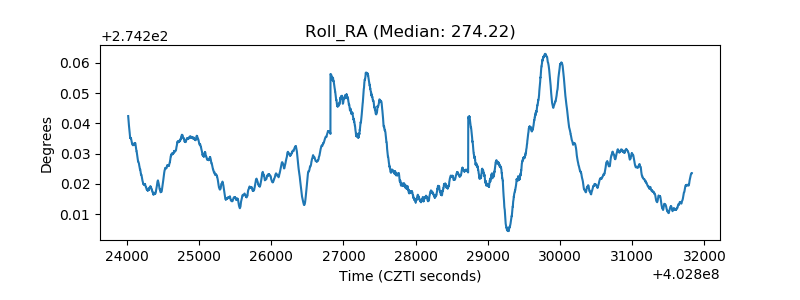 |
| Veto Counter | 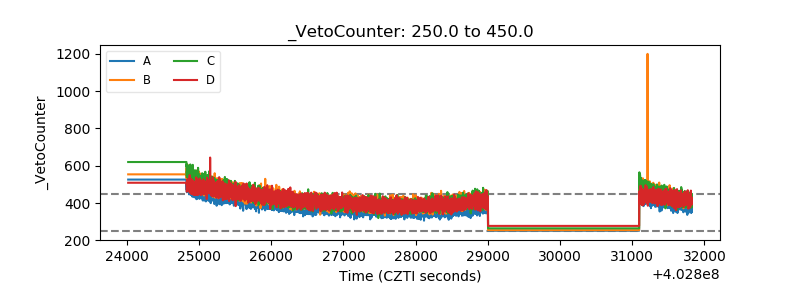 |