| Param | Original file | Final file |
|---|---|---|
| Filename | modeM0/AS1A11_082T01_9000005356_37987cztM0_level2.fits | modeM0/AS1A11_082T01_9000005356_37987cztM0_level2_quad_clean.evt |
| Size (bytes) | 401,230,080 | 77,448,960 |
| Size | 382.6 MB | 73.9 MB |
| Events in quadrant A | 4,371,793 | 519,243 |
| Events in quadrant B | 2,936,064 | 534,267 |
| Events in quadrant C | 2,553,261 | 529,154 |
| Events in quadrant D | 4,586,765 | 398,055 |
| Mode M0 | |||
|---|---|---|---|
| Quadrant | BADHDUFLAG | Total packets | Discarded packets |
| A | 0 | 16769 | 3 |
| B | 0 | 12066 | 2 |
| C | 0 | 10672 | 2 |
| D | 0 | 17181 | 2 |
| Mode SS | |||
|---|---|---|---|
| Quadrant | BADHDUFLAG | Total packets | Discarded packets |
| A | 0 | 106 | 0 |
| B | 0 | 106 | 0 |
| C | 0 | 106 | 0 |
| D | 0 | 106 | 0 |
| Mode M9 | |||
|---|---|---|---|
| Quadrant | BADHDUFLAG | Total packets | Discarded packets |
| A | 0 | 19 | 0 |
| B | 0 | 19 | 0 |
| C | 0 | 19 | 0 |
| D | 0 | 20 | 0 |
| Quadrant | Total seconds | Saturated seconds | Saturation percentage |
|---|---|---|---|
| A | 5201 | 70 | 1.345895% |
| B | 5201 | 93 | 1.788118% |
| C | 5201 | 10 | 0.192271% |
| D | 5201 | 847 | 16.285330% |
Noise dominated data is calculated using 1-second bins in cleaned event files. If a bin has >2000 counts, and if more than 50% of those come from <1% of pixels, then it is considered to be noise-dominated and hence unusable.
| Quadrant | # 1 sec bins | Bins with >0 counts | Bins with >2000 counts | High rate bins dominated by noise | Noise dominated (total time) | Noise dominated (detector-on time) | Marked lightcurve |
|---|---|---|---|---|---|---|---|
| A | 7054 | 5202 | 23 | 23 | 0.33% | 0.44% | 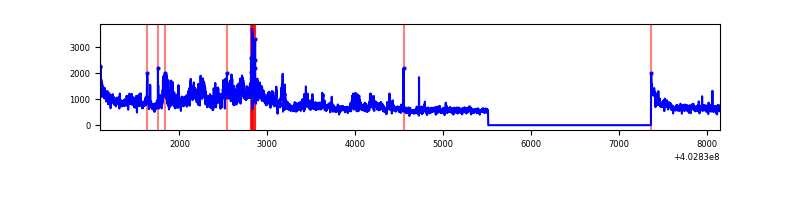 |
| B | 7054 | 5202 | 54 | 54 | 0.77% | 1.04% | 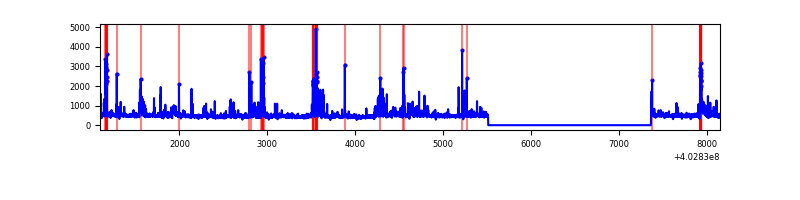 |
| C | 7054 | 5202 | 5 | 5 | 0.07% | 0.10% | 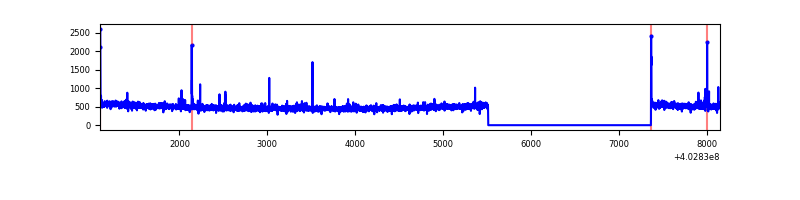 |
| D | 7054 | 5202 | 754 | 754 | 10.69% | 14.49% | 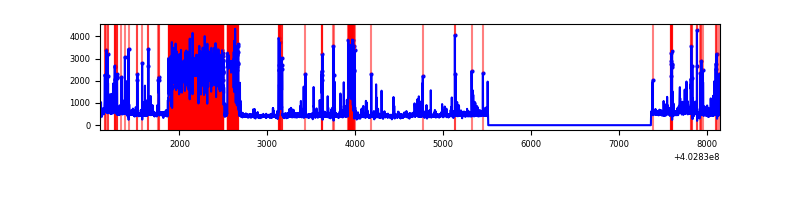 |
Top three noisy pixels from each quadrant. If the there are fewer than three noisy pixels in the level2.evt file, extra rows are filled as -1
| Pixel properties | Quadrant properties | ||||||
|---|---|---|---|---|---|---|---|
| Quadrant | DetID | PixID | Counts | Sigma | Mean | Median | Sigma |
| A | 15 | 222 | 1467190 | 12156.78 | 593 | 580 | 120.6 |
| A | 10 | 83 | 381221 | 3155.15 | 593 | 580 | 120.6 |
| A | 12 | 16 | 109683 | 904.36 | 593 | 580 | 120.6 |
| B | 5 | 184 | 282973 | 2502.67 | 591 | 576 | 112.8 |
| B | 5 | 172 | 141556 | 1249.4 | 591 | 576 | 112.8 |
| B | 0 | 186 | 64769 | 568.89 | 591 | 576 | 112.8 |
| C | 15 | 214 | 222545 | 1652.72 | 581 | 585 | 134.3 |
| C | 14 | 254 | 30041 | 219.33 | 581 | 585 | 134.3 |
| C | 0 | 10 | 16000 | 114.78 | 581 | 585 | 134.3 |
| D | 12 | 233 | 1351875 | 10075.43 | 540 | 523 | 134.1 |
| D | 1 | 52 | 497380 | 3704.47 | 540 | 523 | 134.1 |
| D | 2 | 249 | 194128 | 1443.48 | 540 | 523 | 134.1 |
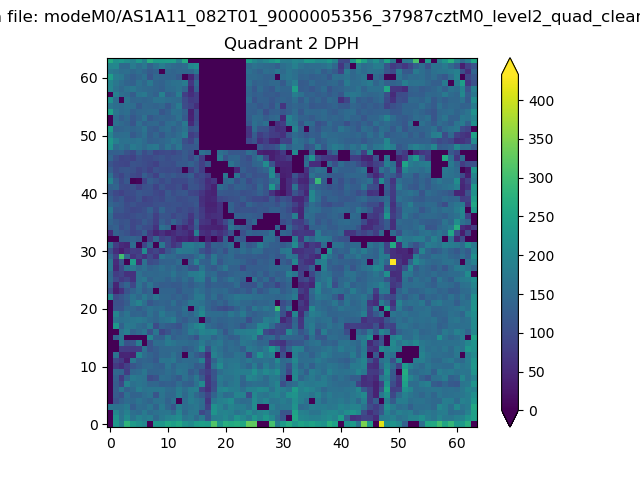
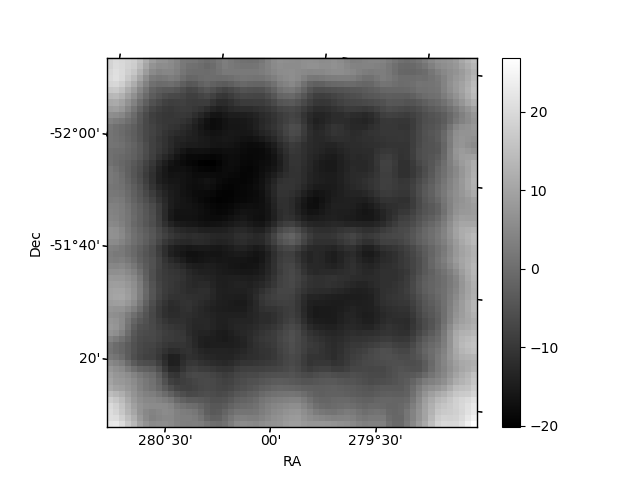
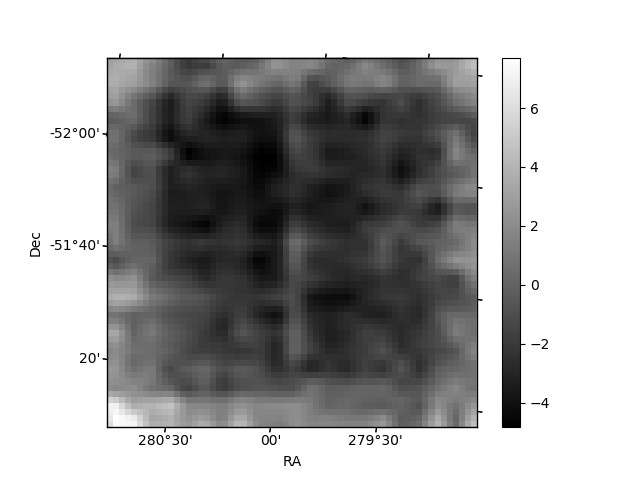
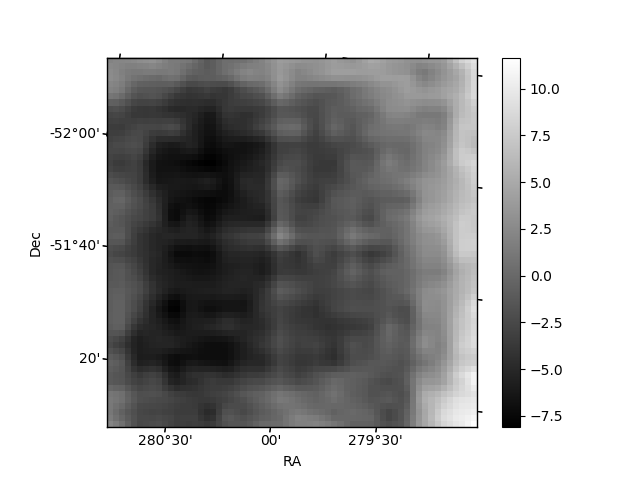
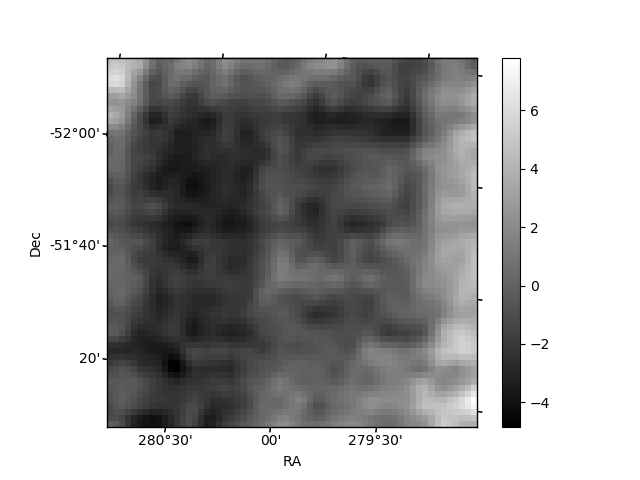
Histogram calculated using DETX and DETY for each event in the final _common_clean file
| Quadrant A | 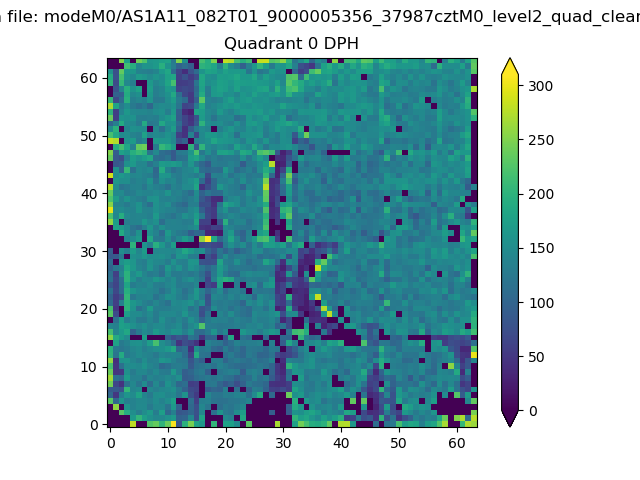 |
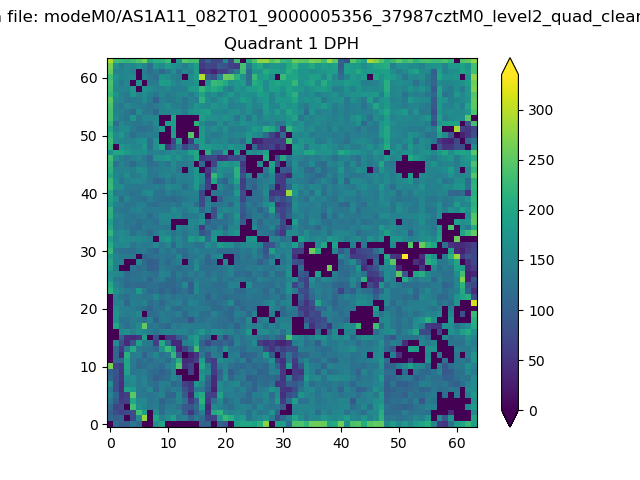 |
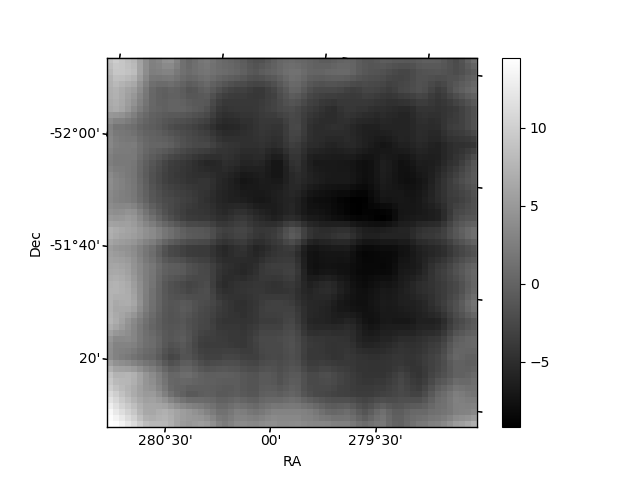
Quadrant B |
|---|---|---|---|
| Quadrant D | 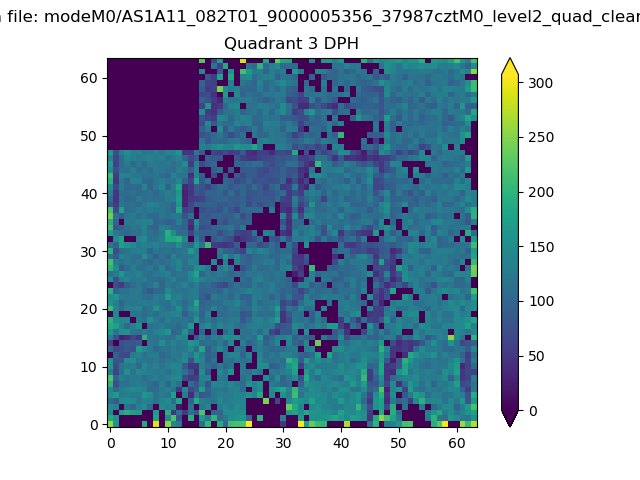 |
 |
Quadrant C |
| Plot type | Count rate plots | Images |
|---|---|---|
| Comparison with Poisson distribution Blue bars denote a histogram of data divided into 1 sec bins. Red curve is a Poisson curve with rate = median count rate of data. |
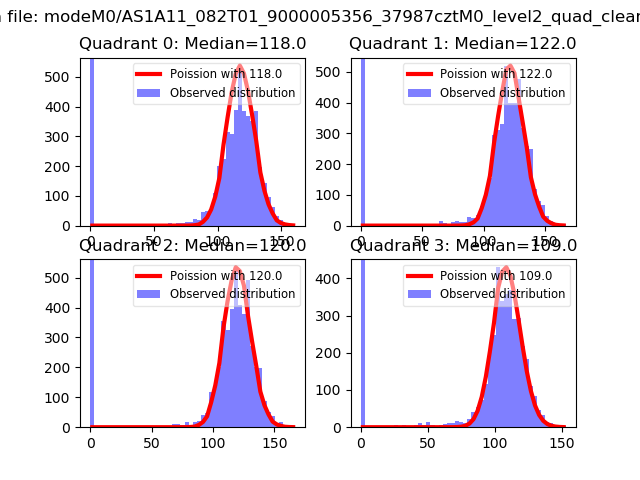 |
 |
| Quadrant-wise count rates Data is divided into 100 sec bins |
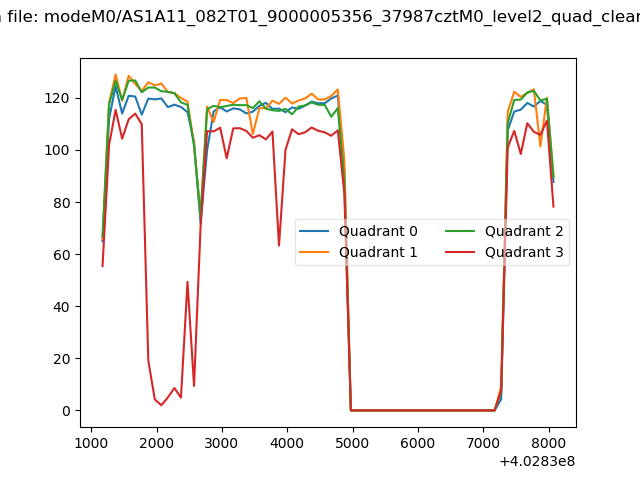 |
|
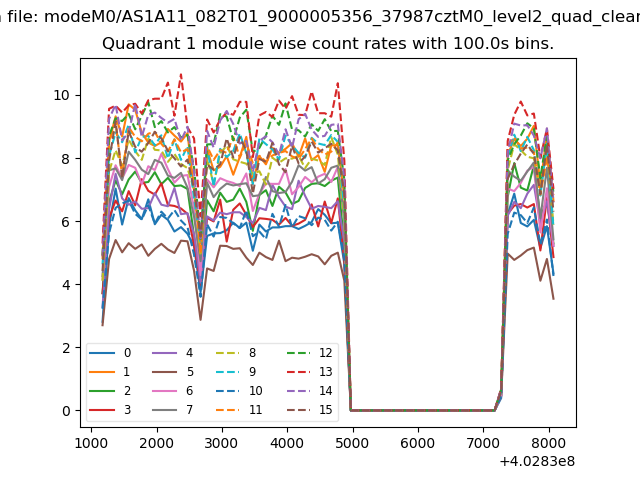
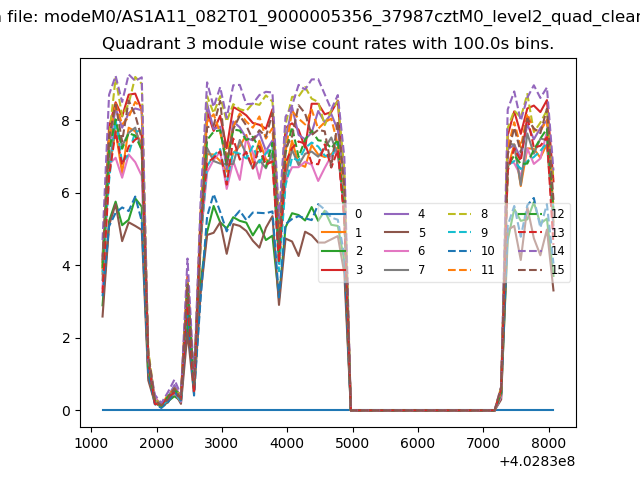
| Module-wise count rates for Quadrant A Data is divided into 100 sec bins |
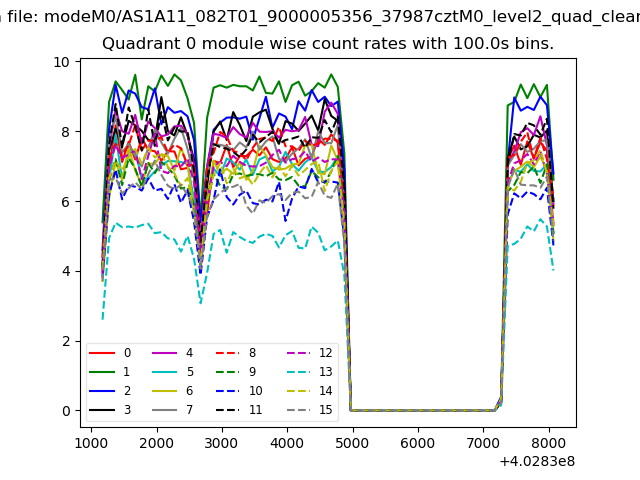 |
 |
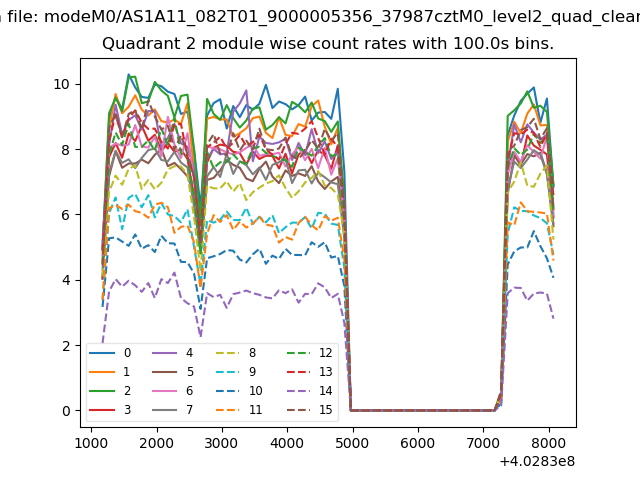
| Module-wise count rates for Quadrant B Data is divided into 100 sec bins |
 |
 |
| Module-wise count rates for Quadrant C Data is divided into 100 sec bins |
 |
 |
| Module-wise count rates for Quadrant D Data is divided into 100 sec bins |
 |
 |
| Parameter | Plot |
|---|---|
| CZT HV Monitor | 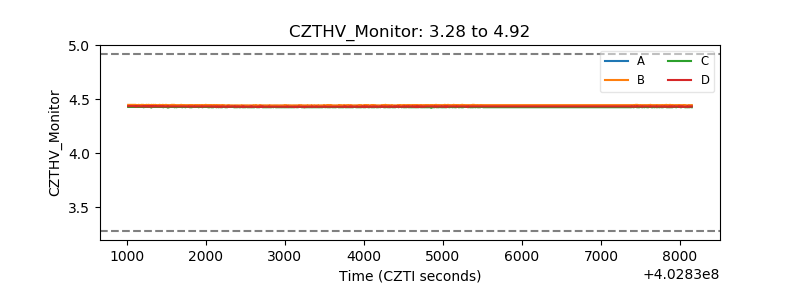 |
| D_VDD | 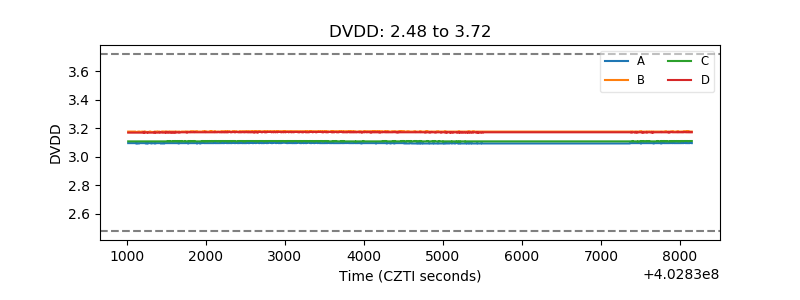 |
| Temperature 1 | 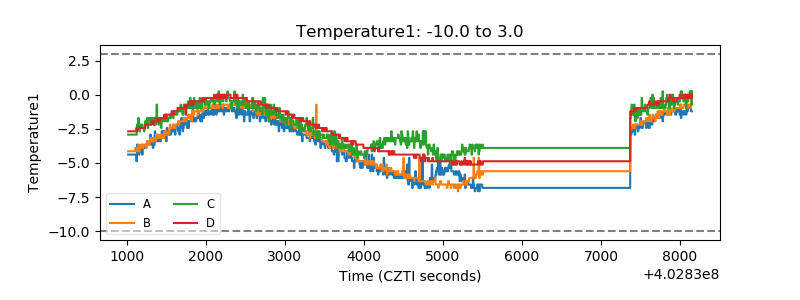 |
| Veto HV Monitor | 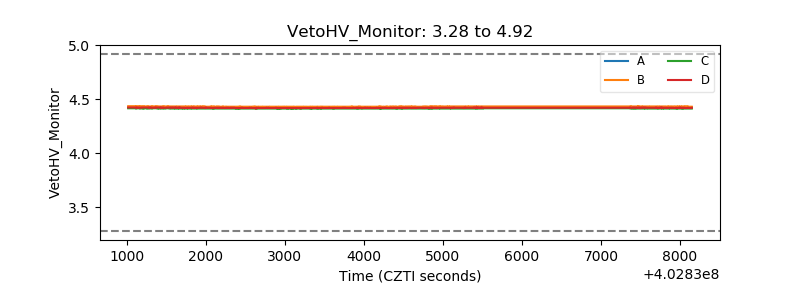 |
| Veto LLD | 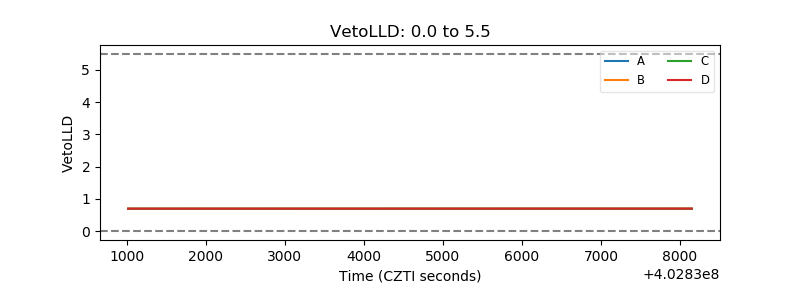 |
| Alpha Counter | 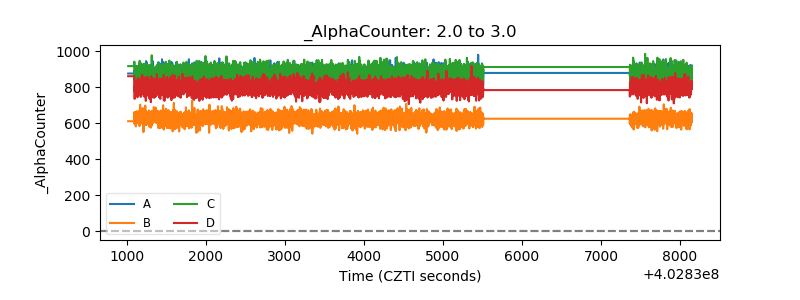 |
| _CPM_Rate | 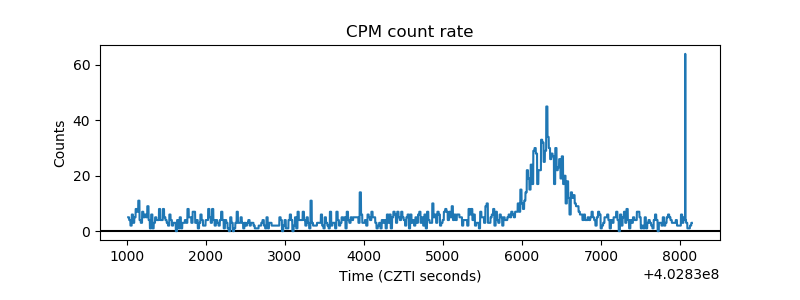 |
| CZT Counter | 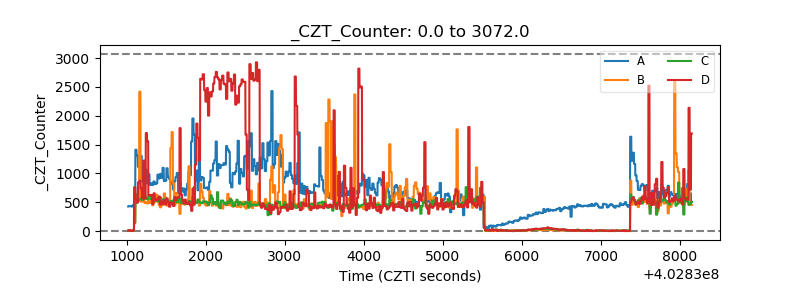 |
| +2.5 Volts monitor | 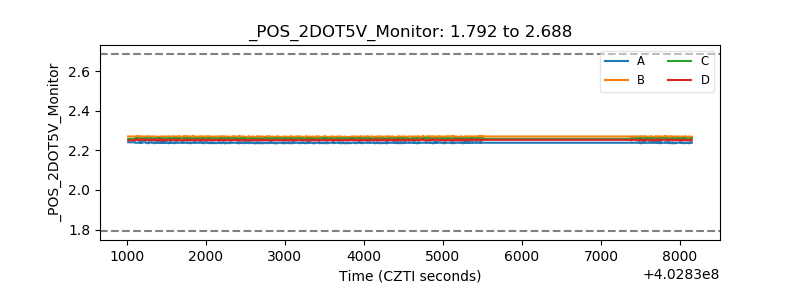 |
| +5 Volts monitor | 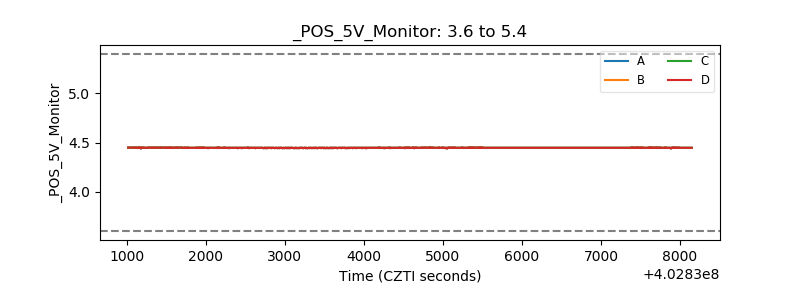 |
| _ROLL_ROT | 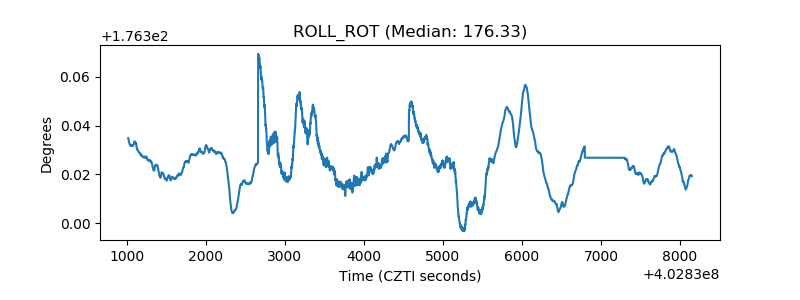 |
| _Roll_DEC | 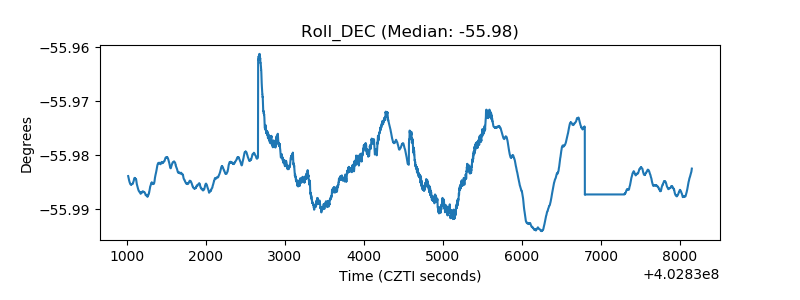 |
| _Roll_RA | 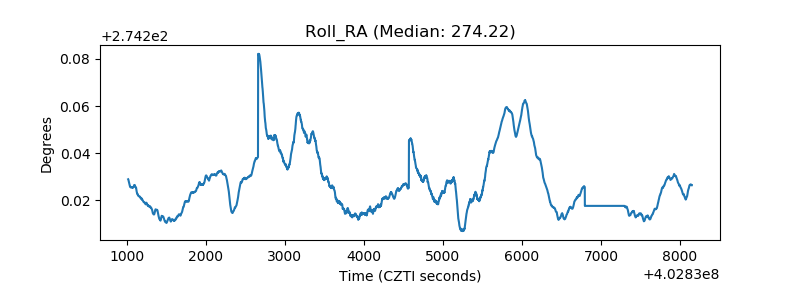 |
| Veto Counter | 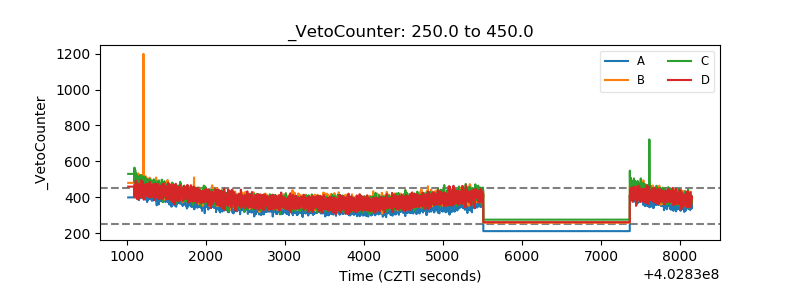 |