| Param | Original file | Final file |
|---|---|---|
| Filename | modeM0/AS1A11_082T01_9000005356_37988cztM0_level2.evt | modeM0/AS1A11_082T01_9000005356_37988cztM0_level2_quad_clean.evt |
| Size (bytes) | 487,192,320 | 79,511,040 |
| Size | 464.6 MB | 75.8 MB |
| Events in quadrant A | 4,091,451 | 508,271 |
| Events in quadrant B | 4,078,716 | 506,641 |
| Events in quadrant C | 2,851,773 | 515,443 |
| Events in quadrant D | 3,336,516 | 468,735 |
| Mode M0 | |||
|---|---|---|---|
| Quadrant | BADHDUFLAG | Total packets | Discarded packets |
| A | 0 | 16357 | 3 |
| B | 0 | 15957 | 2 |
| C | 0 | 12006 | 2 |
| D | 0 | 13754 | 2 |
| Mode SS | |||
|---|---|---|---|
| Quadrant | BADHDUFLAG | Total packets | Discarded packets |
| A | 0 | 118 | 0 |
| B | 0 | 118 | 0 |
| C | 0 | 118 | 0 |
| D | 0 | 118 | 0 |
| Mode M9 | |||
|---|---|---|---|
| Quadrant | BADHDUFLAG | Total packets | Discarded packets |
| A | 0 | 15 | 0 |
| B | 0 | 15 | 0 |
| C | 0 | 15 | 0 |
| D | 0 | 16 | 0 |
| Quadrant | Total seconds | Saturated seconds | Saturation percentage |
|---|---|---|---|
| A | 5847 | 52 | 0.889345% |
| B | 5847 | 257 | 4.395416% |
| C | 5847 | 8 | 0.136822% |
| D | 5847 | 82 | 1.402429% |
Noise dominated data is calculated using 1-second bins in cleaned event files. If a bin has >2000 counts, and if more than 50% of those come from <1% of pixels, then it is considered to be noise-dominated and hence unusable.
| Quadrant | # 1 sec bins | Bins with >0 counts | Bins with >2000 counts | High rate bins dominated by noise | Noise dominated (total time) | Noise dominated (detector-on time) | Marked lightcurve |
|---|---|---|---|---|---|---|---|
| A | 7340 | 5848 | 27 | 27 | 0.37% | 0.46% | 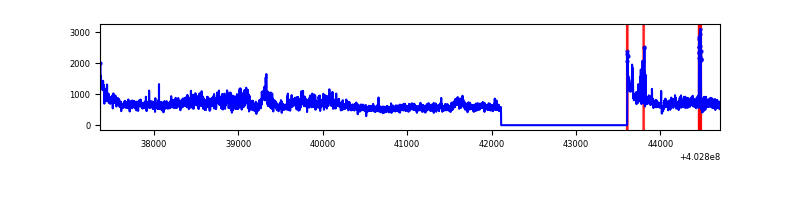 |
| B | 7340 | 5848 | 178 | 178 | 2.43% | 3.04% | 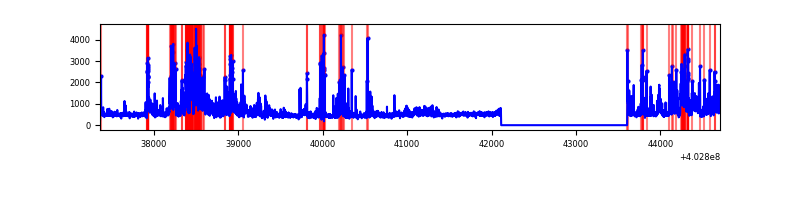 |
| C | 7340 | 5848 | 5 | 5 | 0.07% | 0.09% | 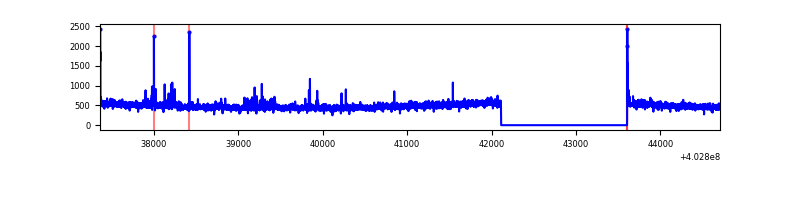 |
| D | 7340 | 5848 | 65 | 65 | 0.89% | 1.11% | 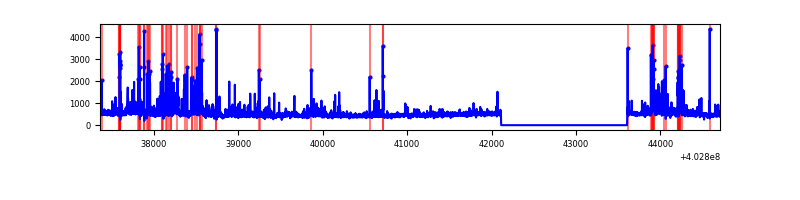 |
Top three noisy pixels from each quadrant. If the there are fewer than three noisy pixels in the level2.evt file, extra rows are filled as -1
| Pixel properties | Quadrant properties | ||||||
|---|---|---|---|---|---|---|---|
| Quadrant | DetID | PixID | Counts | Sigma | Mean | Median | Sigma |
| A | 15 | 222 | 998090 | 7434.06 | 661 | 649 | 134.2 |
| A | 10 | 83 | 423034 | 3148.09 | 661 | 649 | 134.2 |
| A | 12 | 227 | 44623 | 327.74 | 661 | 649 | 134.2 |
| B | 5 | 184 | 433484 | 3441.16 | 653 | 638 | 125.8 |
| B | 0 | 186 | 314530 | 2495.47 | 653 | 638 | 125.8 |
| B | 4 | 171 | 191124 | 1514.38 | 653 | 638 | 125.8 |
| C | 15 | 214 | 251563 | 1672.6 | 645 | 649 | 150.0 |
| C | 14 | 254 | 43810 | 287.71 | 645 | 649 | 150.0 |
| C | 0 | 10 | 19150 | 123.33 | 645 | 649 | 150.0 |
| D | 1 | 47 | 218294 | 1381.82 | 642 | 625 | 157.5 |
| D | 12 | 233 | 136082 | 859.92 | 642 | 625 | 157.5 |
| D | 2 | 250 | 101644 | 641.29 | 642 | 625 | 157.5 |
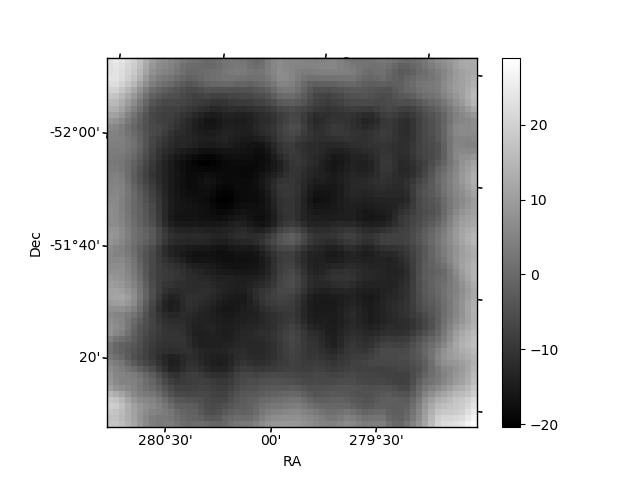
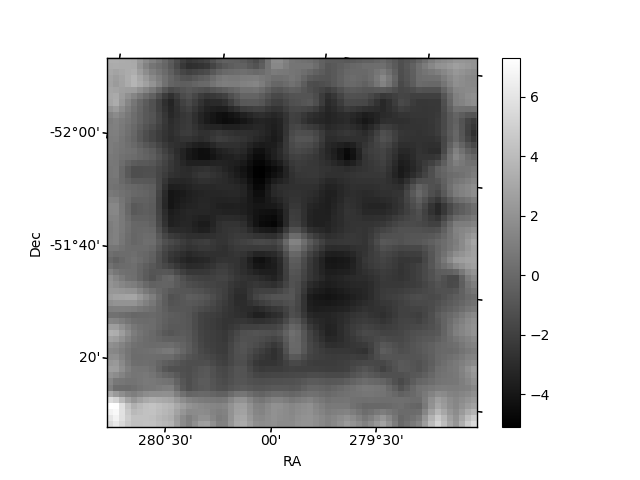
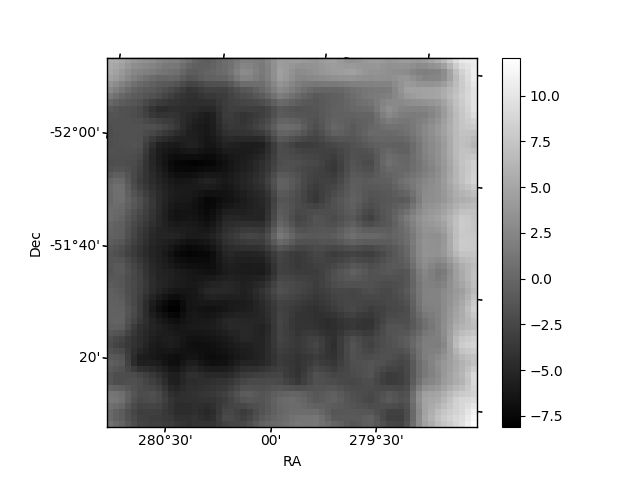
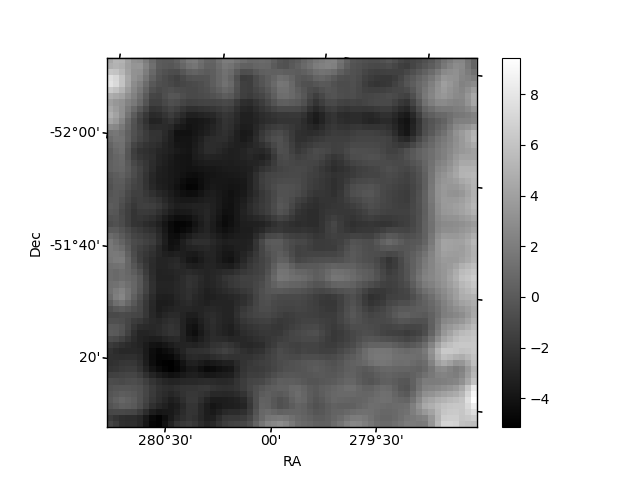
Histogram calculated using DETX and DETY for each event in the final _common_clean file
| Quadrant A | 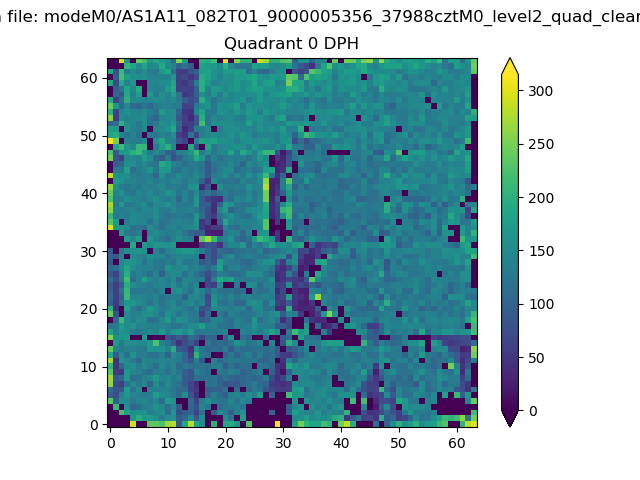 |
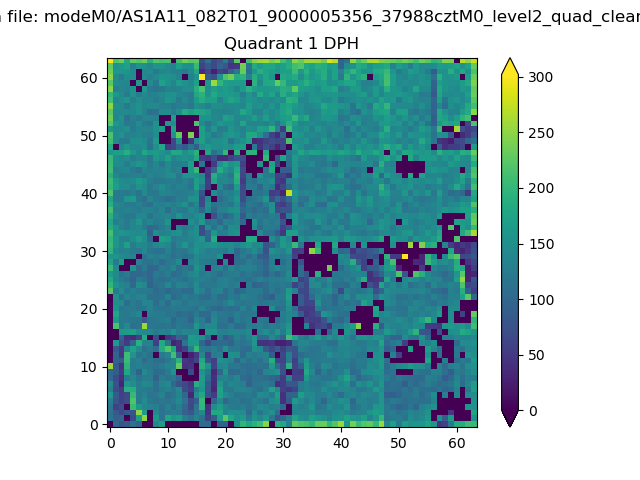 |
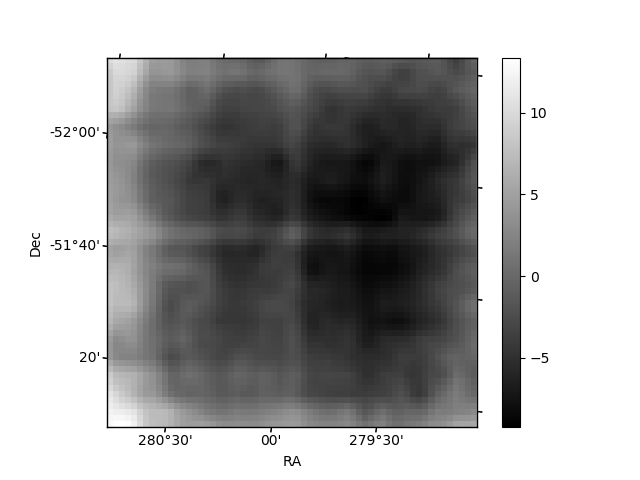
Quadrant B |
|---|---|---|---|
| Quadrant D | 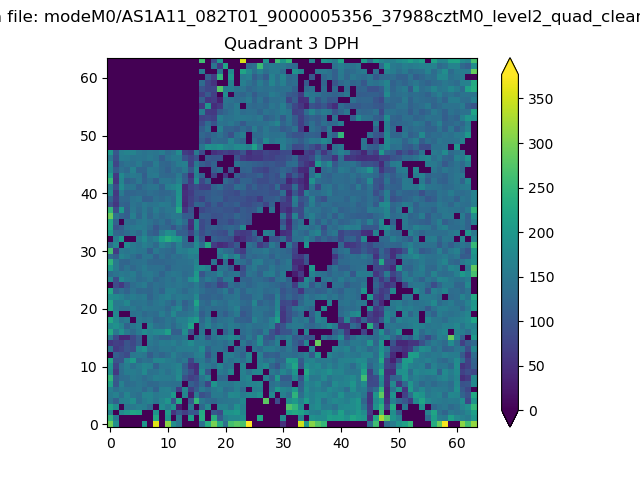 |
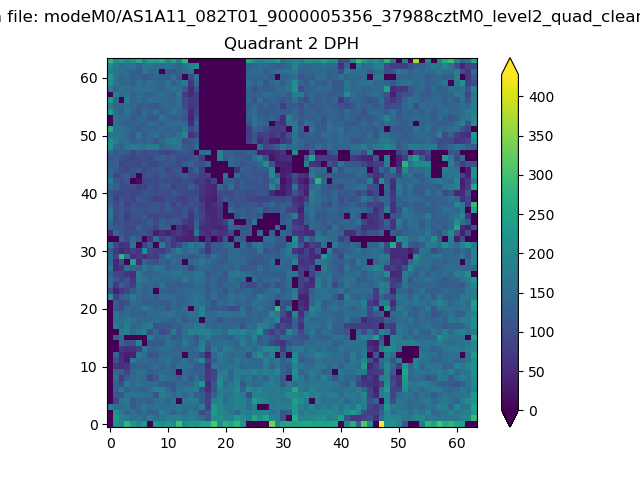 |
Quadrant C |
| Plot type | Count rate plots | Images |
|---|---|---|
| Comparison with Poisson distribution Blue bars denote a histogram of data divided into 1 sec bins. Red curve is a Poisson curve with rate = median count rate of data. |
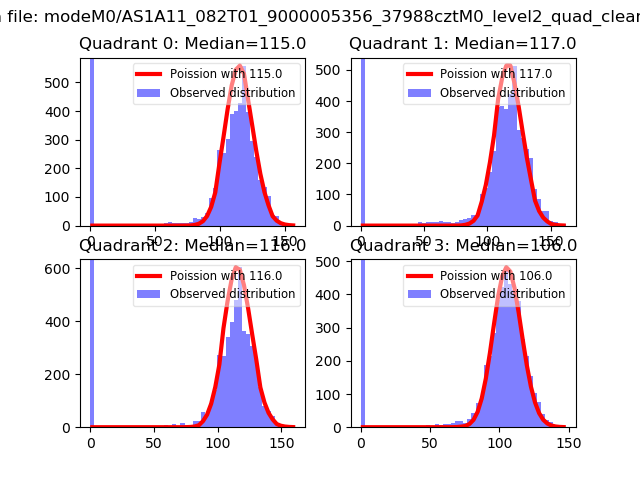 |
 |
| Quadrant-wise count rates Data is divided into 100 sec bins |
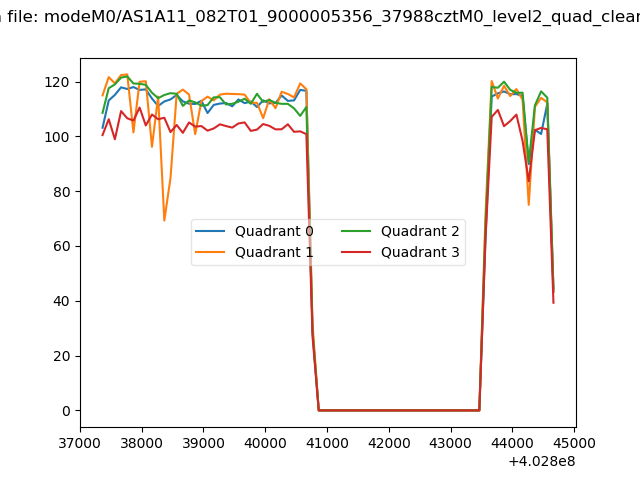 |
|
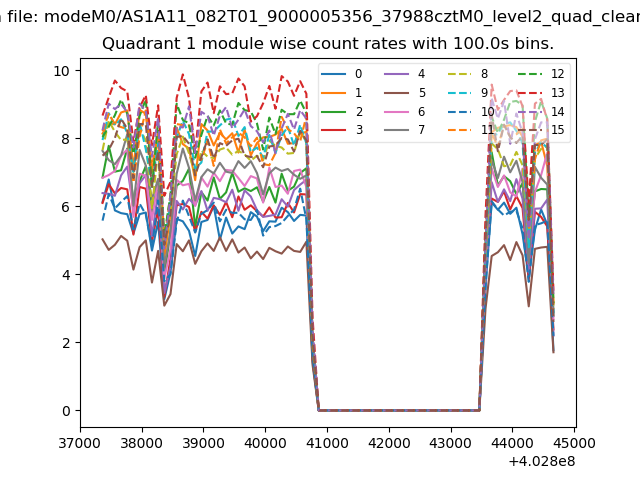
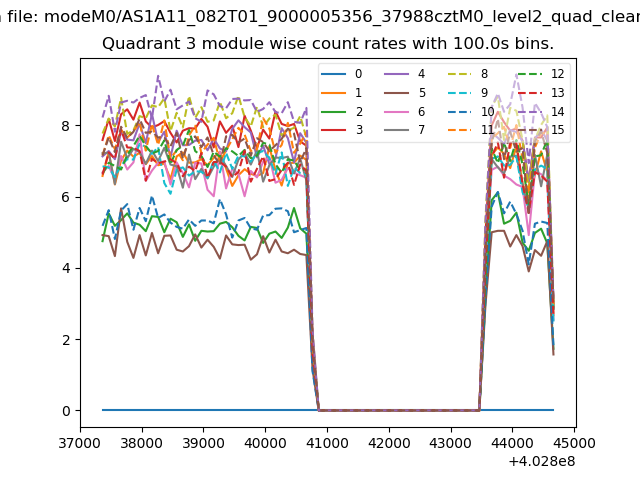
| Module-wise count rates for Quadrant A Data is divided into 100 sec bins |
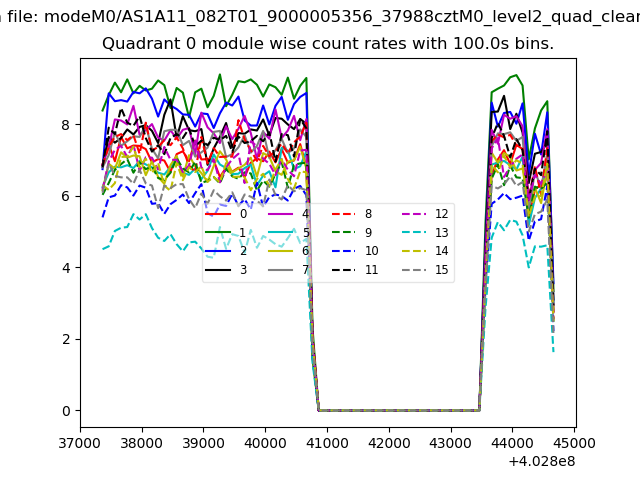 |
 |
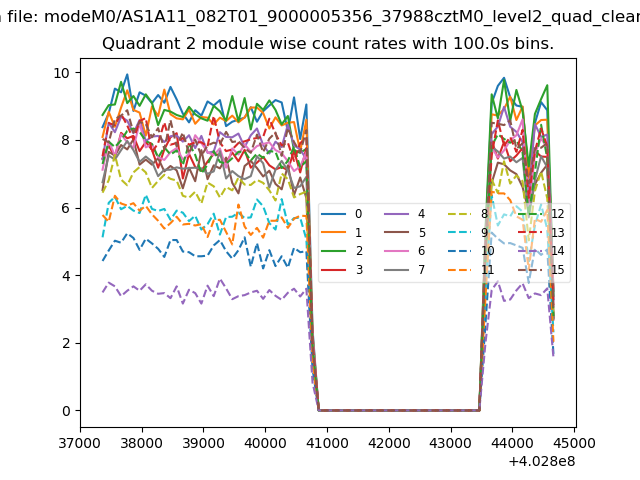
| Module-wise count rates for Quadrant B Data is divided into 100 sec bins |
 |
 |
| Module-wise count rates for Quadrant C Data is divided into 100 sec bins |
 |
 |
| Module-wise count rates for Quadrant D Data is divided into 100 sec bins |
 |
 |
| Parameter | Plot |
|---|---|
| CZT HV Monitor | 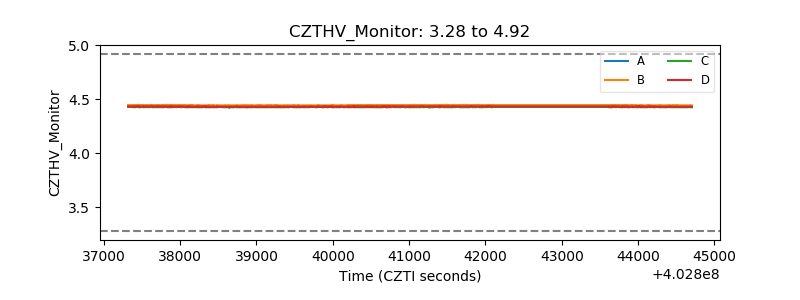 |
| D_VDD | 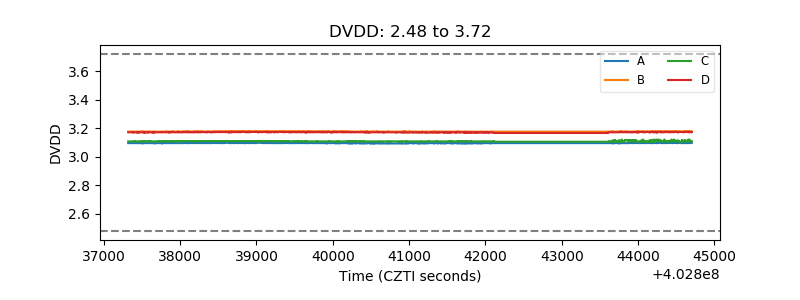 |
| Temperature 1 | 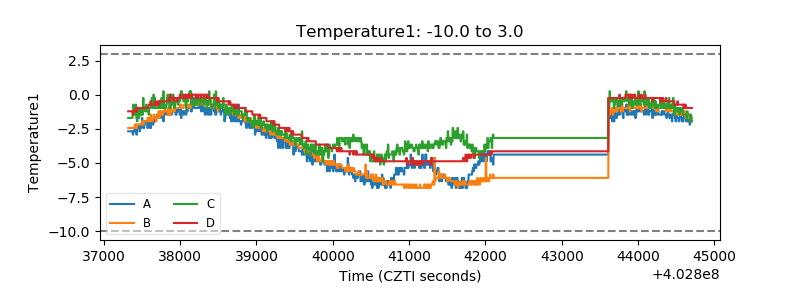 |
| Veto HV Monitor | 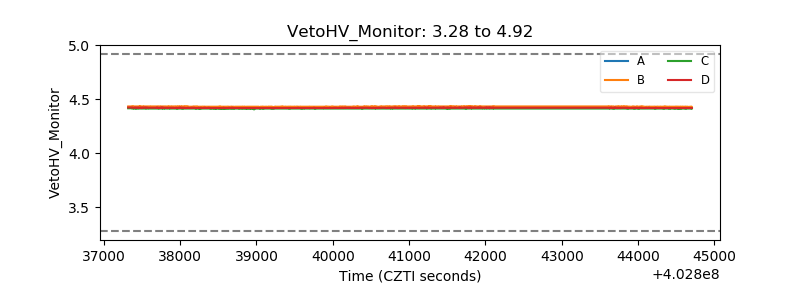 |
| Veto LLD | 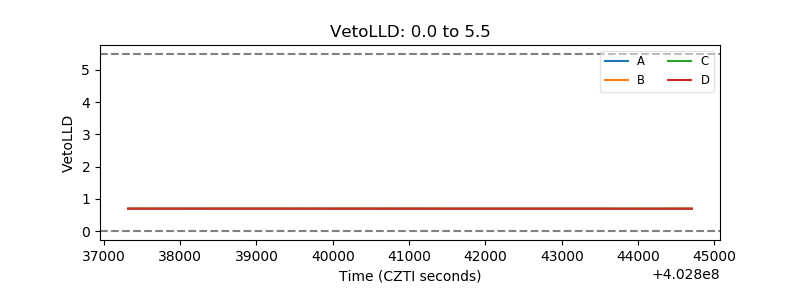 |
| Alpha Counter | 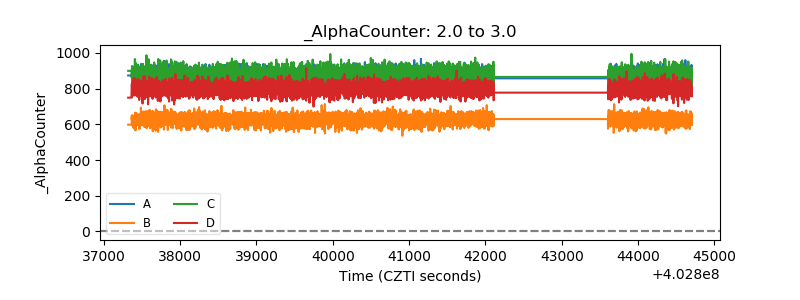 |
| _CPM_Rate | 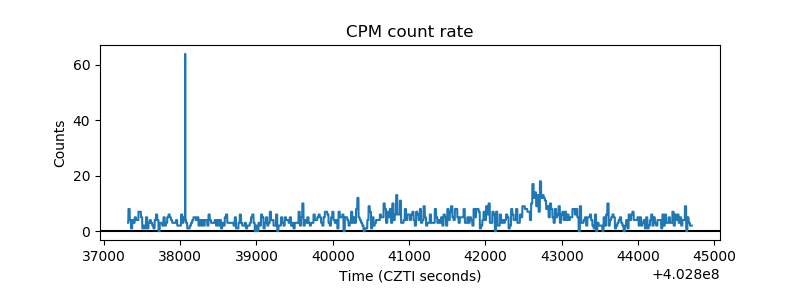 |
| CZT Counter | 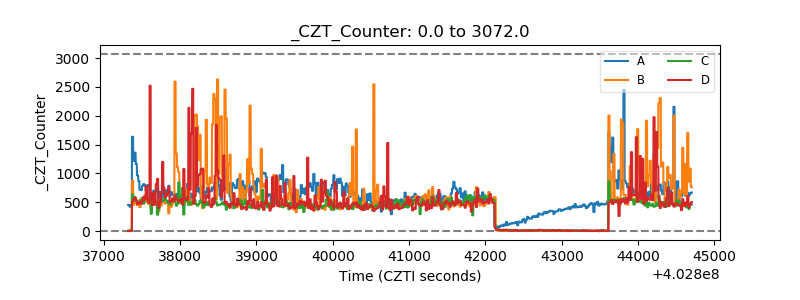 |
| +2.5 Volts monitor |  |
| +5 Volts monitor | 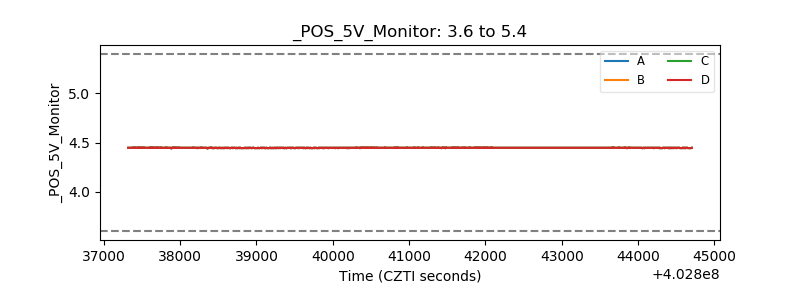 |
| _ROLL_ROT | 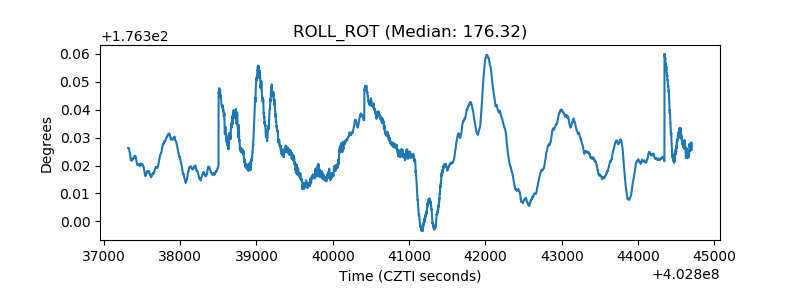 |
| _Roll_DEC | 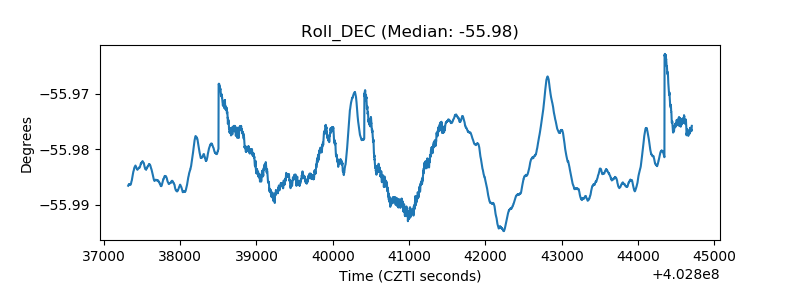 |
| _Roll_RA | 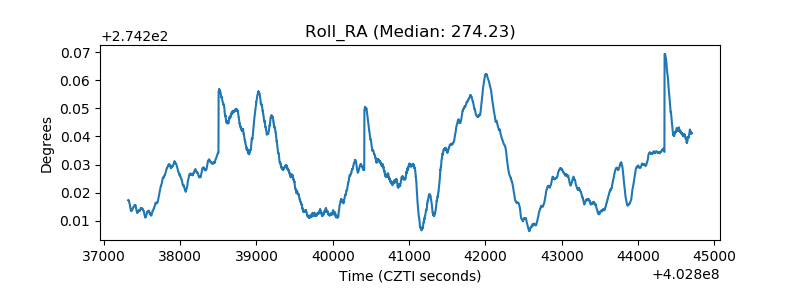 |
| Veto Counter | 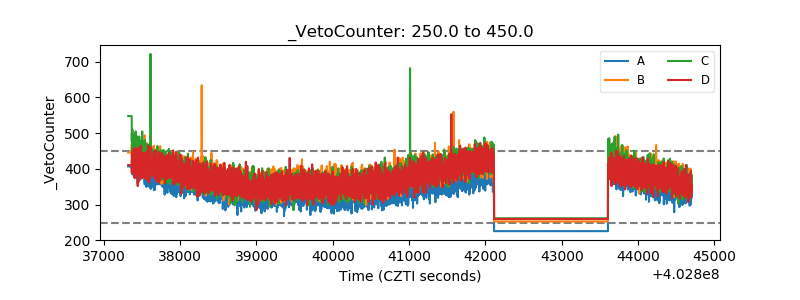 |