| Param | Original file | Final file |
|---|---|---|
| Filename | modeM0/AS1A11_082T01_9000005356_37989cztM0_level2.evt | modeM0/AS1A11_082T01_9000005356_37989cztM0_level2_quad_clean.evt |
| Size (bytes) | 489,306,240 | 71,640,000 |
| Size | 466.6 MB | 68.3 MB |
| Events in quadrant A | 4,601,282 | 443,924 |
| Events in quadrant B | 3,665,914 | 451,466 |
| Events in quadrant C | 2,798,855 | 453,347 |
| Events in quadrant D | 3,357,211 | 412,771 |
| Mode M0 | |||
|---|---|---|---|
| Quadrant | BADHDUFLAG | Total packets | Discarded packets |
| A | 0 | 17817 | 2 |
| B | 0 | 14719 | 1 |
| C | 0 | 11928 | 1 |
| D | 0 | 13864 | 1 |
| Mode SS | |||
|---|---|---|---|
| Quadrant | BADHDUFLAG | Total packets | Discarded packets |
| A | 0 | 120 | 0 |
| B | 0 | 120 | 0 |
| C | 0 | 120 | 0 |
| D | 0 | 120 | 0 |
| Mode M9 | |||
|---|---|---|---|
| Quadrant | BADHDUFLAG | Total packets | Discarded packets |
| A | 0 | 13 | 0 |
| B | 0 | 13 | 0 |
| C | 0 | 13 | 0 |
| D | 0 | 13 | 0 |
| Quadrant | Total seconds | Saturated seconds | Saturation percentage |
|---|---|---|---|
| A | 5825 | 122 | 2.094421% |
| B | 5825 | 187 | 3.210300% |
| C | 5825 | 8 | 0.137339% |
| D | 5825 | 74 | 1.270386% |
Noise dominated data is calculated using 1-second bins in cleaned event files. If a bin has >2000 counts, and if more than 50% of those come from <1% of pixels, then it is considered to be noise-dominated and hence unusable.
| Quadrant | # 1 sec bins | Bins with >0 counts | Bins with >2000 counts | High rate bins dominated by noise | Noise dominated (total time) | Noise dominated (detector-on time) | Marked lightcurve |
|---|---|---|---|---|---|---|---|
| A | 7138 | 5826 | 90 | 90 | 1.26% | 1.54% | 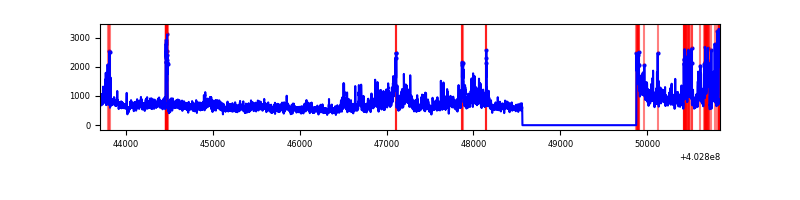 |
| B | 7138 | 5826 | 107 | 107 | 1.50% | 1.84% | 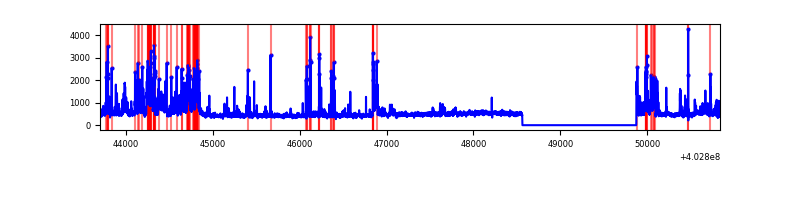 |
| C | 7138 | 5826 | 3 | 3 | 0.04% | 0.05% | 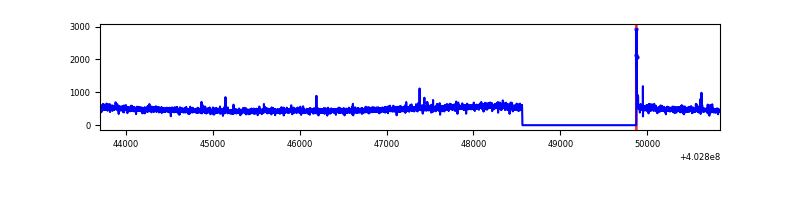 |
| D | 7138 | 5826 | 76 | 76 | 1.06% | 1.30% | 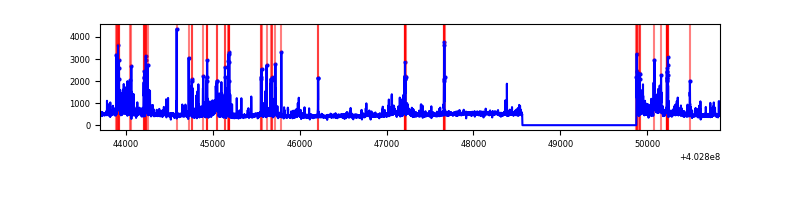 |
Top three noisy pixels from each quadrant. If the there are fewer than three noisy pixels in the level2.evt file, extra rows are filled as -1
| Pixel properties | Quadrant properties | ||||||
|---|---|---|---|---|---|---|---|
| Quadrant | DetID | PixID | Counts | Sigma | Mean | Median | Sigma |
| A | 12 | 16 | 762187 | 5698.86 | 654 | 641 | 133.6 |
| A | 15 | 222 | 754962 | 5644.79 | 654 | 641 | 133.6 |
| A | 10 | 83 | 379679 | 2836.44 | 654 | 641 | 133.6 |
| B | 5 | 172 | 267810 | 2126.74 | 654 | 638 | 125.6 |
| B | 0 | 186 | 247531 | 1965.32 | 654 | 638 | 125.6 |
| B | 5 | 184 | 198200 | 1572.63 | 654 | 638 | 125.6 |
| C | 15 | 214 | 249002 | 1637.55 | 643 | 646 | 151.7 |
| C | 0 | 10 | 15040 | 94.91 | 643 | 646 | 151.7 |
| C | 14 | 254 | 14137 | 88.95 | 643 | 646 | 151.7 |
| D | 12 | 233 | 344111 | 2200.51 | 639 | 622 | 156.1 |
| D | 7 | 223 | 111392 | 709.63 | 639 | 622 | 156.1 |
| D | 2 | 250 | 110211 | 702.07 | 639 | 622 | 156.1 |
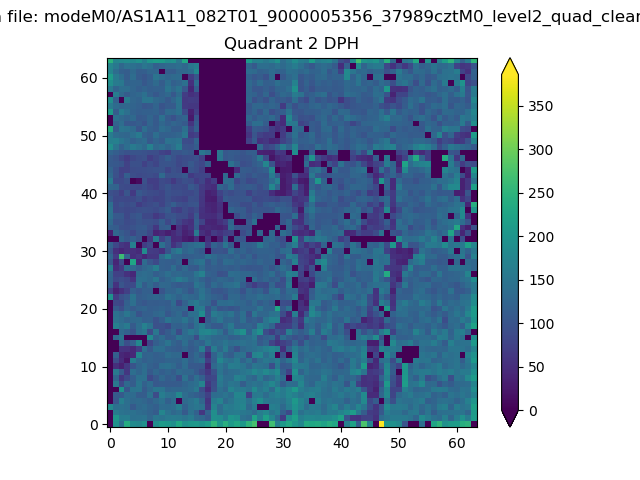
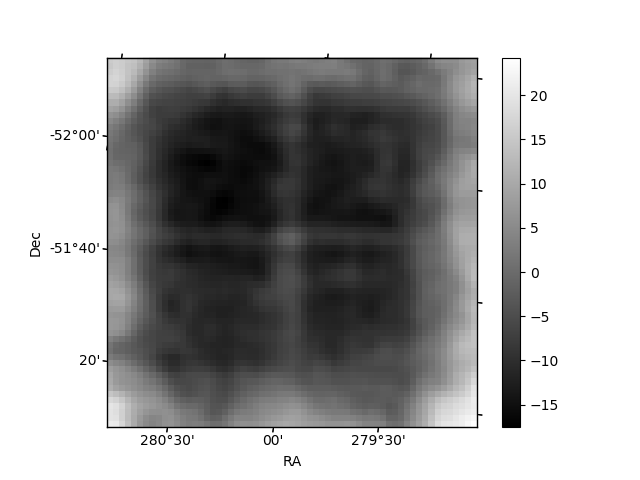
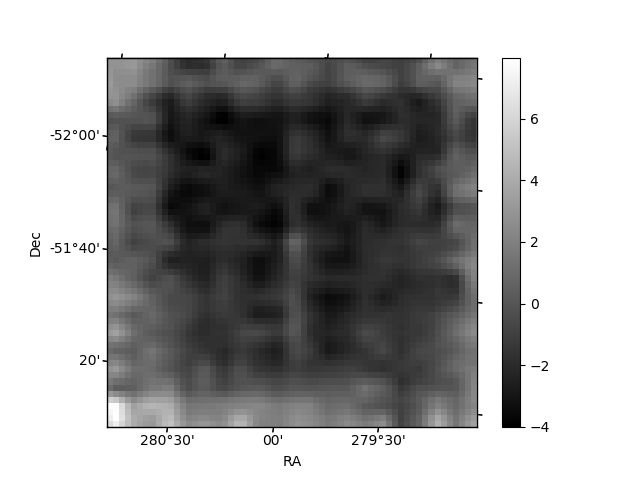
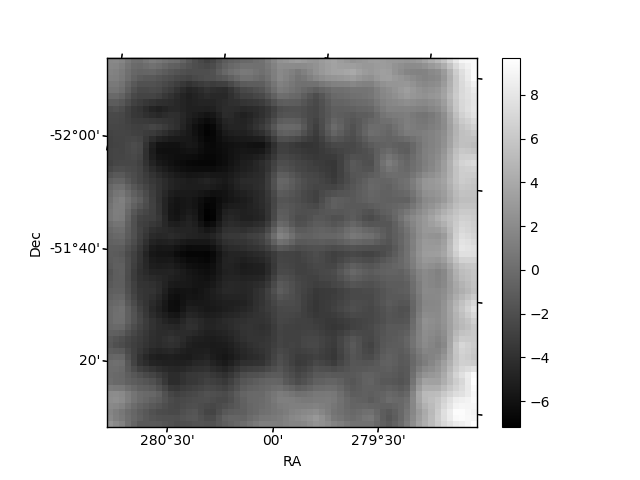
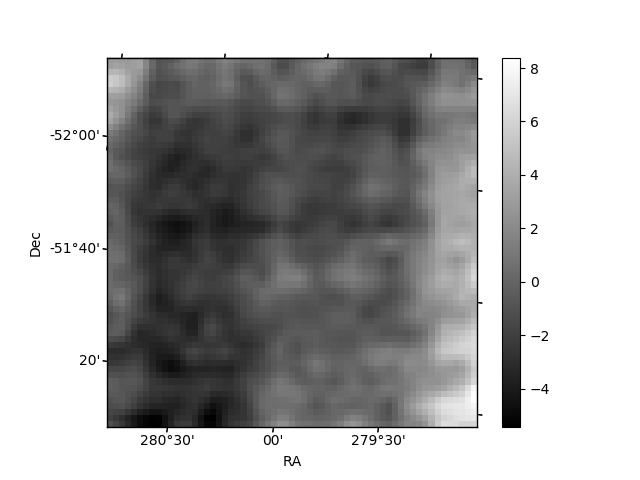
Histogram calculated using DETX and DETY for each event in the final _common_clean file
| Quadrant A | 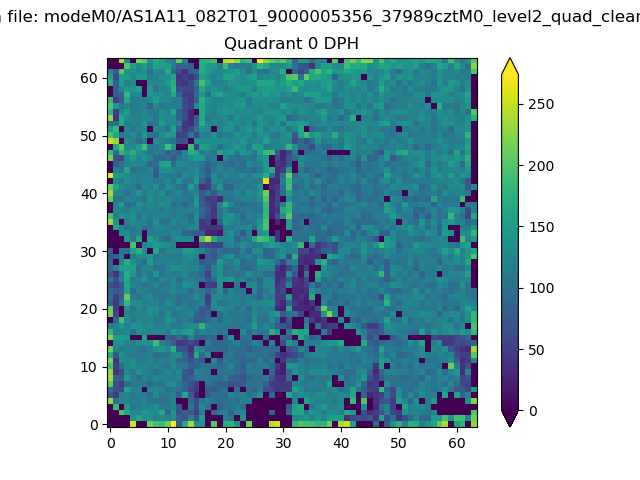 |
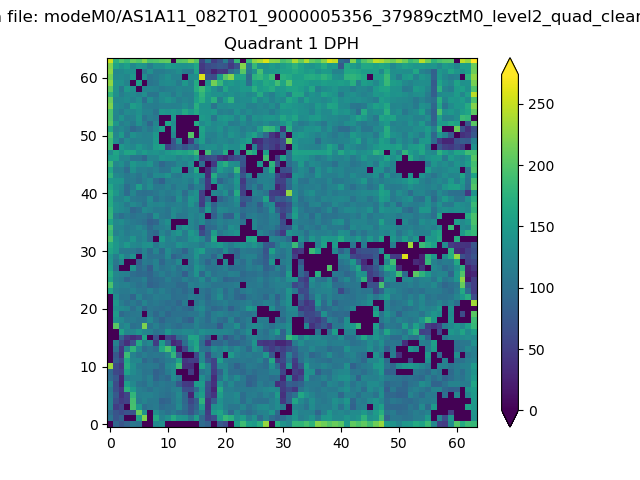 |
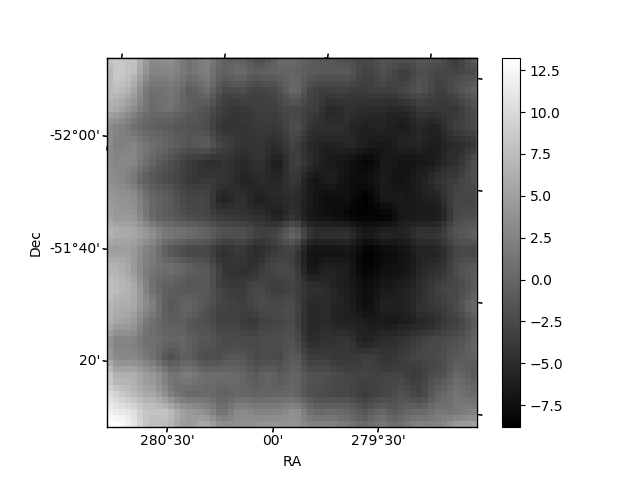
Quadrant B |
|---|---|---|---|
| Quadrant D | 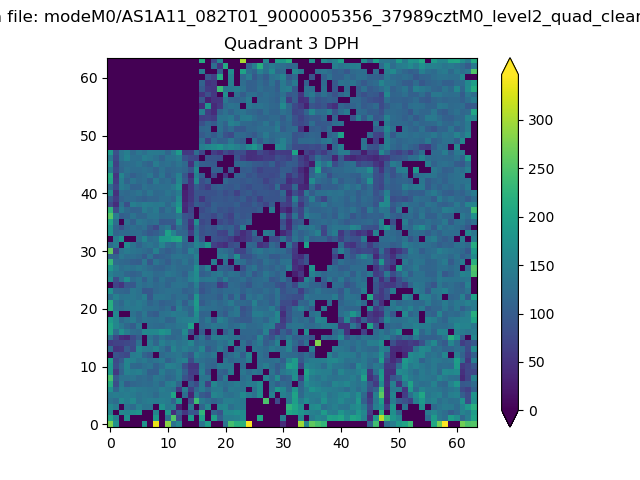 |
 |
Quadrant C |
| Plot type | Count rate plots | Images |
|---|---|---|
| Comparison with Poisson distribution Blue bars denote a histogram of data divided into 1 sec bins. Red curve is a Poisson curve with rate = median count rate of data. |
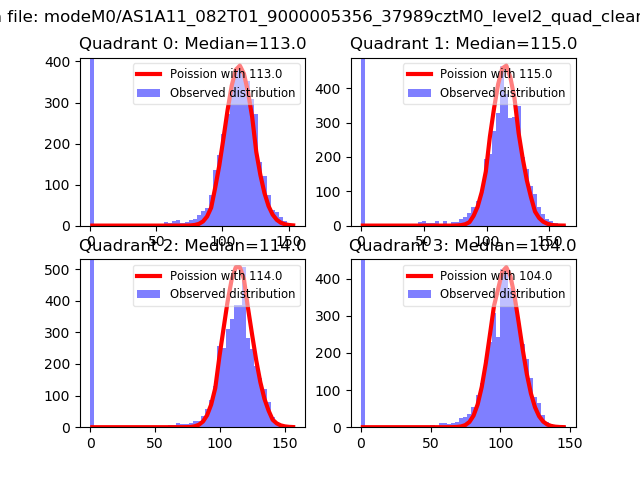 |
 |
| Quadrant-wise count rates Data is divided into 100 sec bins |
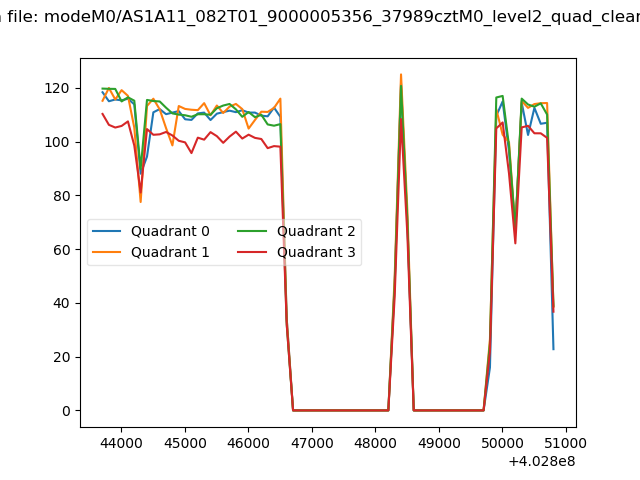 |
|
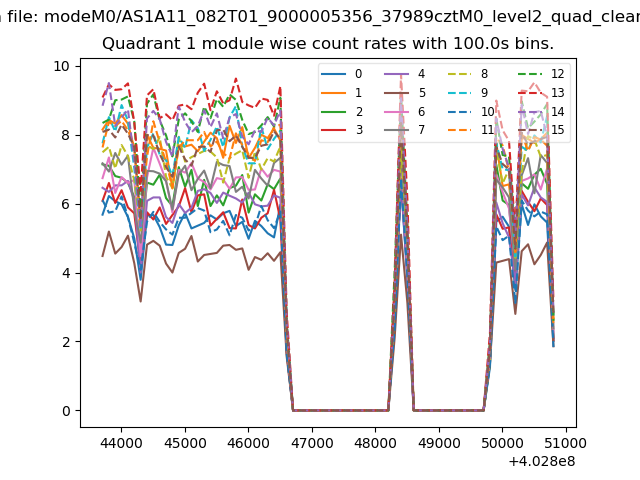
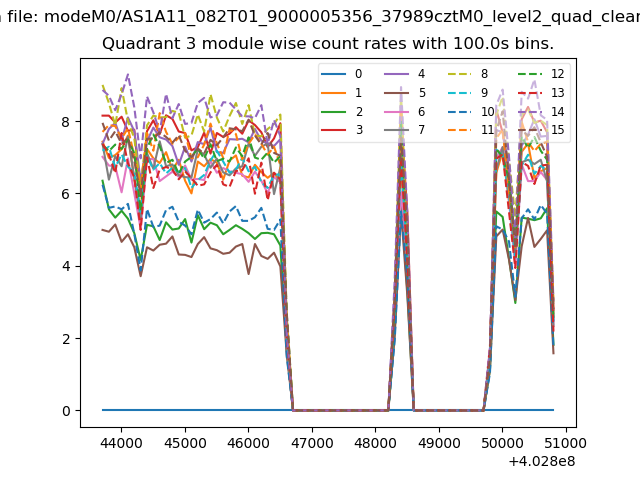
| Module-wise count rates for Quadrant A Data is divided into 100 sec bins |
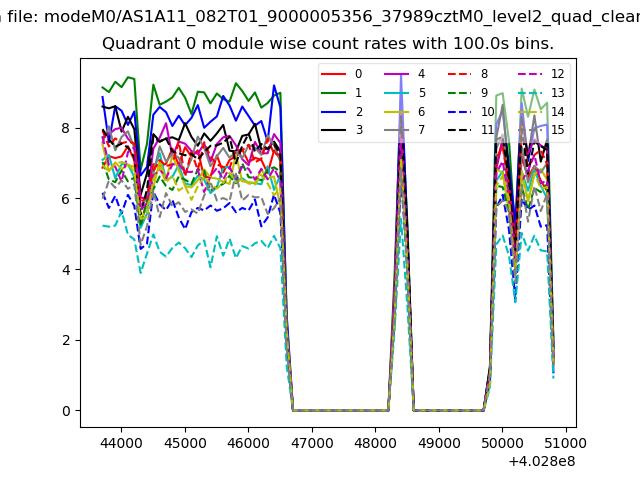 |
 |
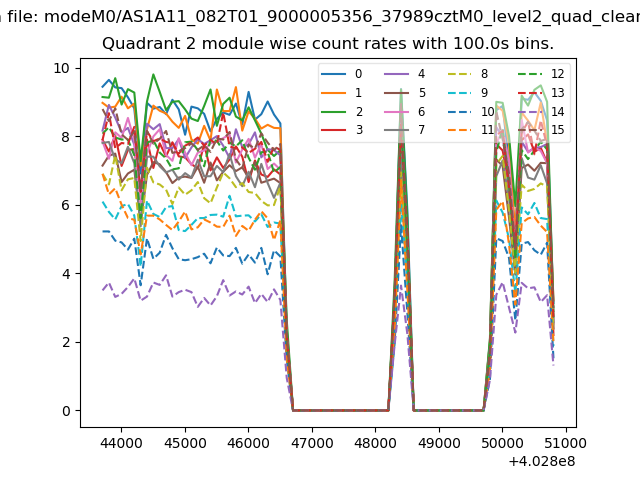
| Module-wise count rates for Quadrant B Data is divided into 100 sec bins |
 |
 |
| Module-wise count rates for Quadrant C Data is divided into 100 sec bins |
 |
 |
| Module-wise count rates for Quadrant D Data is divided into 100 sec bins |
 |
 |
| Parameter | Plot |
|---|---|
| CZT HV Monitor | 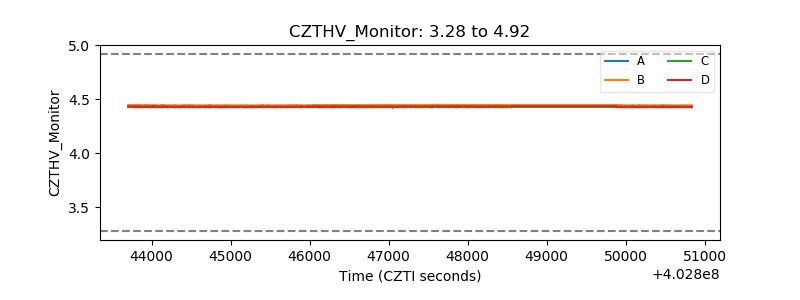 |
| D_VDD | 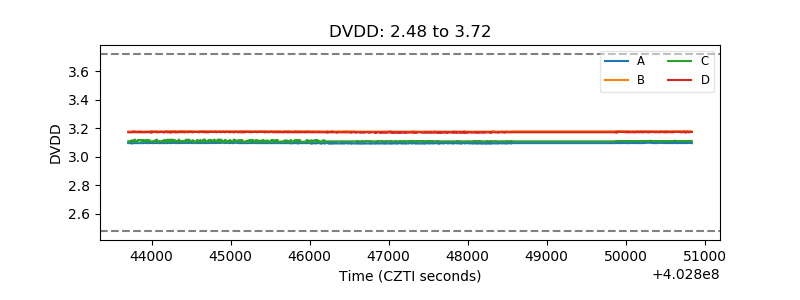 |
| Temperature 1 | 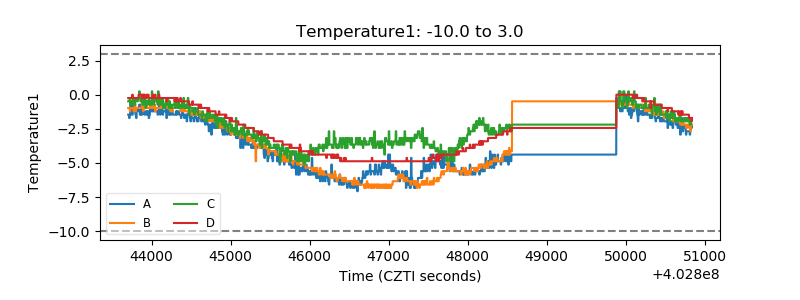 |
| Veto HV Monitor | 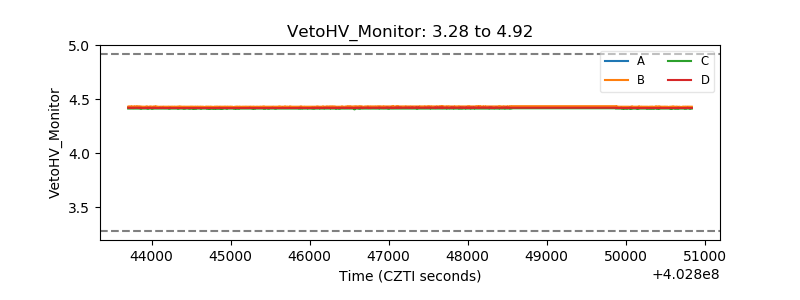 |
| Veto LLD | 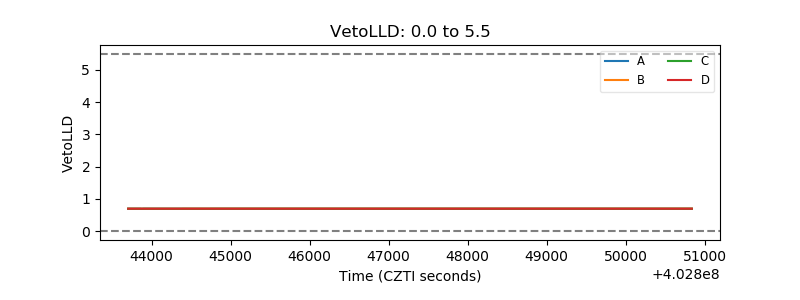 |
| Alpha Counter | 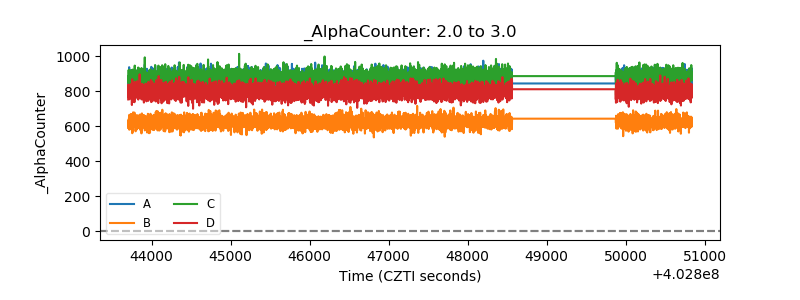 |
| _CPM_Rate | 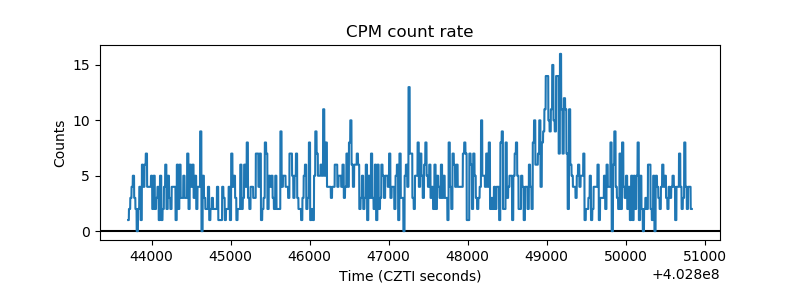 |
| CZT Counter | 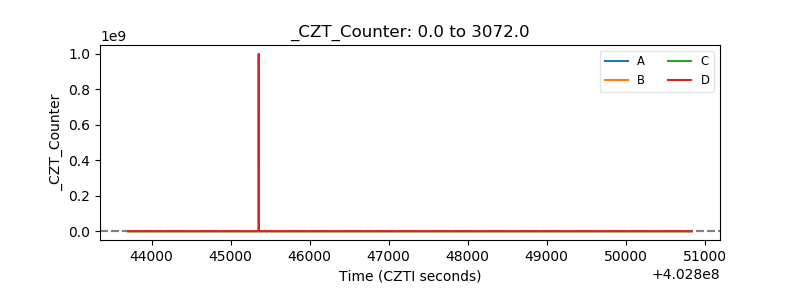 |
| +2.5 Volts monitor | 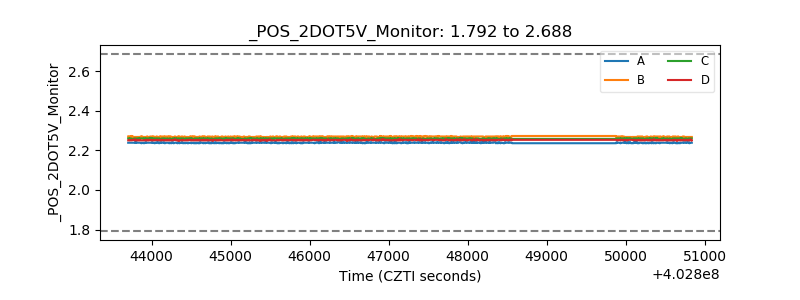 |
| +5 Volts monitor | 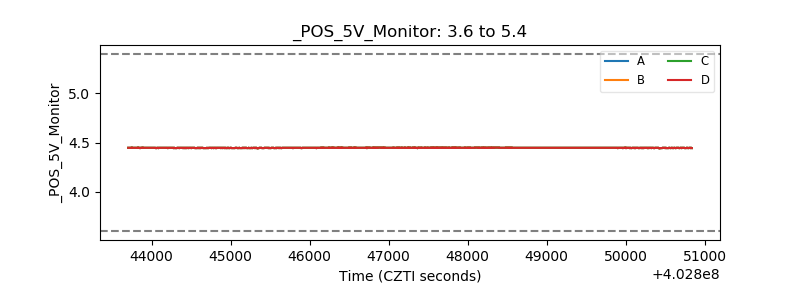 |
| _ROLL_ROT | 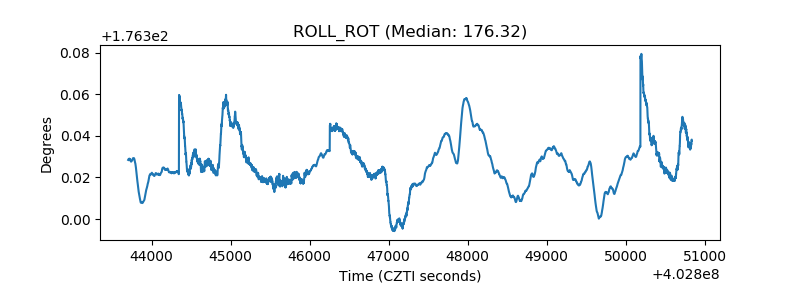 |
| _Roll_DEC | 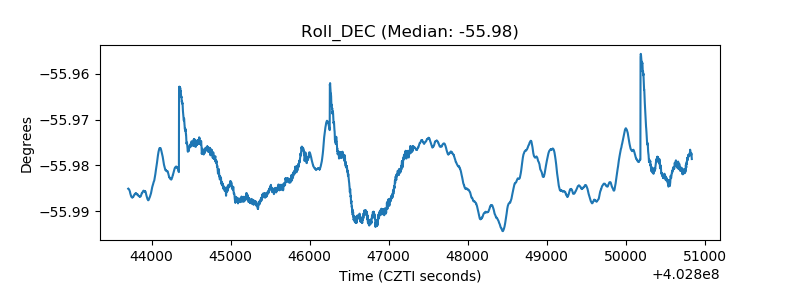 |
| _Roll_RA | 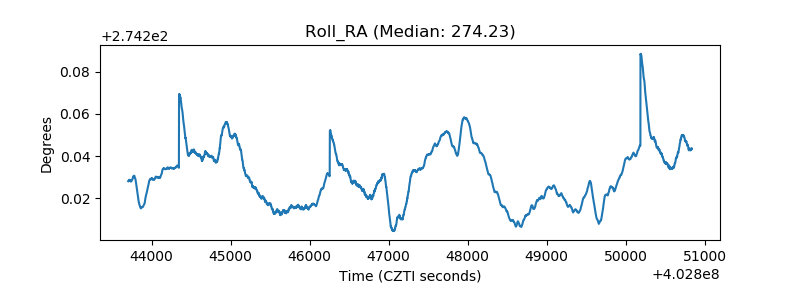 |
| Veto Counter | 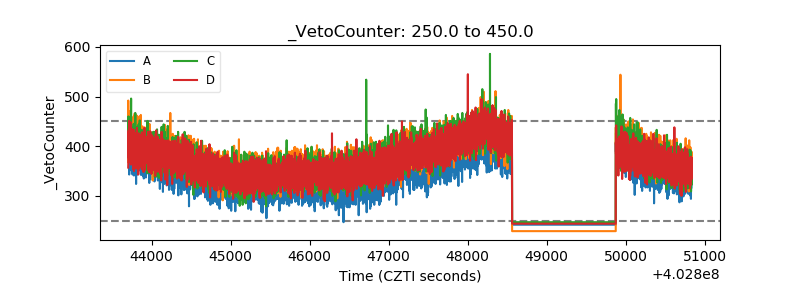 |