| Param | Original file | Final file |
|---|---|---|
| Filename | modeM0/AS1A11_082T01_9000005356_37992cztM0_level2.fits | modeM0/AS1A11_082T01_9000005356_37992cztM0_level2_quad_clean.evt |
| Size (bytes) | 993,314,880 | 187,234,560 |
| Size | 947.3 MB | 178.6 MB |
| Events in quadrant A | 9,928,784 | 1,160,810 |
| Events in quadrant B | 9,510,666 | 1,166,730 |
| Events in quadrant C | 7,776,810 | 1,181,384 |
| Events in quadrant D | 8,336,521 | 1,075,406 |
| Mode M0 | |||
|---|---|---|---|
| Quadrant | BADHDUFLAG | Total packets | Discarded packets |
| A | 0 | 39646 | 4 |
| B | 0 | 38566 | 3 |
| C | 0 | 32953 | 3 |
| D | 0 | 35392 | 3 |
| Mode SS | |||
|---|---|---|---|
| Quadrant | BADHDUFLAG | Total packets | Discarded packets |
| A | 0 | 322 | 0 |
| B | 0 | 322 | 0 |
| C | 0 | 322 | 0 |
| D | 0 | 322 | 0 |
| Mode M9 | |||
|---|---|---|---|
| Quadrant | BADHDUFLAG | Total packets | Discarded packets |
| A | 0 | 40 | 0 |
| B | 0 | 40 | 0 |
| C | 0 | 40 | 0 |
| D | 0 | 40 | 0 |
| Quadrant | Total seconds | Saturated seconds | Saturation percentage |
|---|---|---|---|
| A | 15710 | 201 | 1.279440% |
| B | 15710 | 619 | 3.940165% |
| C | 15710 | 35 | 0.222788% |
| D | 15710 | 108 | 0.687460% |
Noise dominated data is calculated using 1-second bins in cleaned event files. If a bin has >2000 counts, and if more than 50% of those come from <1% of pixels, then it is considered to be noise-dominated and hence unusable.
| Quadrant | # 1 sec bins | Bins with >0 counts | Bins with >2000 counts | High rate bins dominated by noise | Noise dominated (total time) | Noise dominated (detector-on time) | Marked lightcurve |
|---|---|---|---|---|---|---|---|
| A | 19769 | 15713 | 153 | 153 | 0.77% | 0.97% | 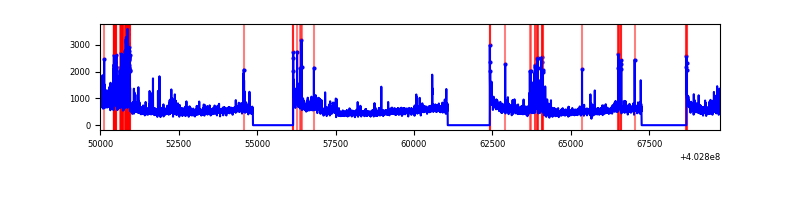 |
| B | 19769 | 15713 | 452 | 452 | 2.29% | 2.88% | 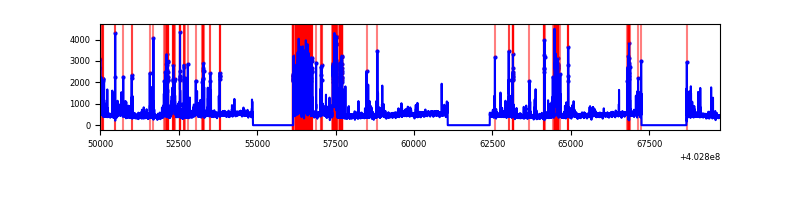 |
| C | 19769 | 15713 | 26 | 26 | 0.13% | 0.17% | 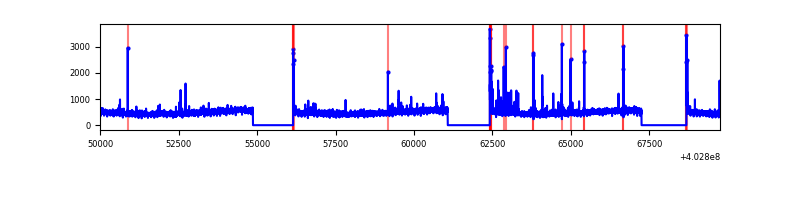 |
| D | 19769 | 15713 | 78 | 78 | 0.39% | 0.50% | 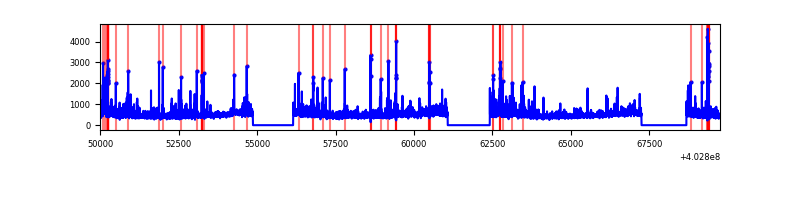 |
Top three noisy pixels from each quadrant. If the there are fewer than three noisy pixels in the level2.evt file, extra rows are filled as -1
| Pixel properties | Quadrant properties | ||||||
|---|---|---|---|---|---|---|---|
| Quadrant | DetID | PixID | Counts | Sigma | Mean | Median | Sigma |
| A | 12 | 16 | 1051459 | 2943.14 | 1773 | 1736 | 356.7 |
| A | 10 | 83 | 952059 | 2664.45 | 1773 | 1736 | 356.7 |
| A | 15 | 222 | 740858 | 2072.3 | 1773 | 1736 | 356.7 |
| B | 5 | 172 | 1236127 | 3694.63 | 1755 | 1706 | 334.1 |
| B | 5 | 184 | 775578 | 2316.2 | 1755 | 1706 | 334.1 |
| B | 4 | 232 | 140580 | 415.65 | 1755 | 1706 | 334.1 |
| C | 15 | 214 | 654916 | 1608.98 | 1743 | 1756 | 405.9 |
| C | 1 | 23 | 164352 | 400.53 | 1743 | 1756 | 405.9 |
| C | 14 | 254 | 59646 | 142.6 | 1743 | 1756 | 405.9 |
| D | 7 | 223 | 418782 | 984.89 | 1733 | 1685 | 423.5 |
| D | 1 | 52 | 280927 | 659.38 | 1733 | 1685 | 423.5 |
| D | 2 | 250 | 157512 | 367.96 | 1733 | 1685 | 423.5 |
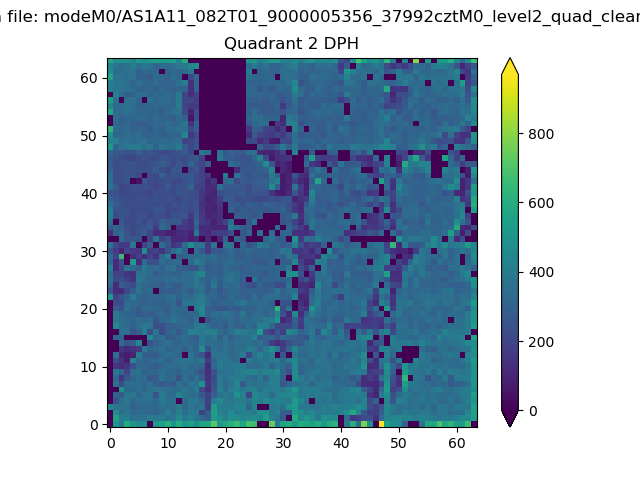
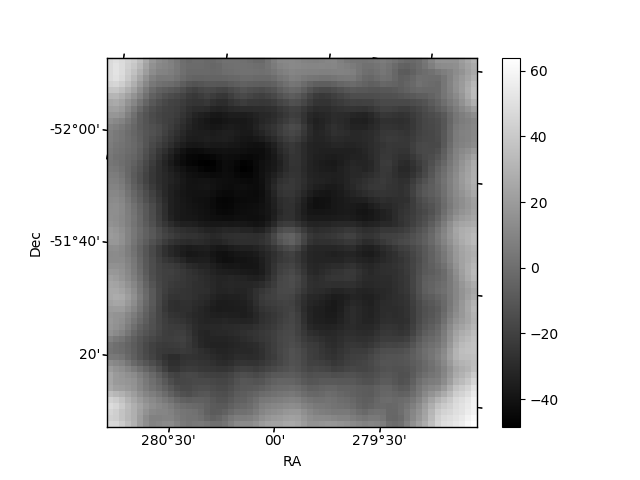
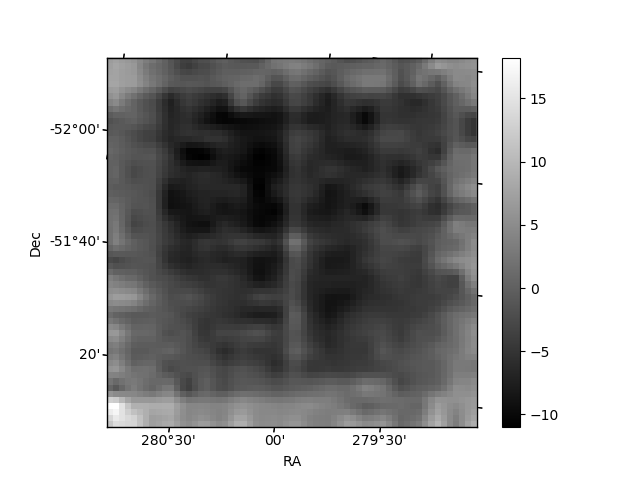
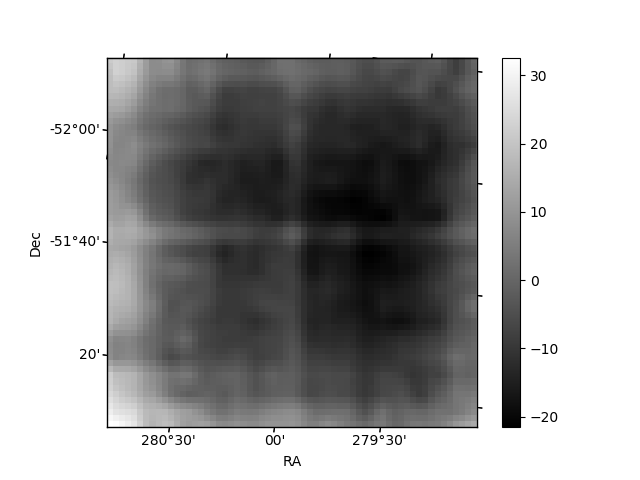
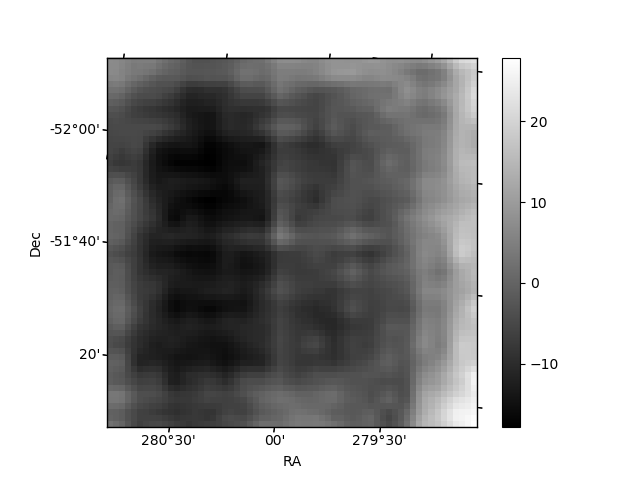
Histogram calculated using DETX and DETY for each event in the final _common_clean file
| Quadrant A | 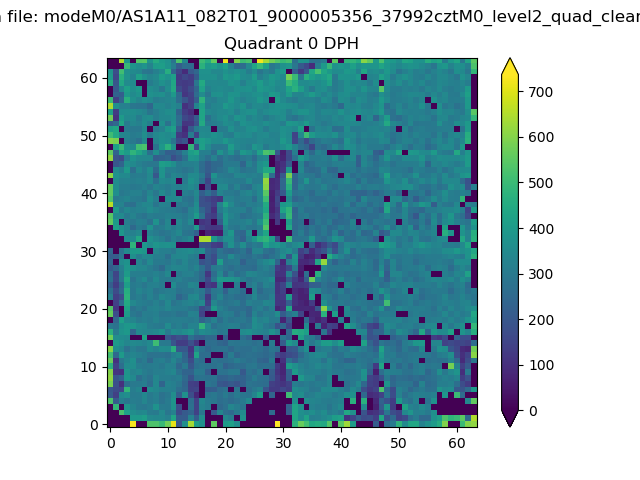 |
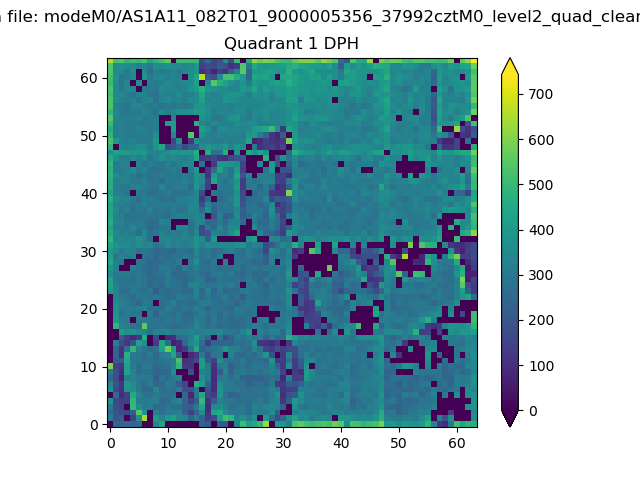 |
Quadrant B |
|---|---|---|---|
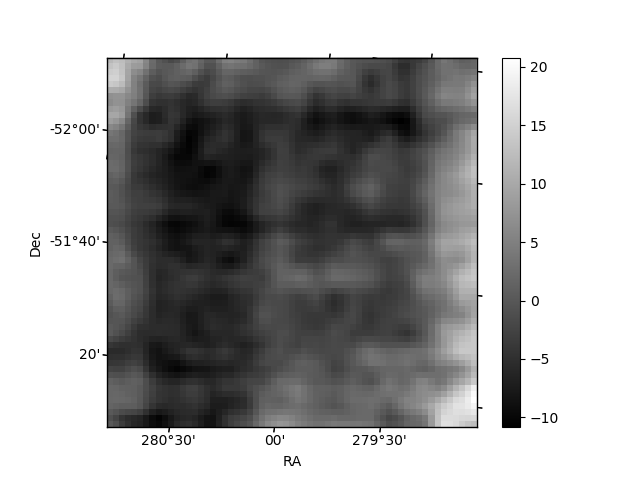
| Quadrant D | 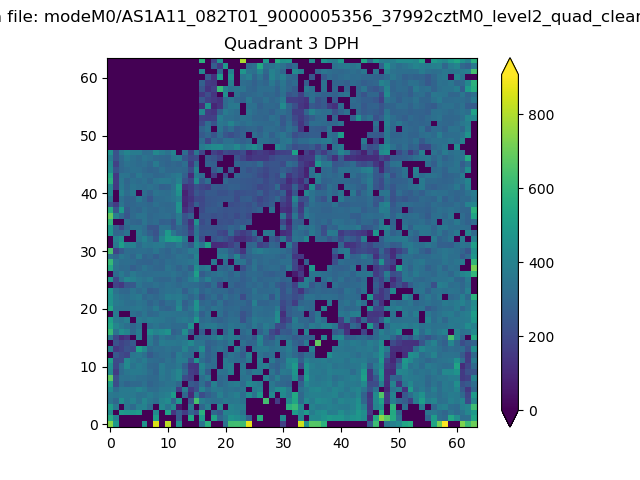 |
 |
Quadrant C |
| Plot type | Count rate plots | Images |
|---|---|---|
| Comparison with Poisson distribution Blue bars denote a histogram of data divided into 1 sec bins. Red curve is a Poisson curve with rate = median count rate of data. |
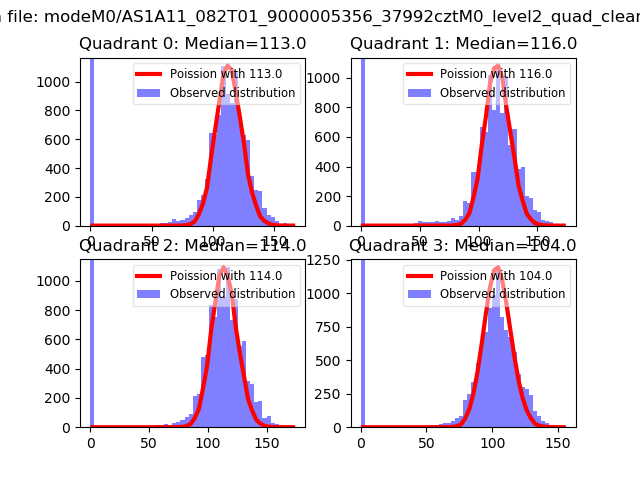 |
 |
| Quadrant-wise count rates Data is divided into 100 sec bins |
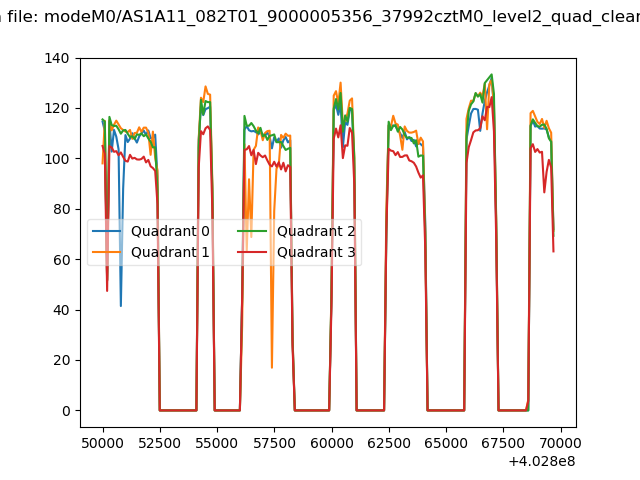 |
|
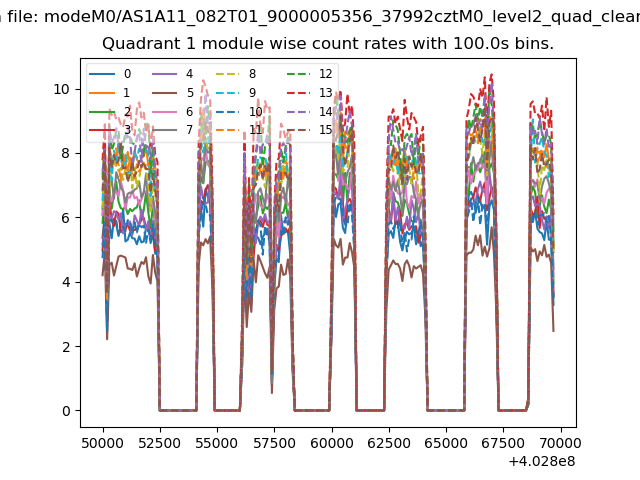
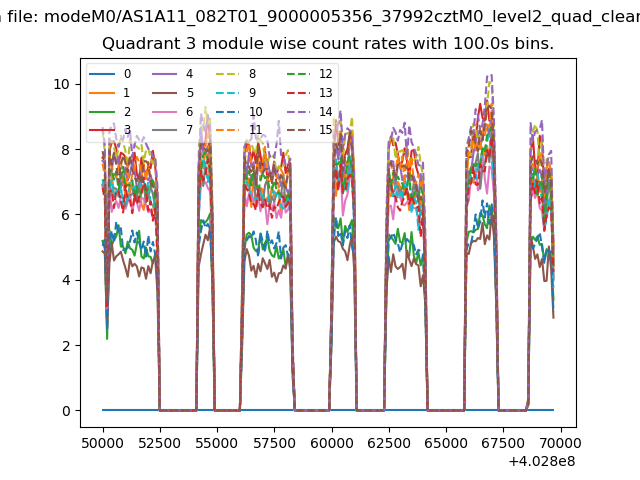
| Module-wise count rates for Quadrant A Data is divided into 100 sec bins |
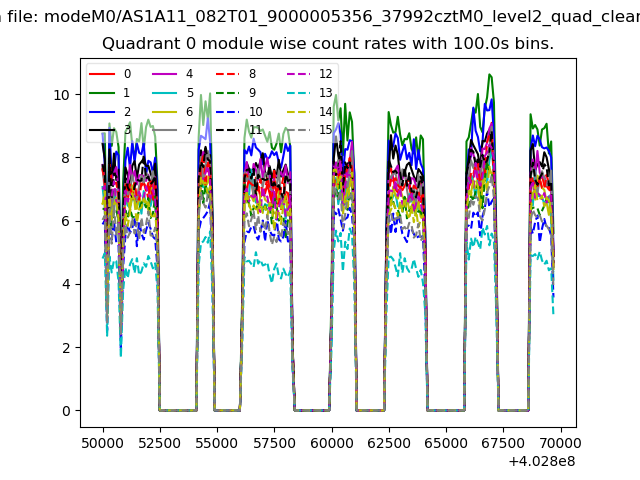 |
 |
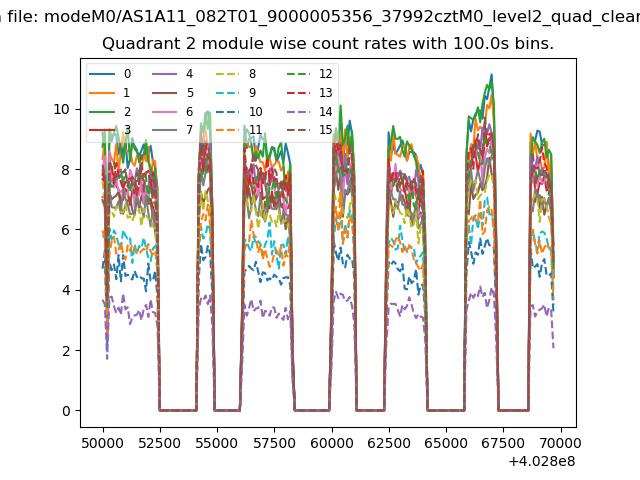
| Module-wise count rates for Quadrant B Data is divided into 100 sec bins |
 |
 |
| Module-wise count rates for Quadrant C Data is divided into 100 sec bins |
 |
 |
| Module-wise count rates for Quadrant D Data is divided into 100 sec bins |
 |
 |
| Parameter | Plot |
|---|---|
| CZT HV Monitor | 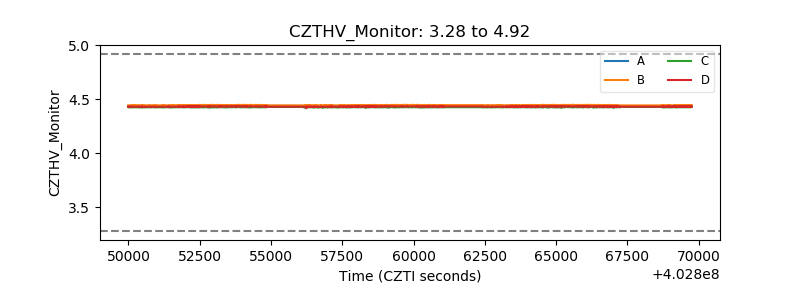 |
| D_VDD | 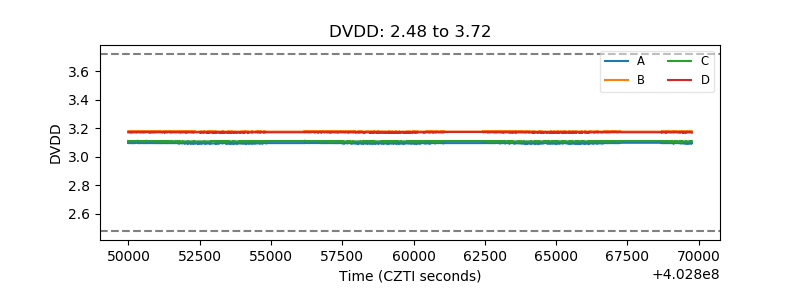 |
| Temperature 1 | 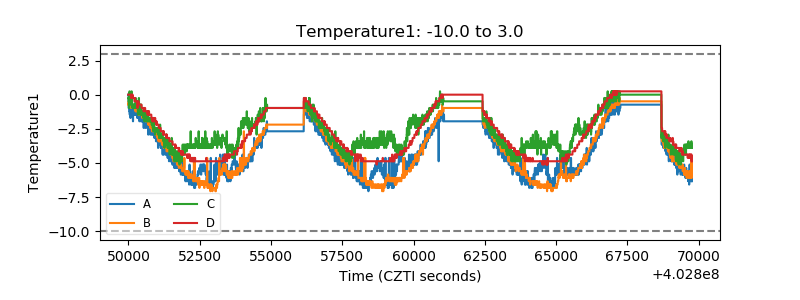 |
| Veto HV Monitor | 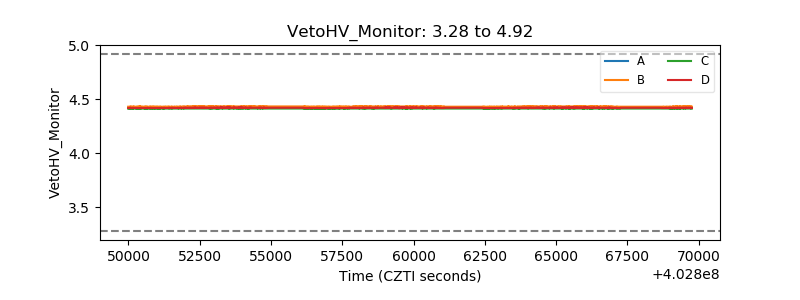 |
| Veto LLD | 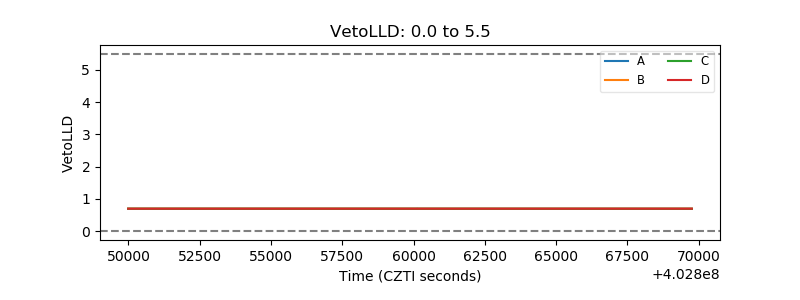 |
| Alpha Counter | 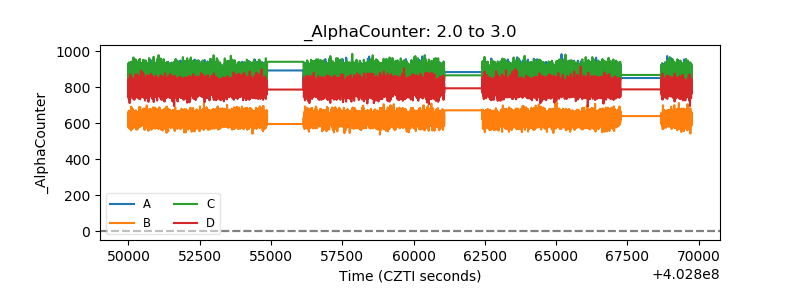 |
| _CPM_Rate | 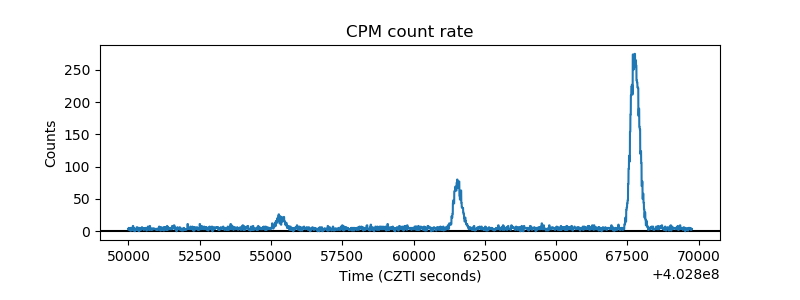 |
| CZT Counter | 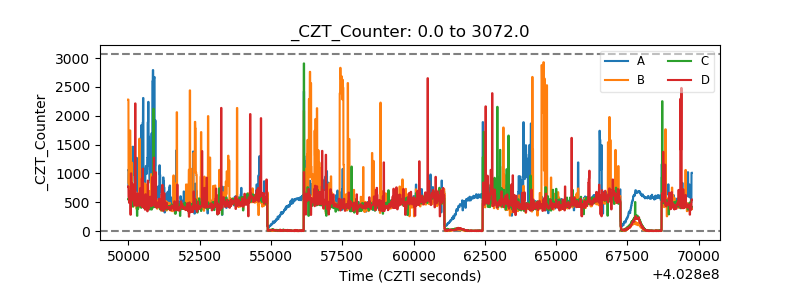 |
| +2.5 Volts monitor | 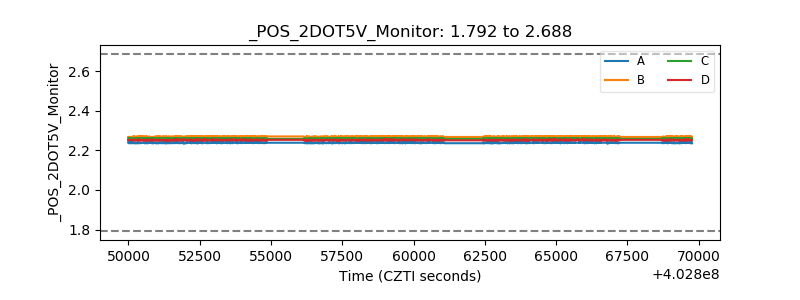 |
| +5 Volts monitor |  |
| _ROLL_ROT | 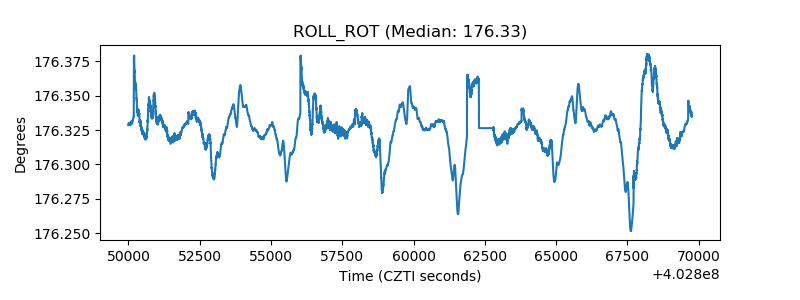 |
| _Roll_DEC | 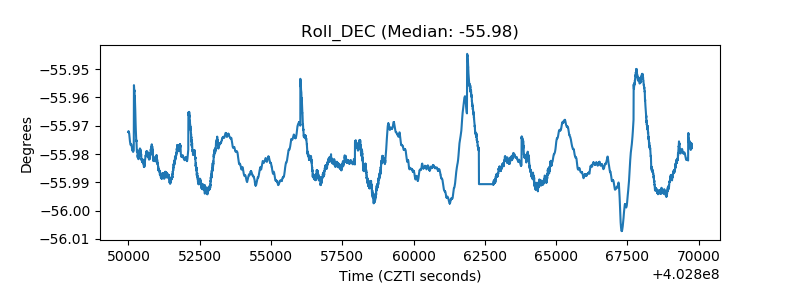 |
| _Roll_RA | 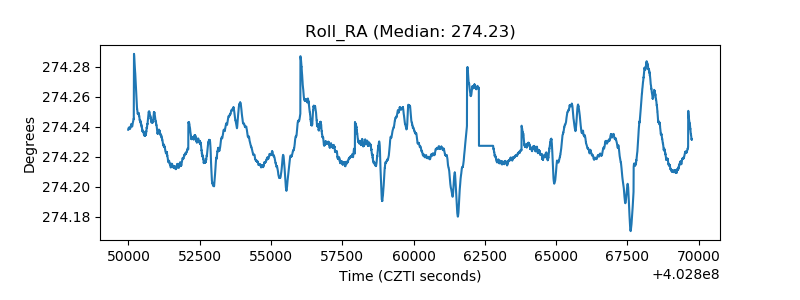 |
| Veto Counter | 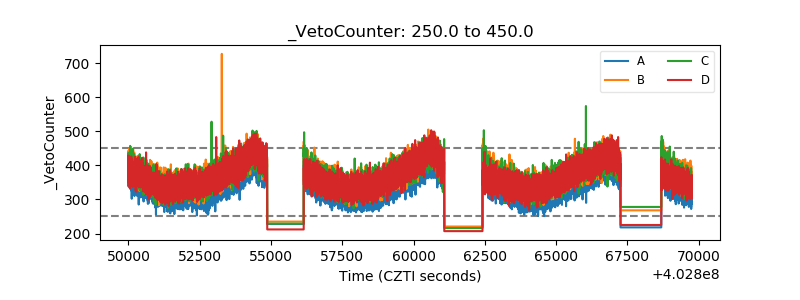 |