| Param | Original file | Final file |
|---|---|---|
| Filename | modeM0/AS1A11_082T01_9000005356_37993cztM0_level2.fits | modeM0/AS1A11_082T01_9000005356_37993cztM0_level2_quad_clean.evt |
| Size (bytes) | 352,183,680 | 70,361,280 |
| Size | 335.9 MB | 67.1 MB |
| Events in quadrant A | 3,497,365 | 444,235 |
| Events in quadrant B | 2,906,829 | 448,833 |
| Events in quadrant C | 2,813,378 | 445,643 |
| Events in quadrant D | 3,385,107 | 401,332 |
| Mode M0 | |||
|---|---|---|---|
| Quadrant | BADHDUFLAG | Total packets | Discarded packets |
| A | 0 | 13963 | 3 |
| B | 0 | 12348 | 2 |
| C | 0 | 11703 | 2 |
| D | 0 | 13832 | 2 |
| Mode SS | |||
|---|---|---|---|
| Quadrant | BADHDUFLAG | Total packets | Discarded packets |
| A | 0 | 114 | 0 |
| B | 0 | 114 | 0 |
| C | 0 | 114 | 0 |
| D | 0 | 114 | 0 |
| Mode M9 | |||
|---|---|---|---|
| Quadrant | BADHDUFLAG | Total packets | Discarded packets |
| A | 0 | 22 | 0 |
| B | 0 | 22 | 0 |
| C | 0 | 22 | 0 |
| D | 0 | 23 | 0 |
| Quadrant | Total seconds | Saturated seconds | Saturation percentage |
|---|---|---|---|
| A | 5577 | 24 | 0.430339% |
| B | 5577 | 86 | 1.542048% |
| C | 5577 | 42 | 0.753093% |
| D | 5577 | 102 | 1.828940% |
Noise dominated data is calculated using 1-second bins in cleaned event files. If a bin has >2000 counts, and if more than 50% of those come from <1% of pixels, then it is considered to be noise-dominated and hence unusable.
| Quadrant | # 1 sec bins | Bins with >0 counts | Bins with >2000 counts | High rate bins dominated by noise | Noise dominated (total time) | Noise dominated (detector-on time) | Marked lightcurve |
|---|---|---|---|---|---|---|---|
| A | 7160 | 5578 | 8 | 8 | 0.11% | 0.14% | 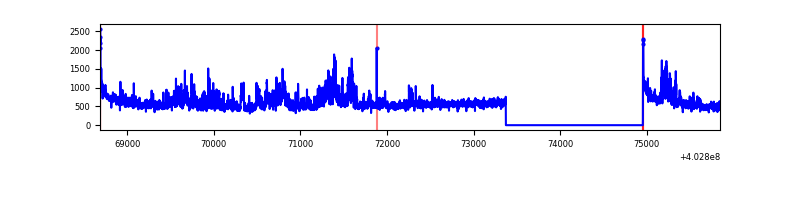 |
| B | 7160 | 5578 | 49 | 49 | 0.68% | 0.88% | 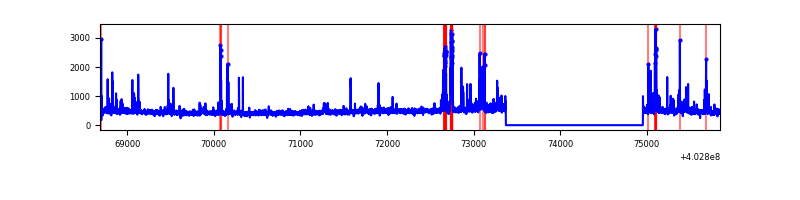 |
| C | 7160 | 5578 | 30 | 30 | 0.42% | 0.54% | 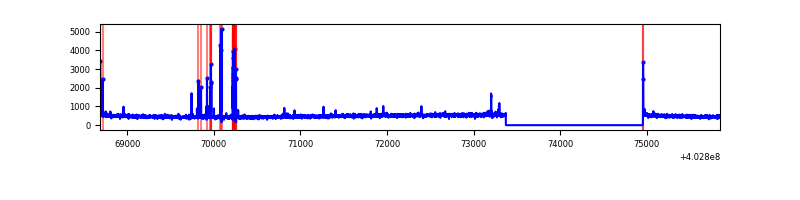 |
| D | 7160 | 5578 | 81 | 81 | 1.13% | 1.45% | 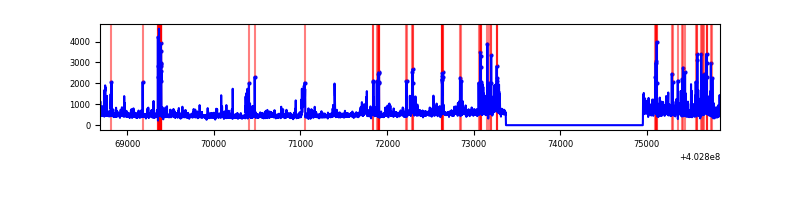 |
Top three noisy pixels from each quadrant. If the there are fewer than three noisy pixels in the level2.evt file, extra rows are filled as -1
| Pixel properties | Quadrant properties | ||||||
|---|---|---|---|---|---|---|---|
| Quadrant | DetID | PixID | Counts | Sigma | Mean | Median | Sigma |
| A | 12 | 16 | 535062 | 4111.6 | 630 | 617 | 130.0 |
| A | 10 | 83 | 379058 | 2911.43 | 630 | 617 | 130.0 |
| A | 12 | 194 | 78795 | 601.44 | 630 | 617 | 130.0 |
| B | 4 | 171 | 132299 | 1085.14 | 629 | 612 | 121.4 |
| B | 5 | 184 | 121158 | 993.34 | 629 | 612 | 121.4 |
| B | 5 | 172 | 95242 | 779.78 | 629 | 612 | 121.4 |
| C | 15 | 214 | 234493 | 1614.41 | 617 | 620 | 144.9 |
| C | 1 | 23 | 117474 | 806.64 | 617 | 620 | 144.9 |
| C | 0 | 10 | 25696 | 173.1 | 617 | 620 | 144.9 |
| D | 1 | 52 | 286248 | 1909.63 | 609 | 591 | 149.6 |
| D | 7 | 223 | 241576 | 1610.99 | 609 | 591 | 149.6 |
| D | 1 | 47 | 131682 | 876.35 | 609 | 591 | 149.6 |
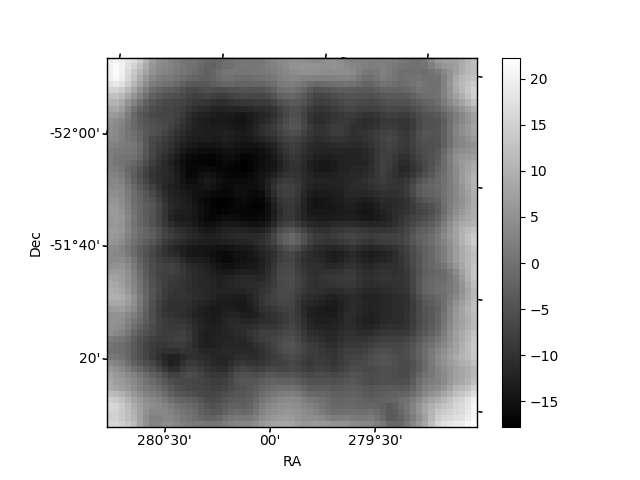
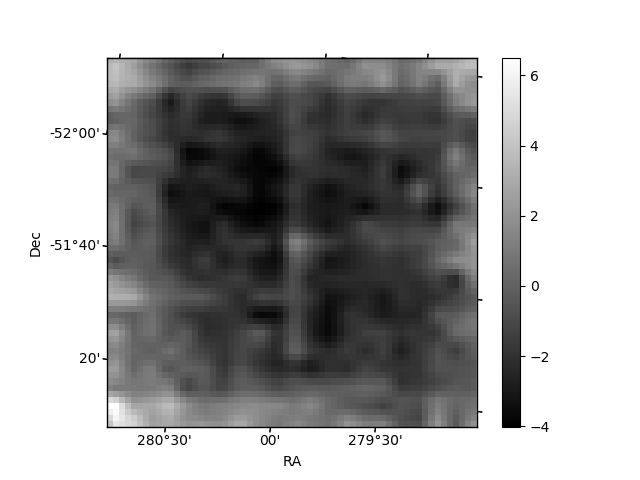
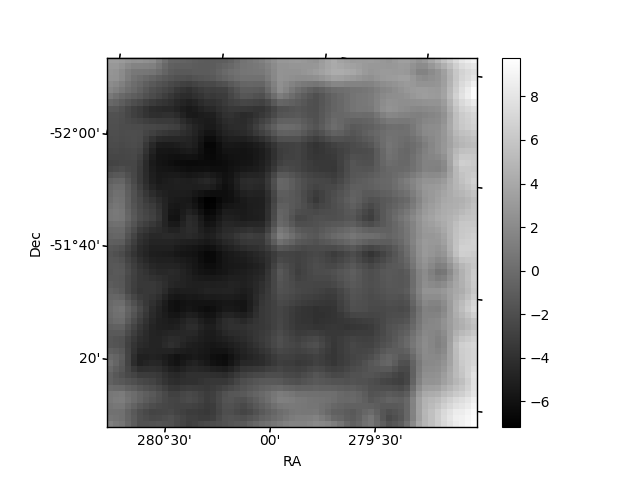
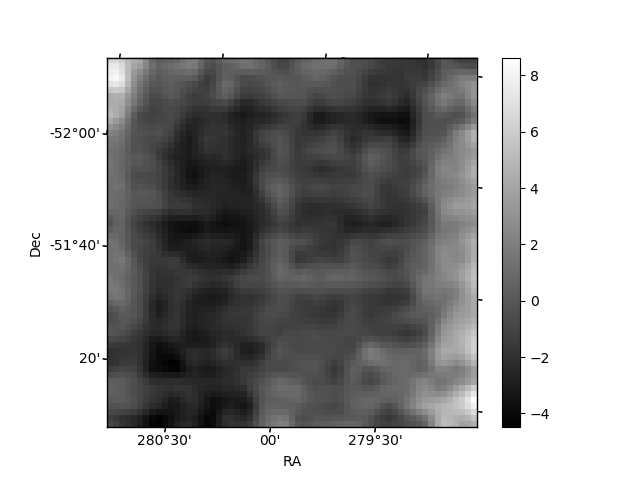
Histogram calculated using DETX and DETY for each event in the final _common_clean file
| Quadrant A | 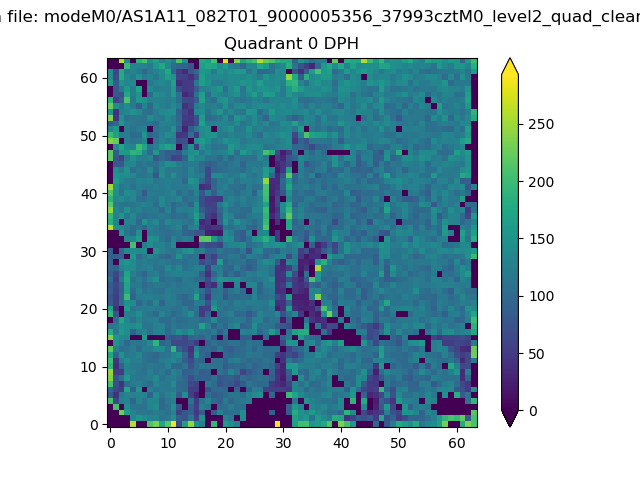 |
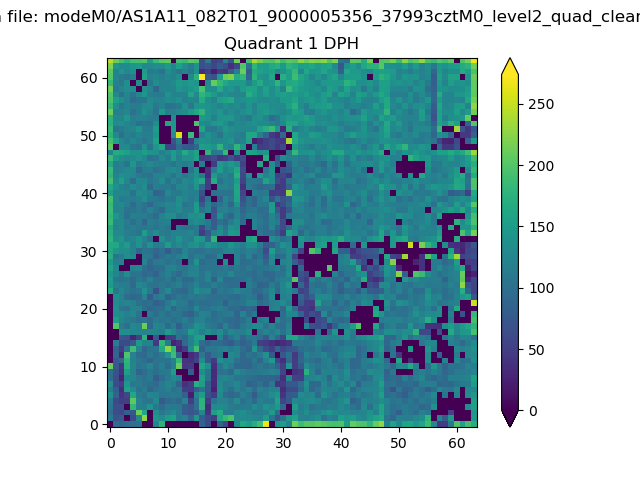 |
Quadrant B |
|---|---|---|---|
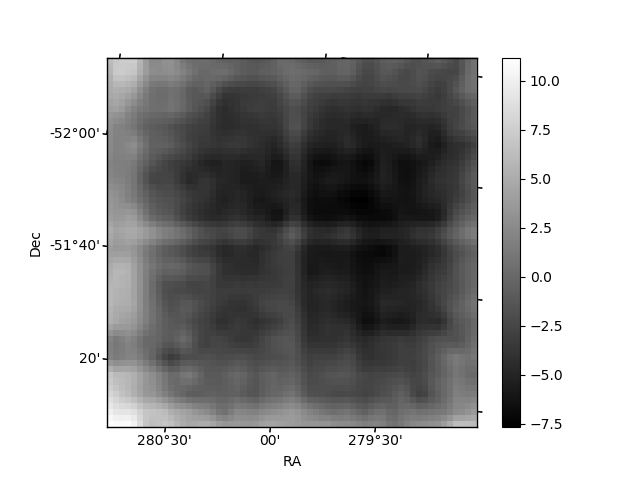
| Quadrant D | 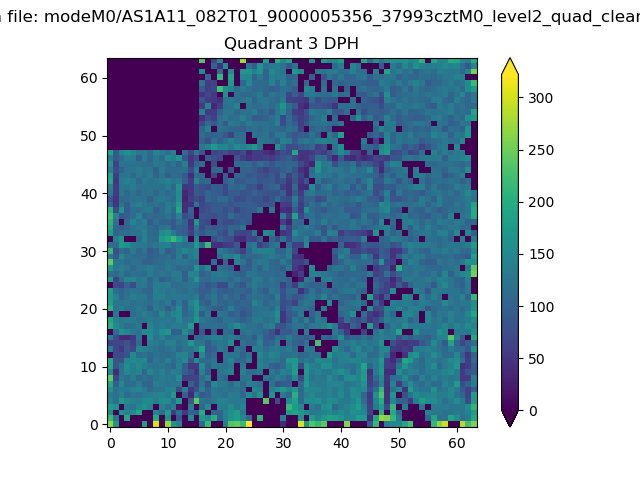 |
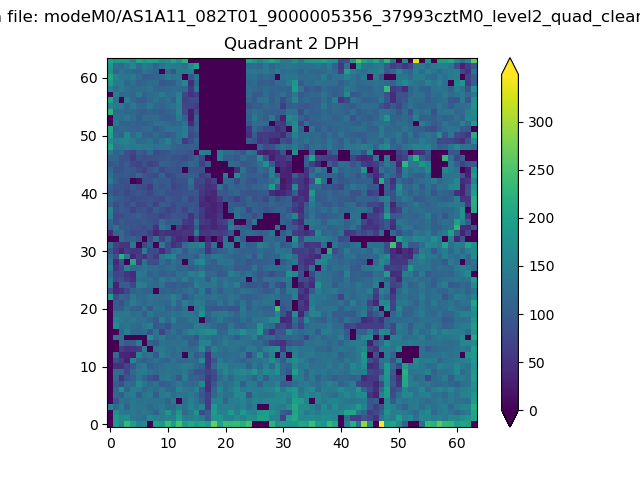 |
Quadrant C |
| Plot type | Count rate plots | Images |
|---|---|---|
| Comparison with Poisson distribution Blue bars denote a histogram of data divided into 1 sec bins. Red curve is a Poisson curve with rate = median count rate of data. |
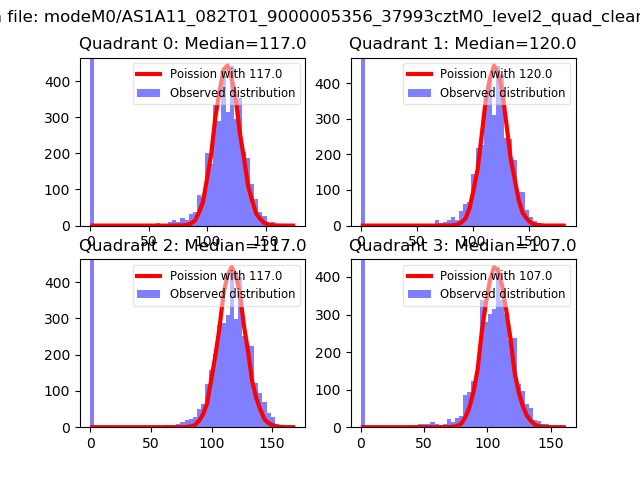 |
 |
| Quadrant-wise count rates Data is divided into 100 sec bins |
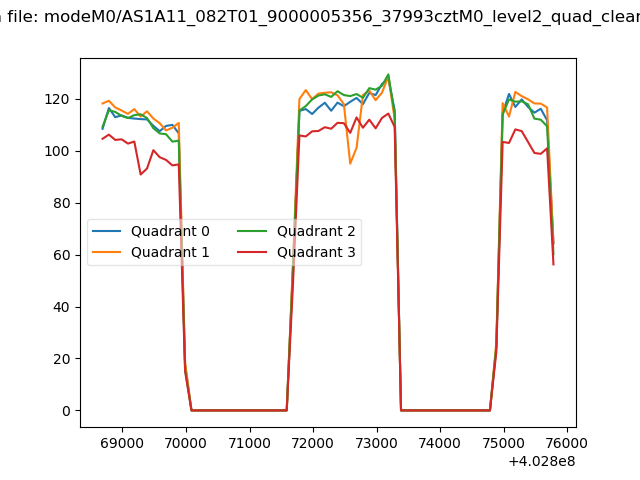 |
|
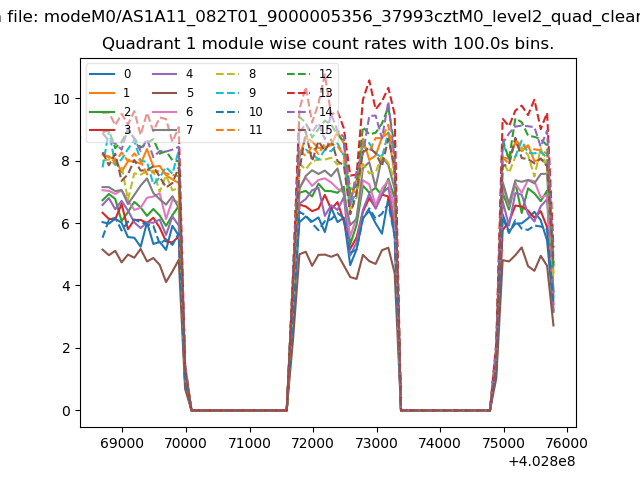
| Module-wise count rates for Quadrant A Data is divided into 100 sec bins |
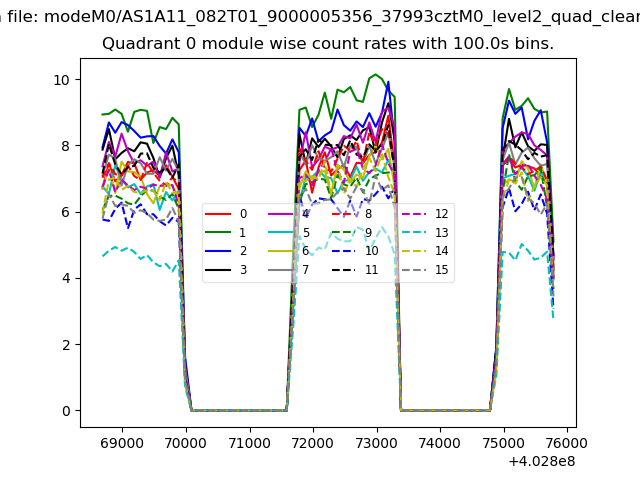 |
 |
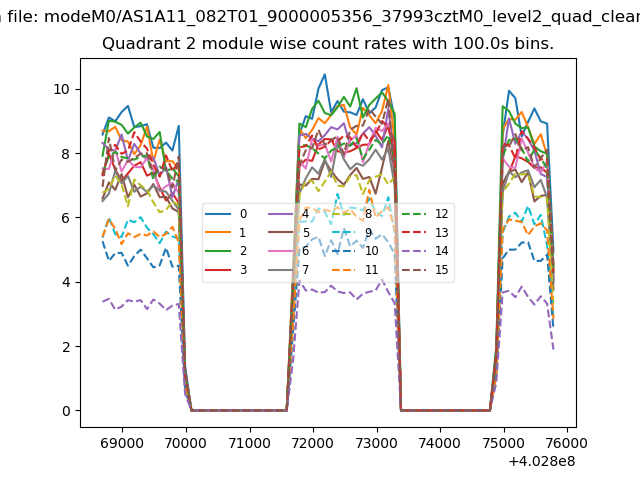
| Module-wise count rates for Quadrant B Data is divided into 100 sec bins |
 |
 |
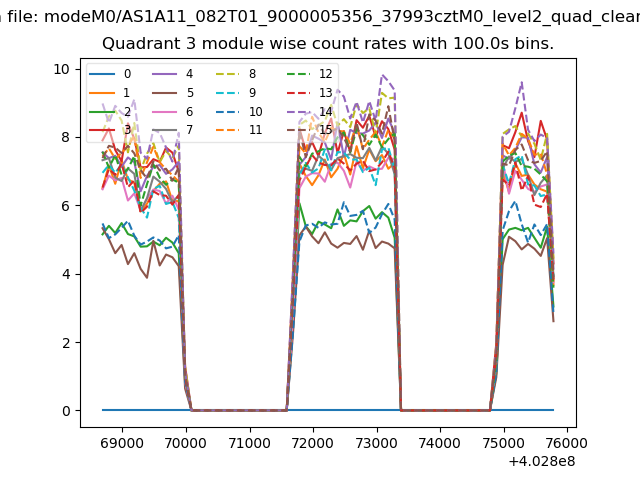
| Module-wise count rates for Quadrant C Data is divided into 100 sec bins |
 |
 |
| Module-wise count rates for Quadrant D Data is divided into 100 sec bins |
 |
 |
| Parameter | Plot |
|---|---|
| CZT HV Monitor | 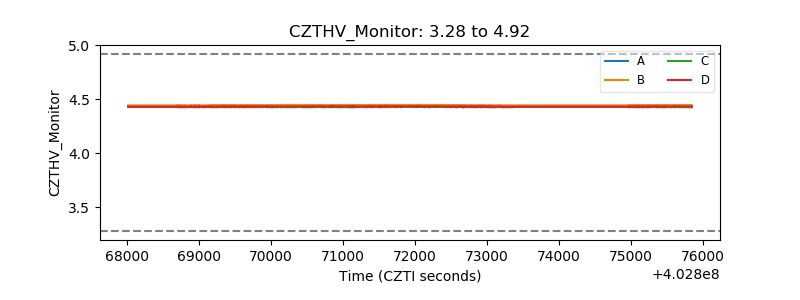 |
| D_VDD | 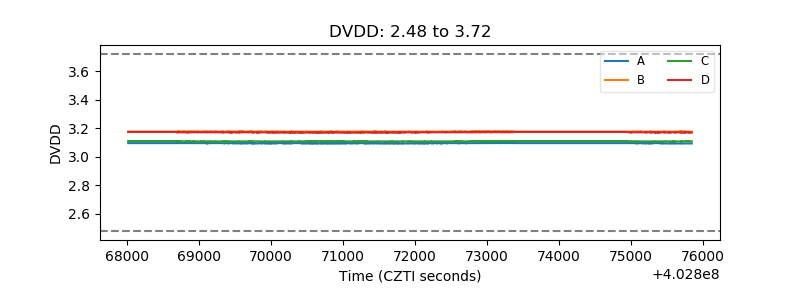 |
| Temperature 1 | 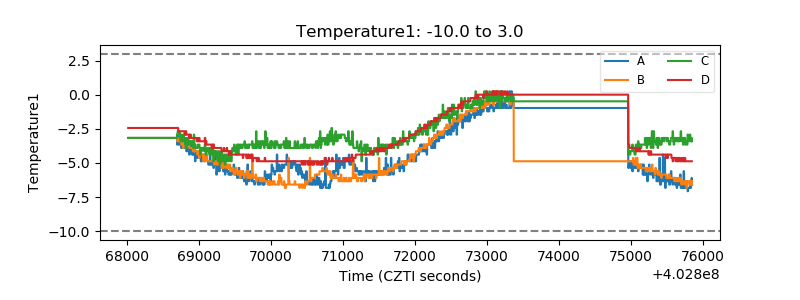 |
| Veto HV Monitor | 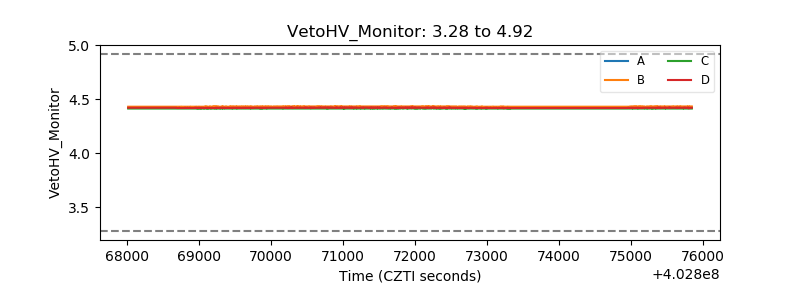 |
| Veto LLD | 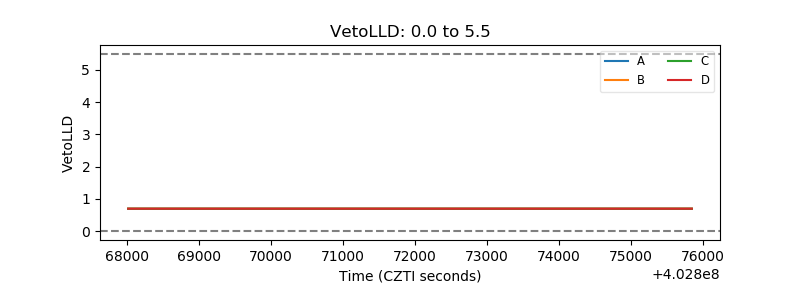 |
| Alpha Counter | 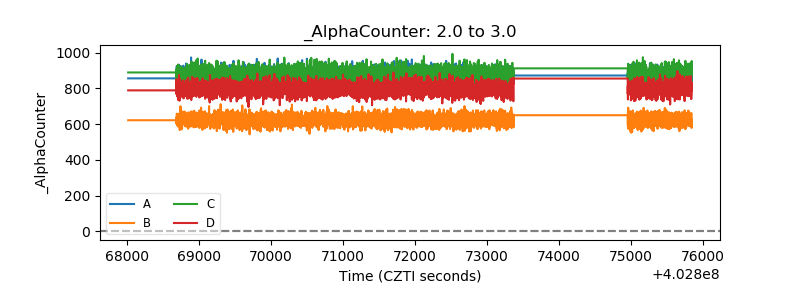 |
| _CPM_Rate | 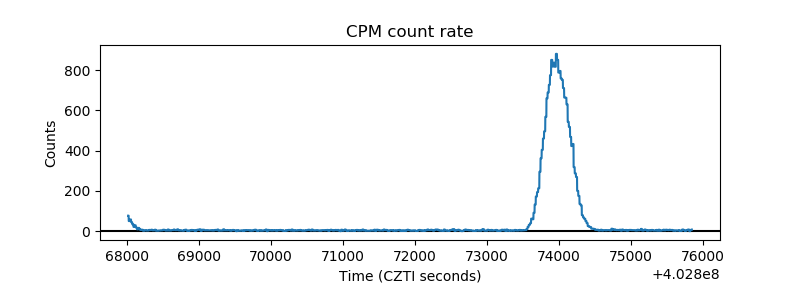 |
| CZT Counter | 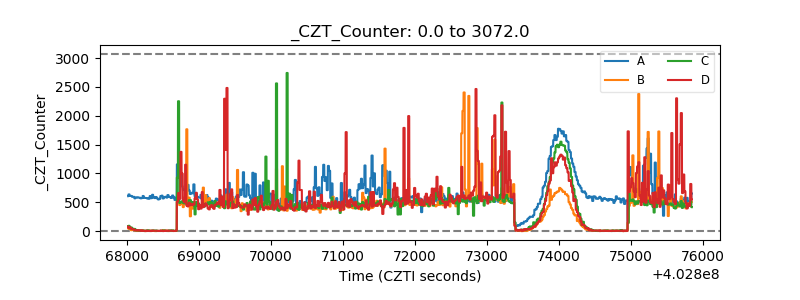 |
| +2.5 Volts monitor | 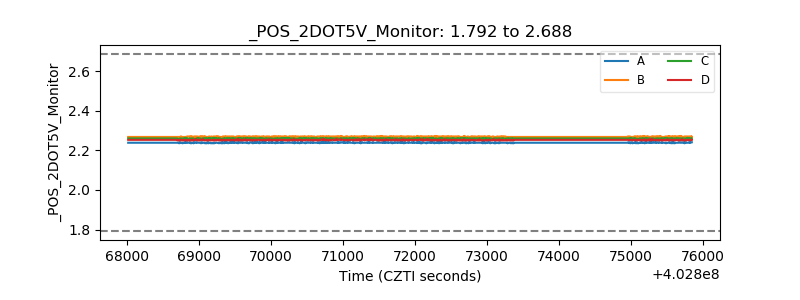 |
| +5 Volts monitor | 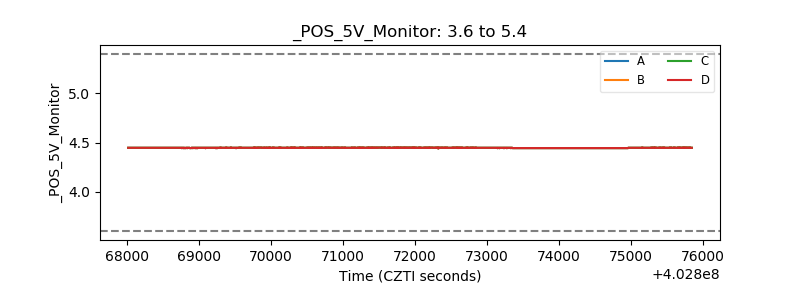 |
| _ROLL_ROT | 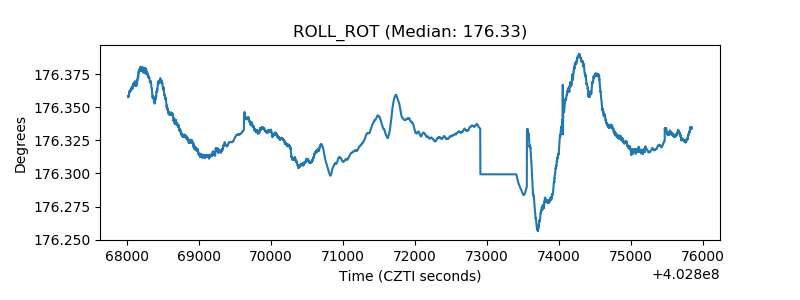 |
| _Roll_DEC | 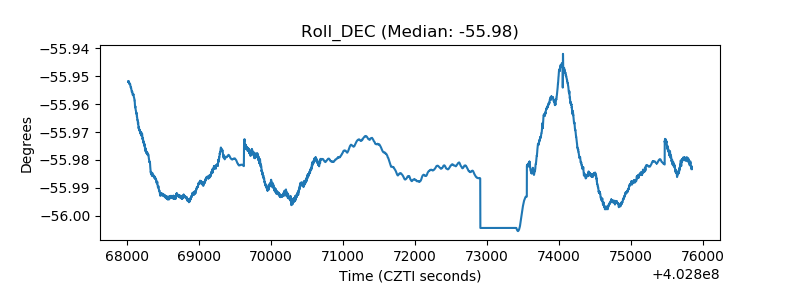 |
| _Roll_RA | 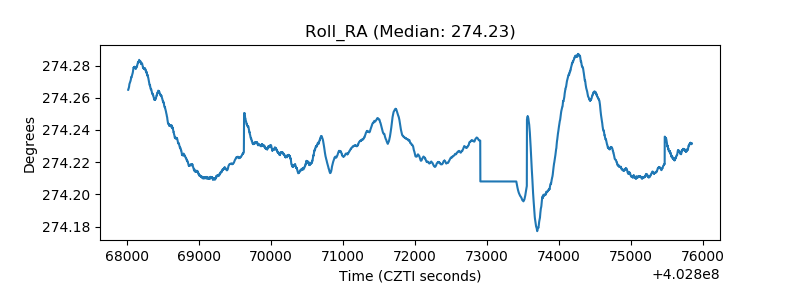 |
| Veto Counter | 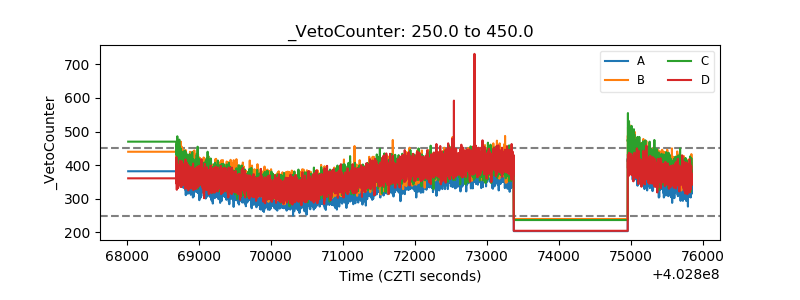 |