| Param | Original file | Final file |
|---|---|---|
| Filename | modeM0/AS1A11_082T01_9000005356_37994cztM0_level2.fits | modeM0/AS1A11_082T01_9000005356_37994cztM0_level2_quad_clean.evt |
| Size (bytes) | 365,549,760 | 59,201,280 |
| Size | 348.6 MB | 56.5 MB |
| Events in quadrant A | 3,343,182 | 354,311 |
| Events in quadrant B | 3,120,707 | 361,540 |
| Events in quadrant C | 2,999,643 | 357,251 |
| Events in quadrant D | 3,623,734 | 320,200 |
| Mode M0 | |||
|---|---|---|---|
| Quadrant | BADHDUFLAG | Total packets | Discarded packets |
| A | 0 | 13672 | 3 |
| B | 0 | 12980 | 2 |
| C | 0 | 12297 | 2 |
| D | 0 | 14483 | 2 |
| Mode SS | |||
|---|---|---|---|
| Quadrant | BADHDUFLAG | Total packets | Discarded packets |
| A | 0 | 116 | 0 |
| B | 0 | 116 | 0 |
| C | 0 | 116 | 0 |
| D | 0 | 116 | 0 |
| Mode M9 | |||
|---|---|---|---|
| Quadrant | BADHDUFLAG | Total packets | Discarded packets |
| A | 0 | 32 | 0 |
| B | 0 | 32 | 0 |
| C | 0 | 32 | 0 |
| D | 0 | 32 | 0 |
| Quadrant | Total seconds | Saturated seconds | Saturation percentage |
|---|---|---|---|
| A | 5710 | 34 | 0.595447% |
| B | 5710 | 95 | 1.663748% |
| C | 5710 | 43 | 0.753065% |
| D | 5710 | 104 | 1.821366% |
Noise dominated data is calculated using 1-second bins in cleaned event files. If a bin has >2000 counts, and if more than 50% of those come from <1% of pixels, then it is considered to be noise-dominated and hence unusable.
| Quadrant | # 1 sec bins | Bins with >0 counts | Bins with >2000 counts | High rate bins dominated by noise | Noise dominated (total time) | Noise dominated (detector-on time) | Marked lightcurve |
|---|---|---|---|---|---|---|---|
| A | 7412 | 5711 | 16 | 16 | 0.22% | 0.28% | 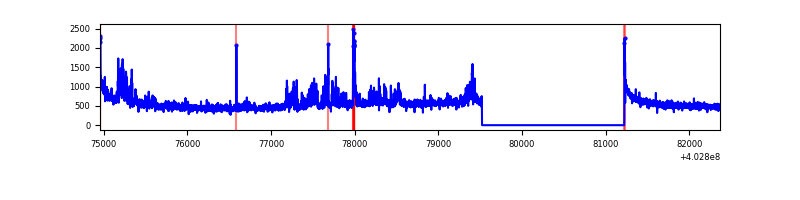 |
| B | 7412 | 5711 | 55 | 55 | 0.74% | 0.96% | 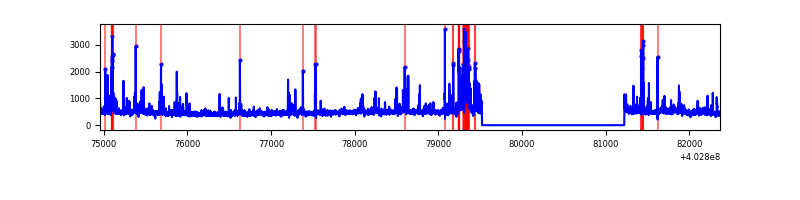 |
| C | 7412 | 5711 | 31 | 31 | 0.42% | 0.54% | 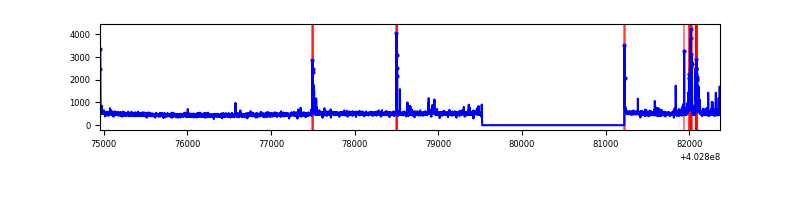 |
| D | 7412 | 5711 | 87 | 87 | 1.17% | 1.52% | 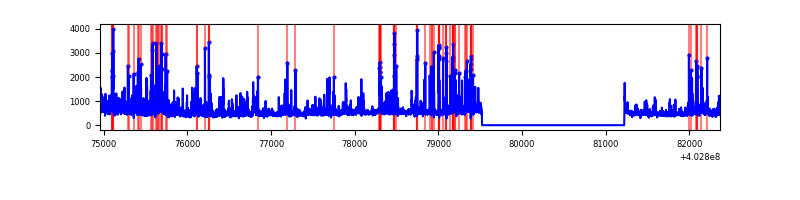 |
Top three noisy pixels from each quadrant. If the there are fewer than three noisy pixels in the level2.evt file, extra rows are filled as -1
| Pixel properties | Quadrant properties | ||||||
|---|---|---|---|---|---|---|---|
| Quadrant | DetID | PixID | Counts | Sigma | Mean | Median | Sigma |
| A | 10 | 83 | 378436 | 2845.61 | 649 | 636 | 132.8 |
| A | 12 | 16 | 314845 | 2366.64 | 649 | 636 | 132.8 |
| A | 15 | 222 | 59103 | 440.38 | 649 | 636 | 132.8 |
| B | 4 | 171 | 172414 | 1393.9 | 649 | 631 | 123.2 |
| B | 0 | 186 | 87668 | 706.24 | 649 | 631 | 123.2 |
| B | 5 | 255 | 86923 | 700.2 | 649 | 631 | 123.2 |
| C | 15 | 214 | 239932 | 1616.93 | 638 | 641 | 148.0 |
| C | 14 | 254 | 169841 | 1143.32 | 638 | 641 | 148.0 |
| C | 1 | 23 | 37876 | 251.6 | 638 | 641 | 148.0 |
| D | 1 | 52 | 559916 | 3641.47 | 629 | 610 | 153.6 |
| D | 7 | 223 | 232114 | 1507.25 | 629 | 610 | 153.6 |
| D | 5 | 157 | 78638 | 508.02 | 629 | 610 | 153.6 |
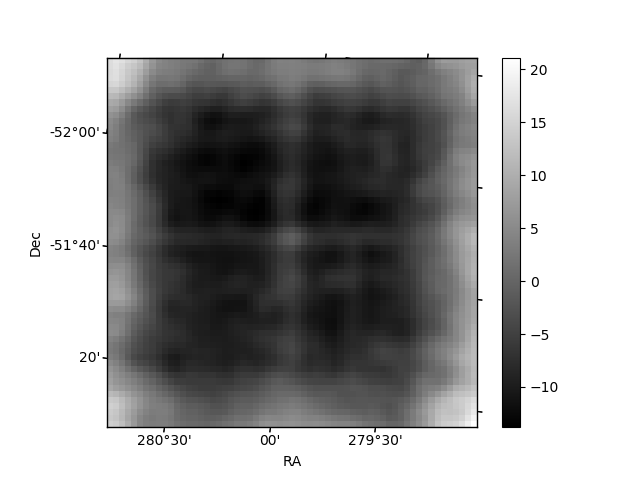
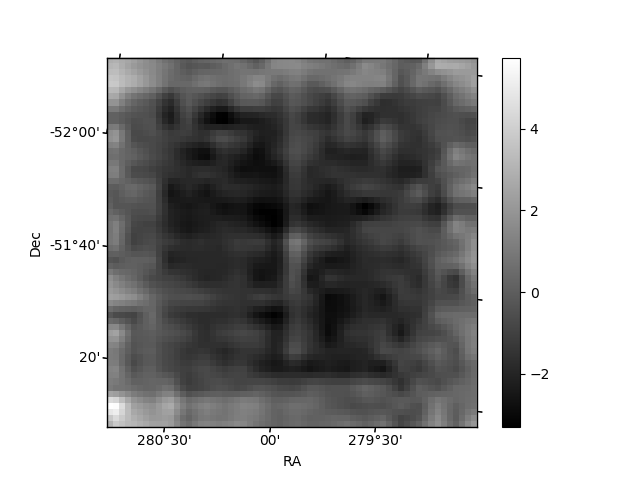
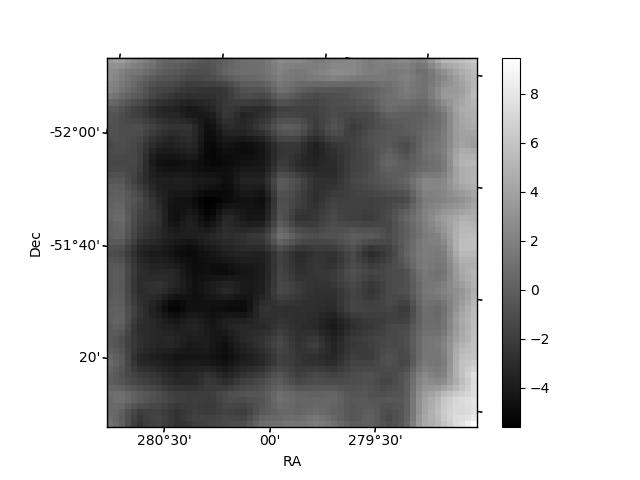
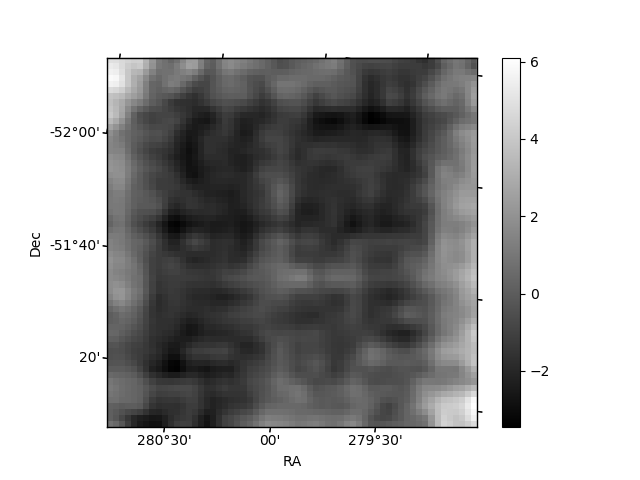
Histogram calculated using DETX and DETY for each event in the final _common_clean file
| Quadrant A | 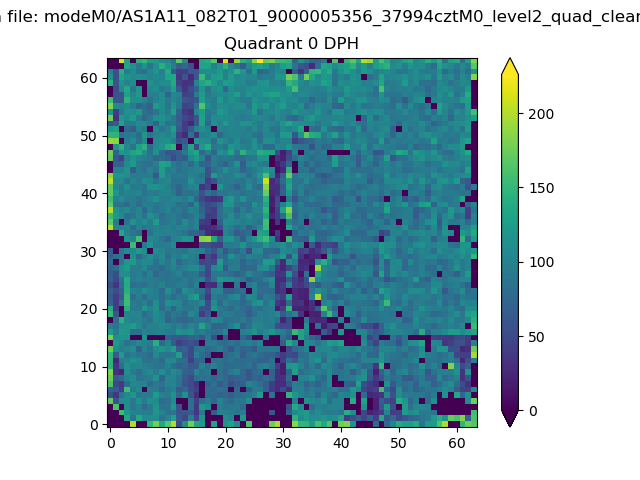 |
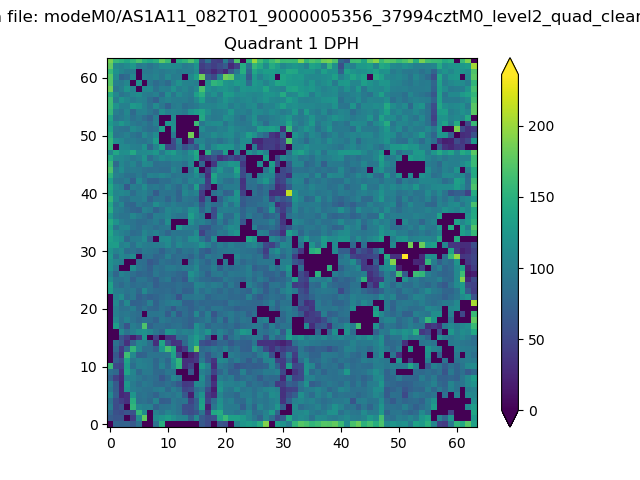 |
Quadrant B |
|---|---|---|---|
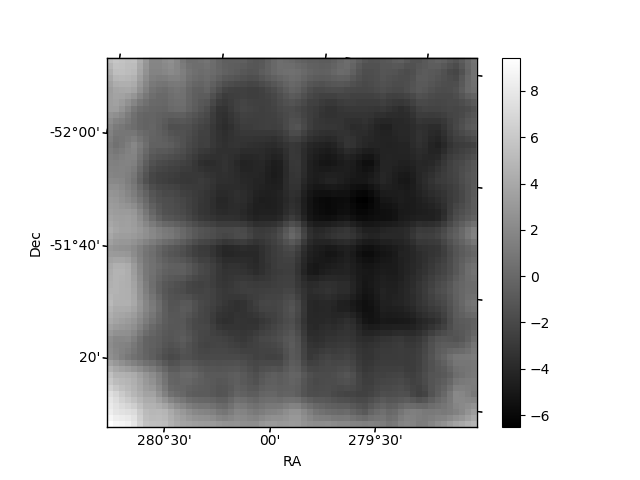
| Quadrant D | 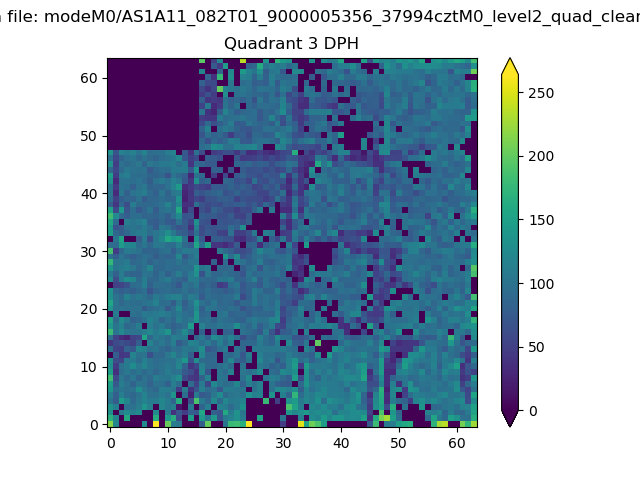 |
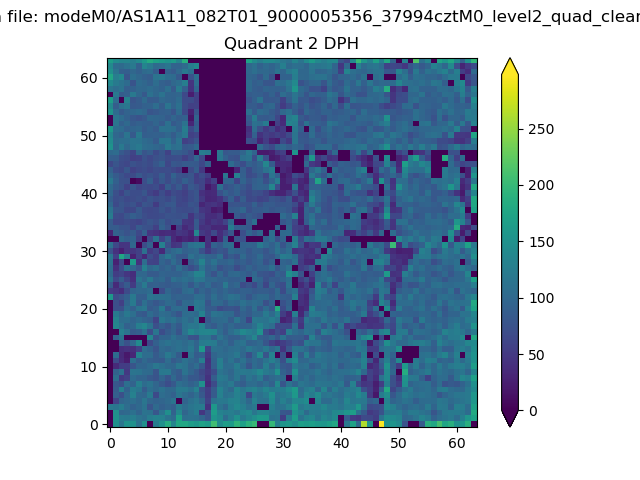 |
Quadrant C |
| Plot type | Count rate plots | Images |
|---|---|---|
| Comparison with Poisson distribution Blue bars denote a histogram of data divided into 1 sec bins. Red curve is a Poisson curve with rate = median count rate of data. |
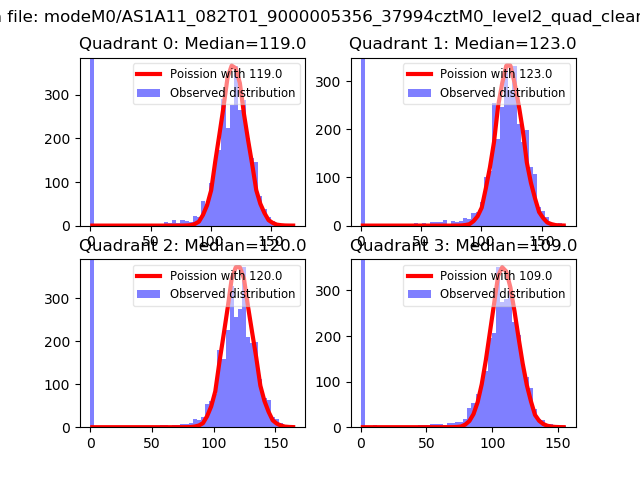 |
 |
| Quadrant-wise count rates Data is divided into 100 sec bins |
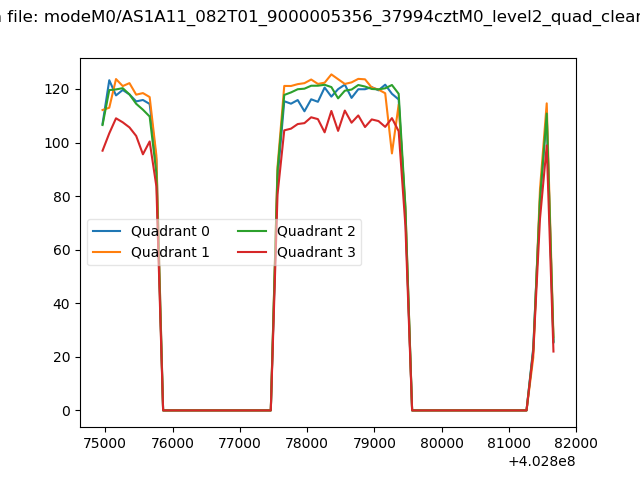 |
|
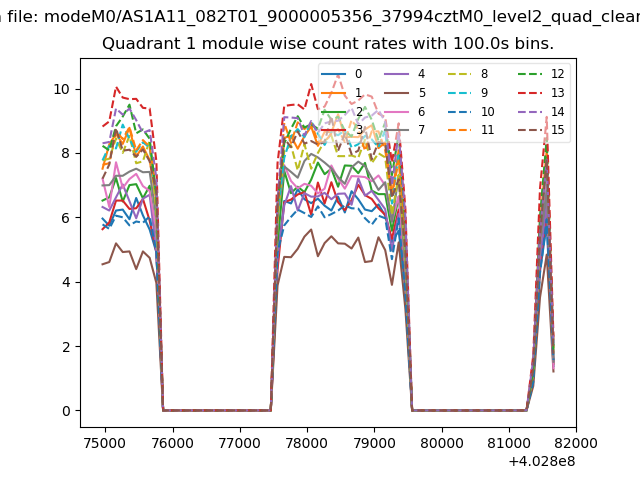
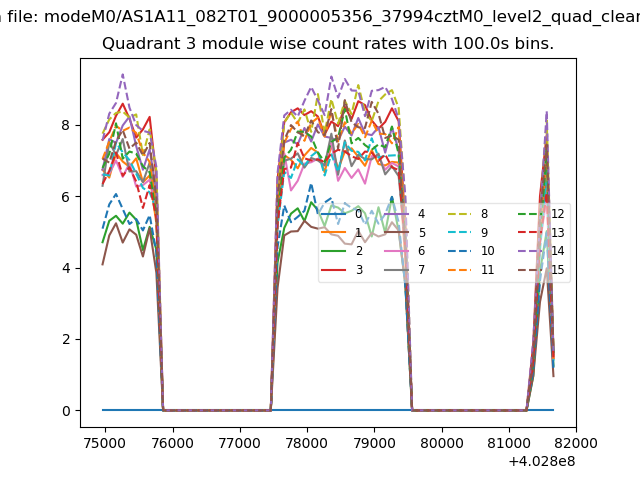
| Module-wise count rates for Quadrant A Data is divided into 100 sec bins |
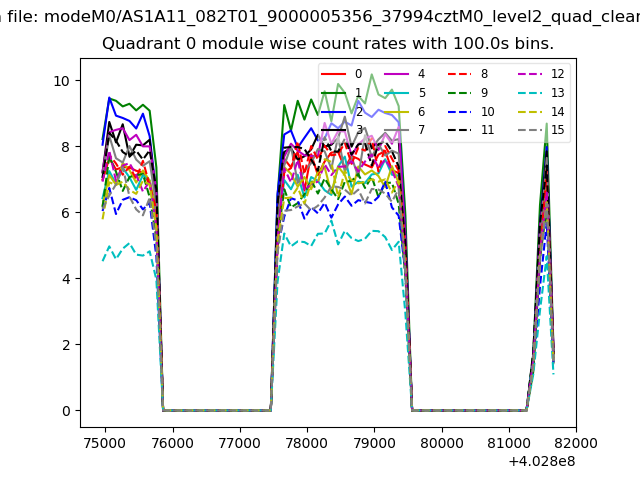 |
 |
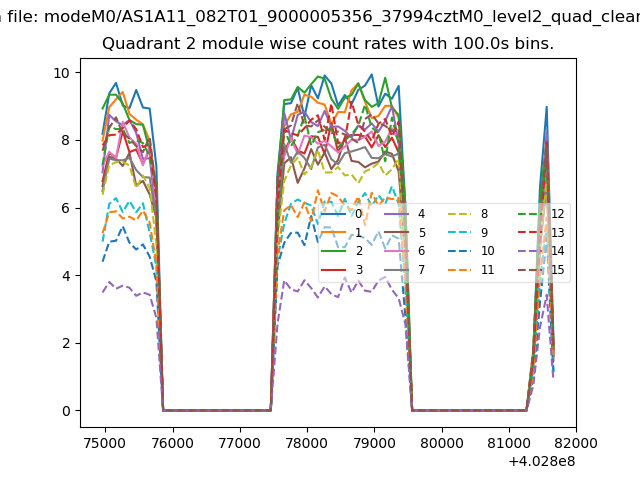
| Module-wise count rates for Quadrant B Data is divided into 100 sec bins |
 |
 |
| Module-wise count rates for Quadrant C Data is divided into 100 sec bins |
 |
 |
| Module-wise count rates for Quadrant D Data is divided into 100 sec bins |
 |
 |
| Parameter | Plot |
|---|---|
| CZT HV Monitor | 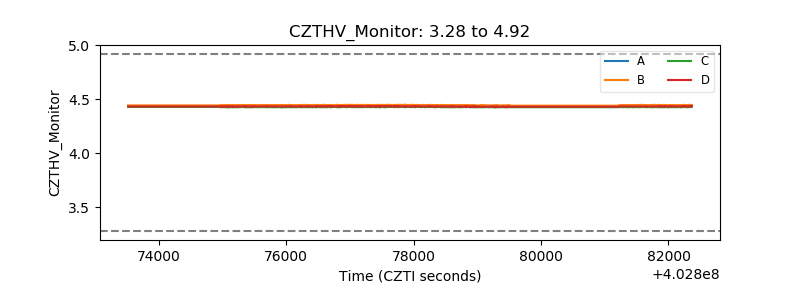 |
| D_VDD | 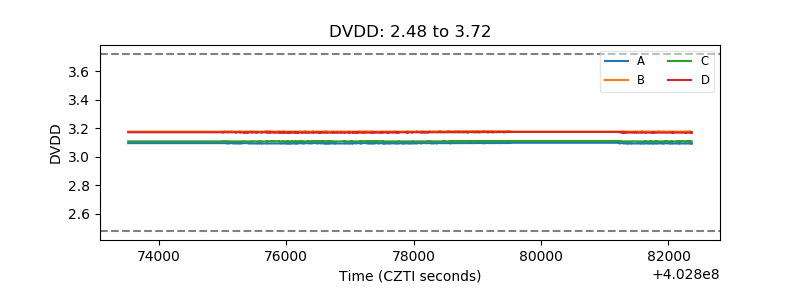 |
| Temperature 1 | 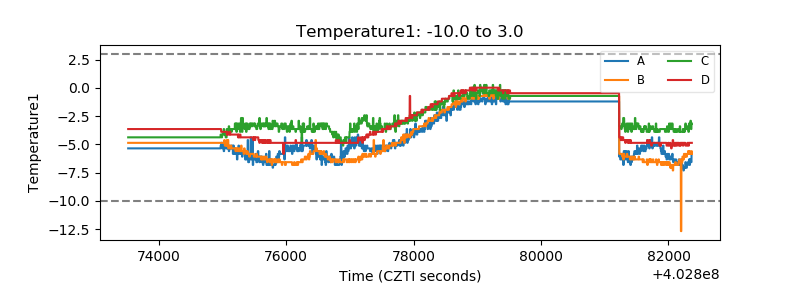 |
| Veto HV Monitor | 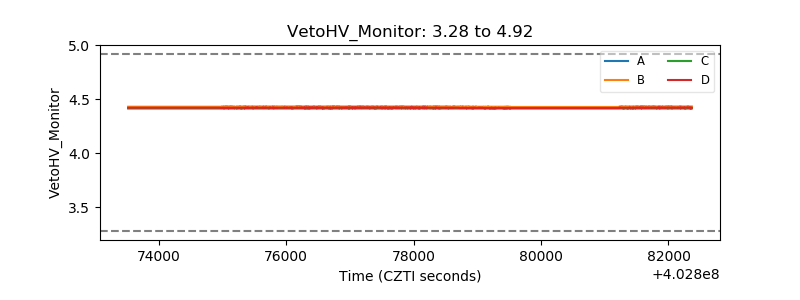 |
| Veto LLD | 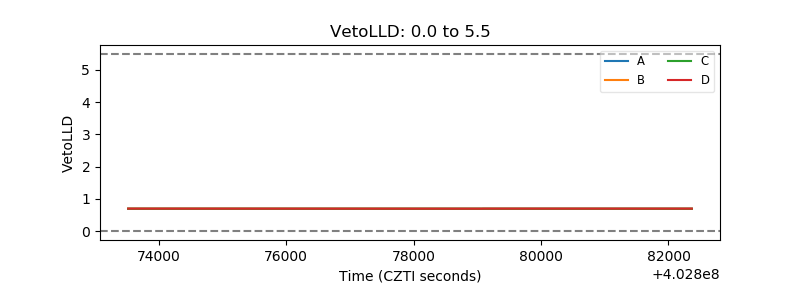 |
| Alpha Counter | 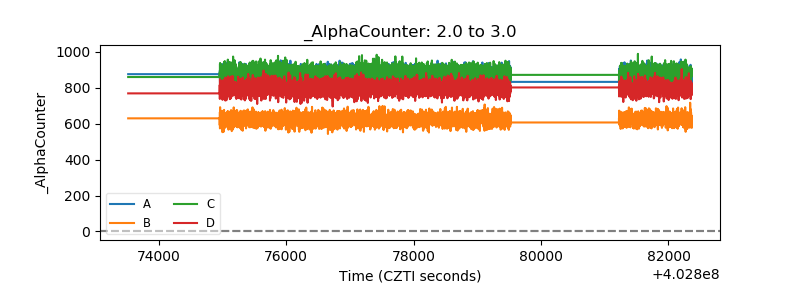 |
| _CPM_Rate | 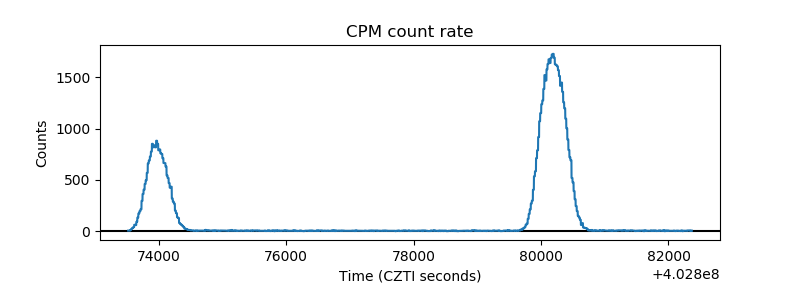 |
| CZT Counter | 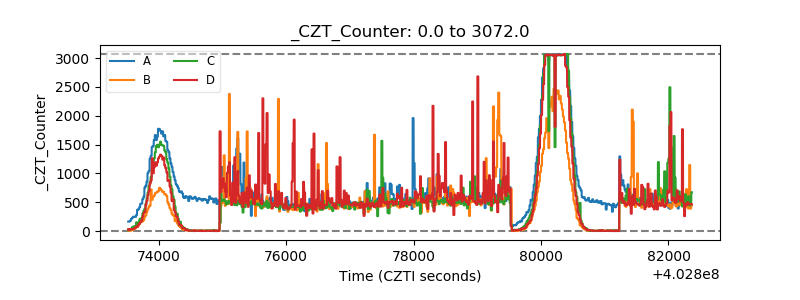 |
| +2.5 Volts monitor | 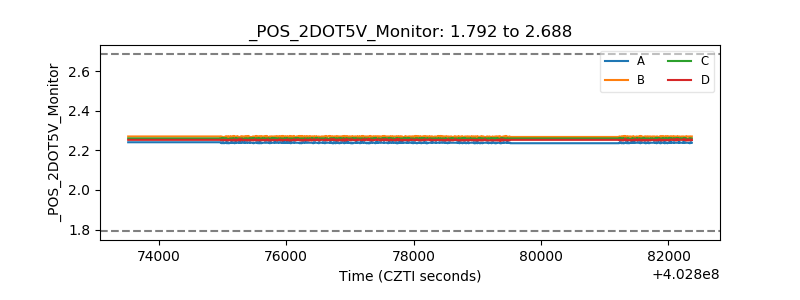 |
| +5 Volts monitor | 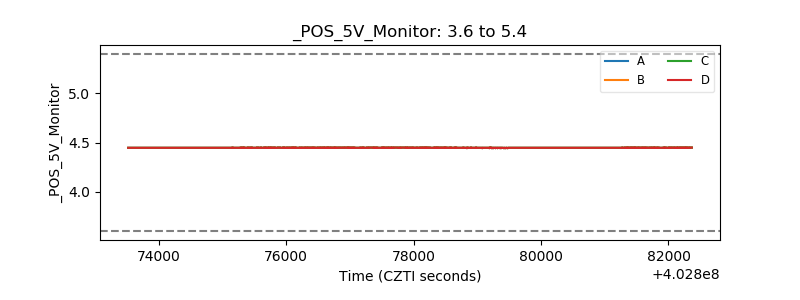 |
| _ROLL_ROT | 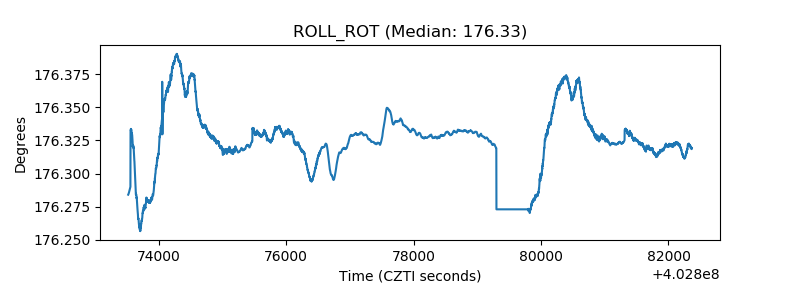 |
| _Roll_DEC | 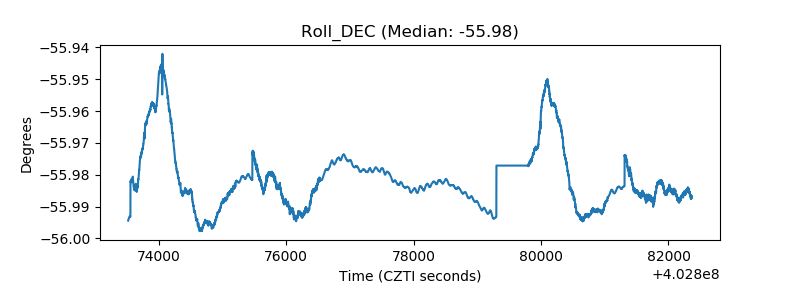 |
| _Roll_RA | 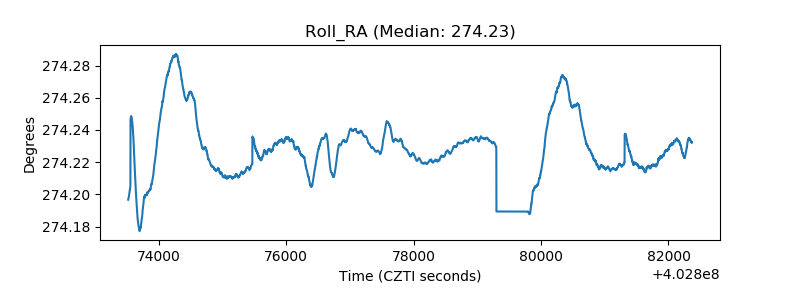 |
| Veto Counter | 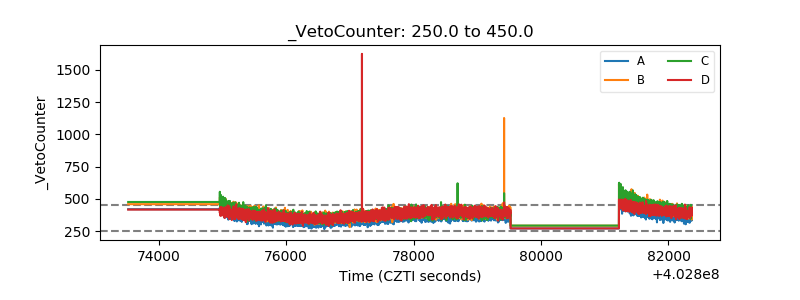 |