| Param | Original file | Final file |
|---|---|---|
| Filename | modeM0/AS1A11_082T01_9000005356_37996cztM0_level2.fits | modeM0/AS1A11_082T01_9000005356_37996cztM0_level2_quad_clean.evt |
| Size (bytes) | 387,552,960 | 97,689,600 |
| Size | 369.6 MB | 93.2 MB |
| Events in quadrant A | 3,893,596 | 639,306 |
| Events in quadrant B | 3,095,310 | 688,106 |
| Events in quadrant C | 3,100,094 | 659,137 |
| Events in quadrant D | 3,833,652 | 590,771 |
| Mode M0 | |||
|---|---|---|---|
| Quadrant | BADHDUFLAG | Total packets | Discarded packets |
| A | 0 | 14972 | 3 |
| B | 0 | 12560 | 2 |
| C | 0 | 12283 | 2 |
| D | 0 | 14979 | 2 |
| Mode SS | |||
|---|---|---|---|
| Quadrant | BADHDUFLAG | Total packets | Discarded packets |
| A | 0 | 110 | 0 |
| B | 0 | 110 | 0 |
| C | 0 | 110 | 0 |
| D | 0 | 110 | 0 |
| Mode M9 | |||
|---|---|---|---|
| Quadrant | BADHDUFLAG | Total packets | Discarded packets |
| A | 0 | 32 | 0 |
| B | 0 | 32 | 0 |
| C | 0 | 32 | 0 |
| D | 0 | 33 | 0 |
| Quadrant | Total seconds | Saturated seconds | Saturation percentage |
|---|---|---|---|
| A | 5442 | 314 | 5.769938% |
| B | 5442 | 93 | 1.708931% |
| C | 5442 | 68 | 1.249541% |
| D | 5442 | 192 | 3.528115% |
Noise dominated data is calculated using 1-second bins in cleaned event files. If a bin has >2000 counts, and if more than 50% of those come from <1% of pixels, then it is considered to be noise-dominated and hence unusable.
| Quadrant | # 1 sec bins | Bins with >0 counts | Bins with >2000 counts | High rate bins dominated by noise | Noise dominated (total time) | Noise dominated (detector-on time) | Marked lightcurve |
|---|---|---|---|---|---|---|---|
| A | 7264 | 5443 | 222 | 222 | 3.06% | 4.08% | 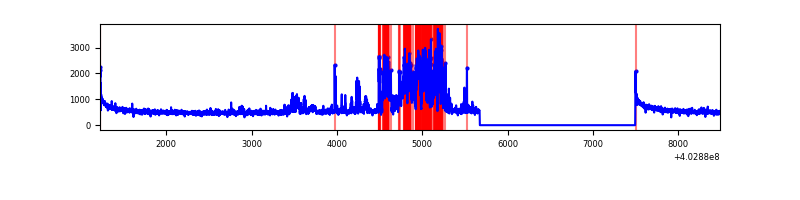 |
| B | 7264 | 5443 | 57 | 57 | 0.78% | 1.05% | 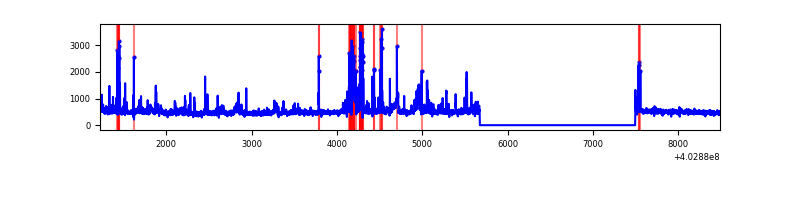 |
| C | 7264 | 5443 | 53 | 53 | 0.73% | 0.97% | 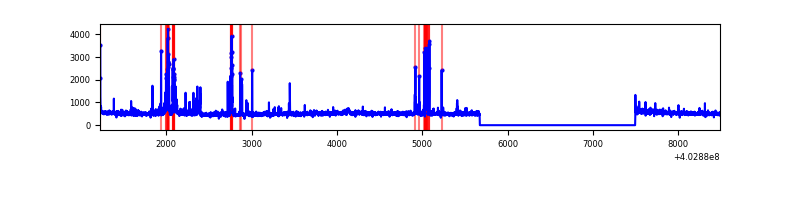 |
| D | 7264 | 5443 | 151 | 151 | 2.08% | 2.77% | 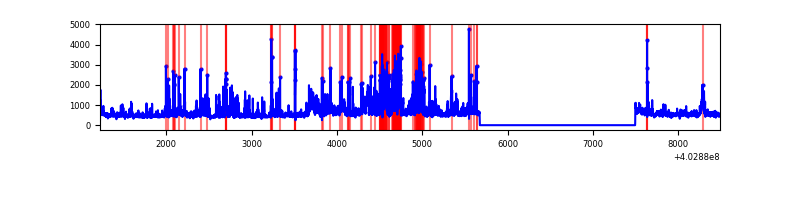 |
Top three noisy pixels from each quadrant. If the there are fewer than three noisy pixels in the level2.evt file, extra rows are filled as -1
| Pixel properties | Quadrant properties | ||||||
|---|---|---|---|---|---|---|---|
| Quadrant | DetID | PixID | Counts | Sigma | Mean | Median | Sigma |
| A | 12 | 16 | 829739 | 6532.92 | 631 | 620 | 126.9 |
| A | 10 | 83 | 356728 | 2805.9 | 631 | 620 | 126.9 |
| A | 12 | 194 | 116932 | 916.46 | 631 | 620 | 126.9 |
| B | 4 | 171 | 315341 | 2640.91 | 638 | 624 | 119.2 |
| B | 5 | 172 | 109334 | 912.23 | 638 | 624 | 119.2 |
| B | 5 | 184 | 75047 | 624.51 | 638 | 624 | 119.2 |
| C | 14 | 254 | 291449 | 1993.01 | 631 | 636 | 145.9 |
| C | 15 | 214 | 230173 | 1573.07 | 631 | 636 | 145.9 |
| C | 1 | 23 | 83553 | 568.25 | 631 | 636 | 145.9 |
| D | 1 | 52 | 735472 | 4938.79 | 620 | 603 | 148.8 |
| D | 12 | 227 | 229429 | 1537.86 | 620 | 603 | 148.8 |
| D | 7 | 223 | 187939 | 1259.02 | 620 | 603 | 148.8 |
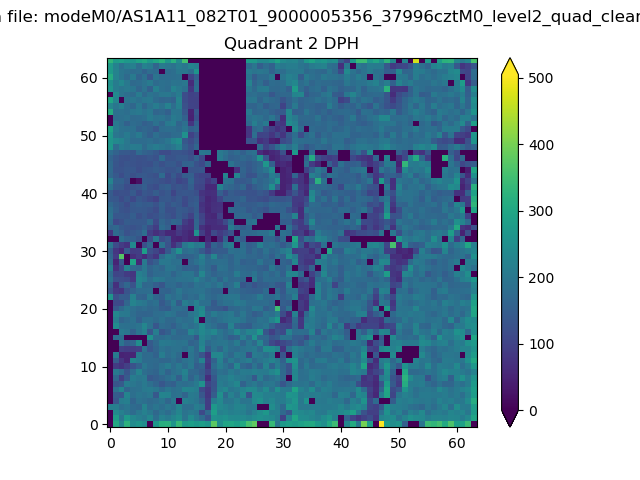
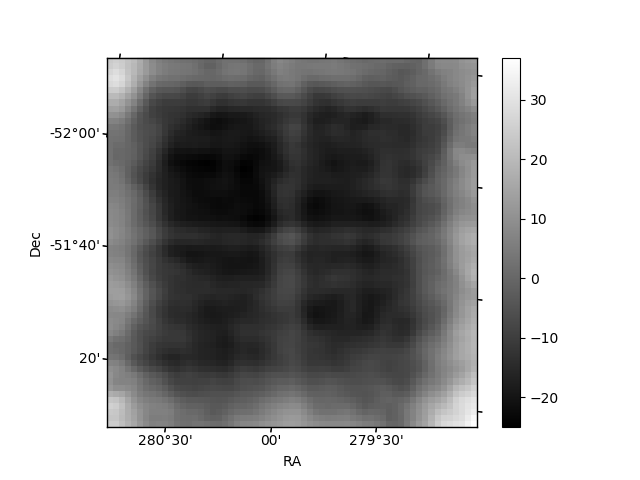
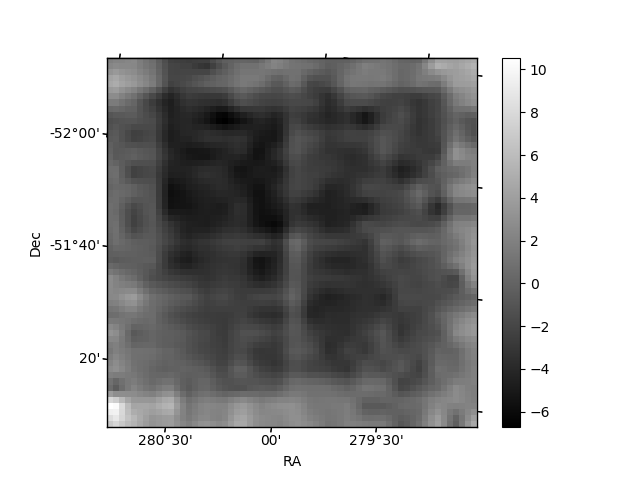
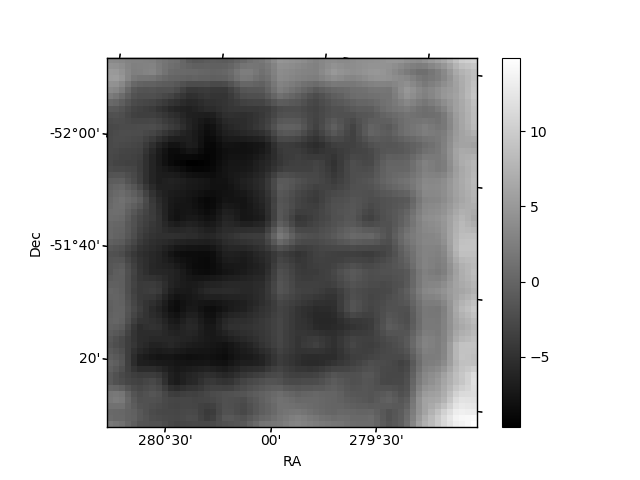
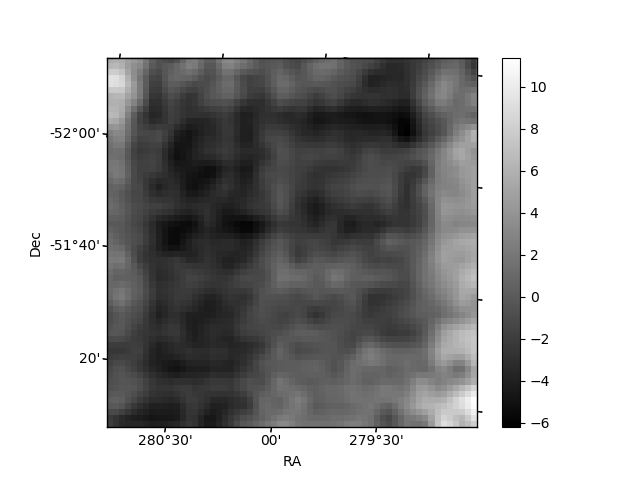
Histogram calculated using DETX and DETY for each event in the final _common_clean file
| Quadrant A | 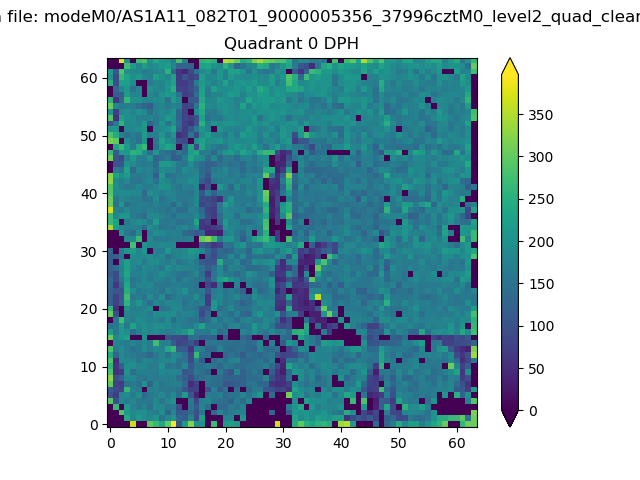 |
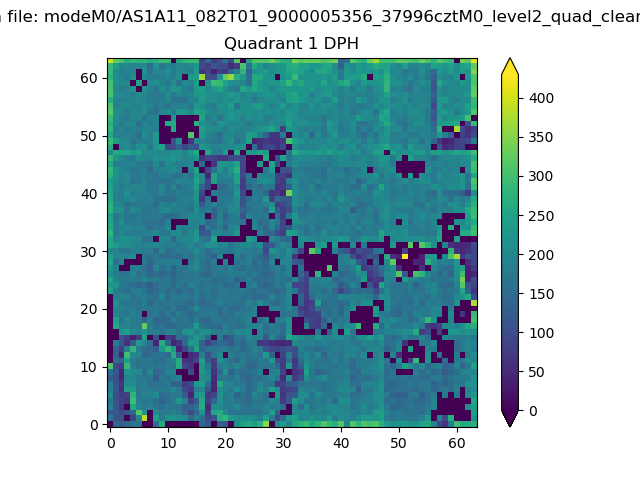 |
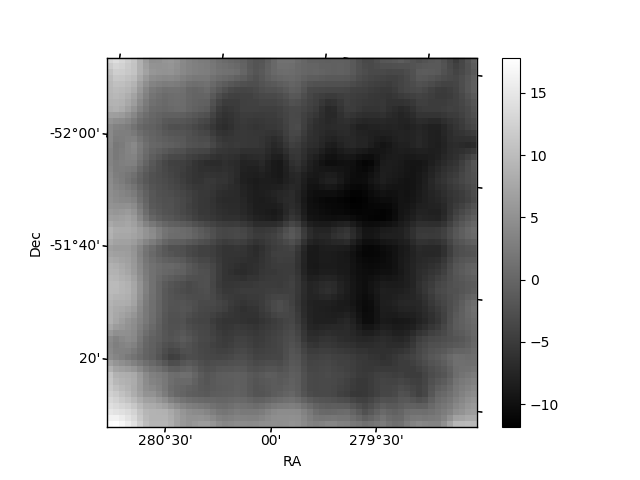
Quadrant B |
|---|---|---|---|
| Quadrant D | 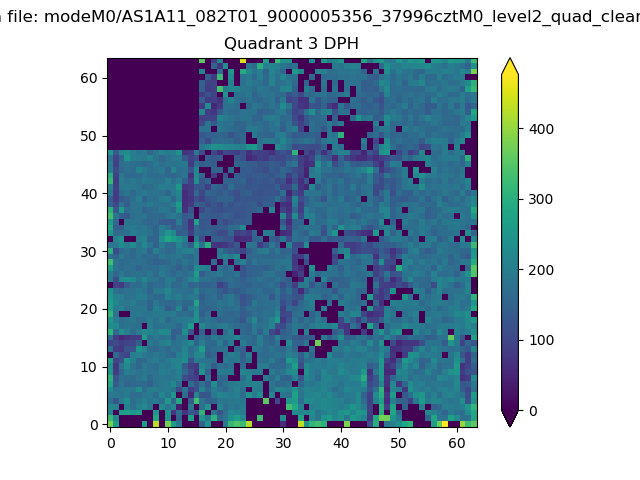 |
 |
Quadrant C |
| Plot type | Count rate plots | Images |
|---|---|---|
| Comparison with Poisson distribution Blue bars denote a histogram of data divided into 1 sec bins. Red curve is a Poisson curve with rate = median count rate of data. |
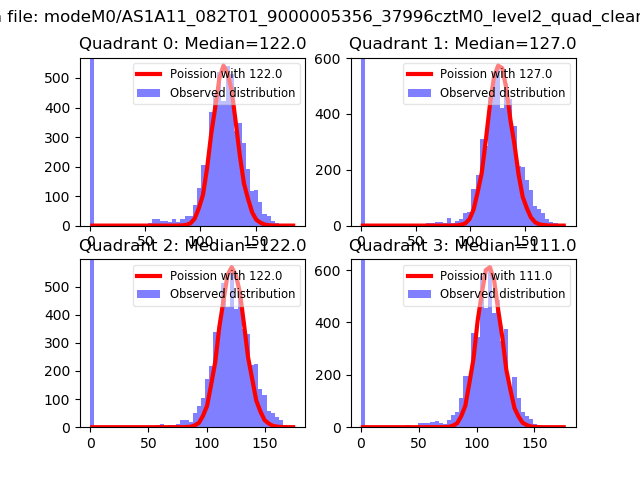 |
 |
| Quadrant-wise count rates Data is divided into 100 sec bins |
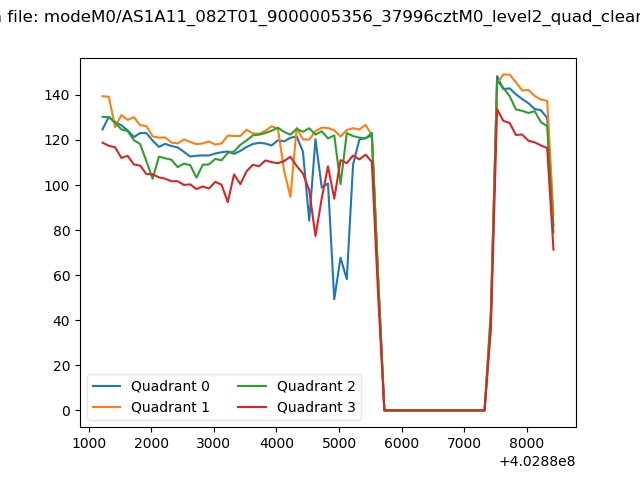 |
|
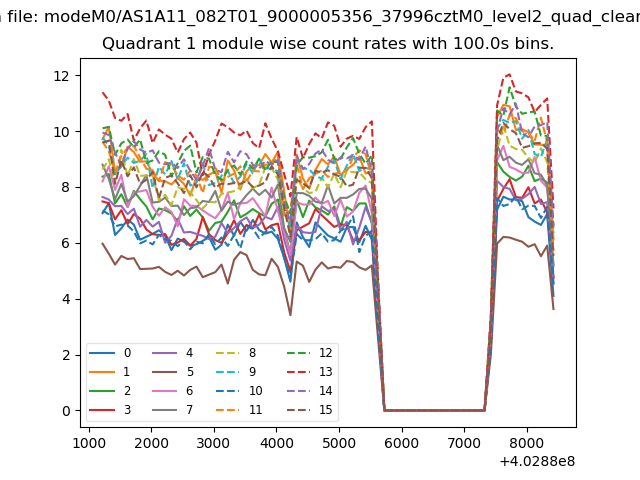
| Module-wise count rates for Quadrant A Data is divided into 100 sec bins |
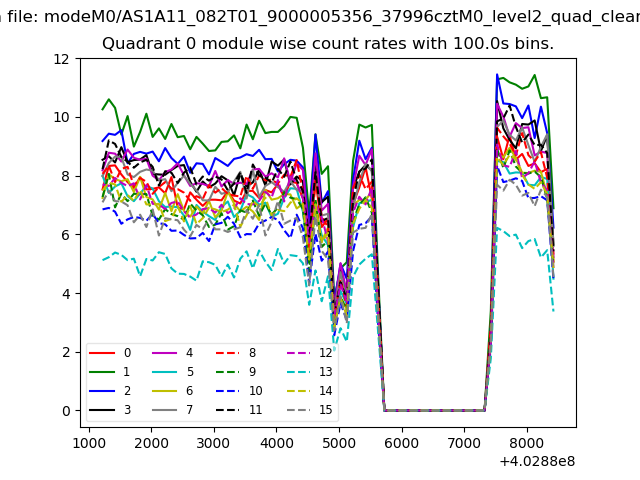 |
 |
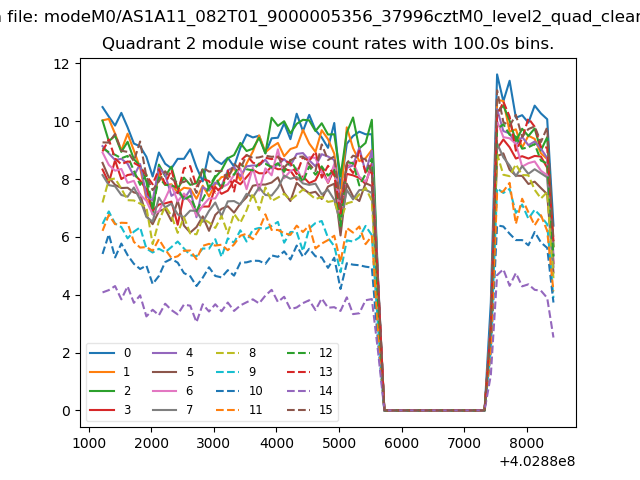
| Module-wise count rates for Quadrant B Data is divided into 100 sec bins |
 |
 |
| Module-wise count rates for Quadrant C Data is divided into 100 sec bins |
 |
 |
| Module-wise count rates for Quadrant D Data is divided into 100 sec bins |
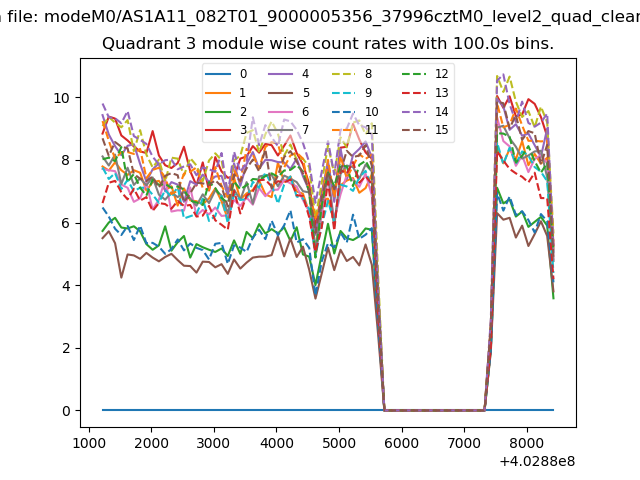 |
 |
| Parameter | Plot |
|---|---|
| CZT HV Monitor | 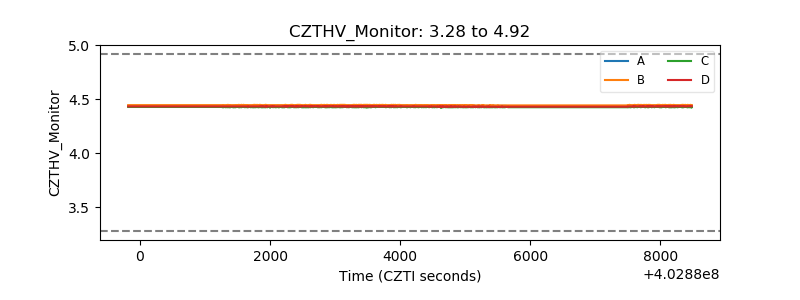 |
| D_VDD | 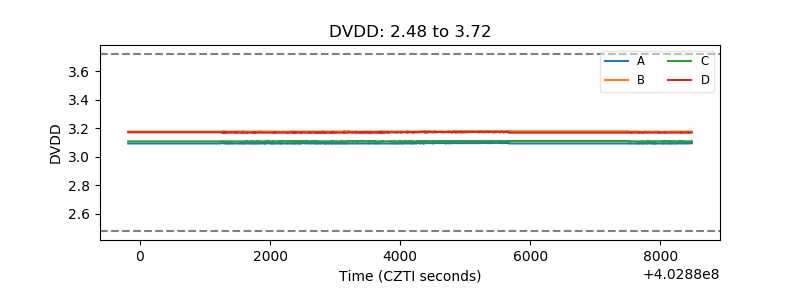 |
| Temperature 1 | 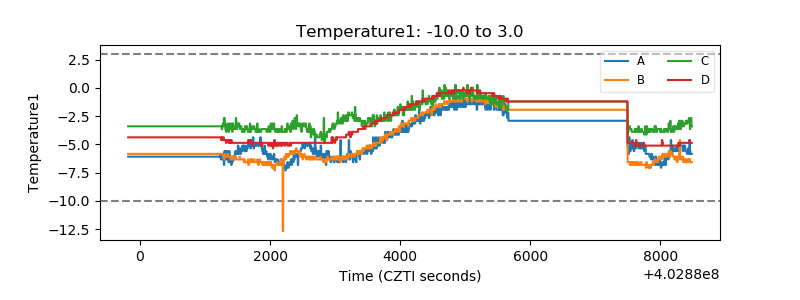 |
| Veto HV Monitor | 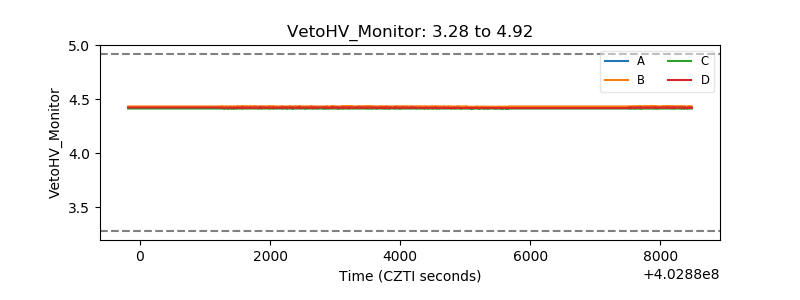 |
| Veto LLD | 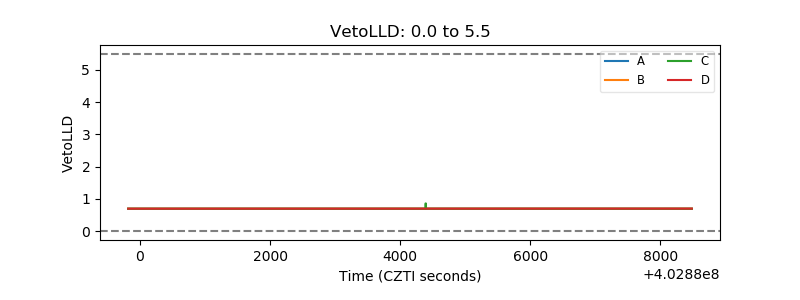 |
| Alpha Counter | 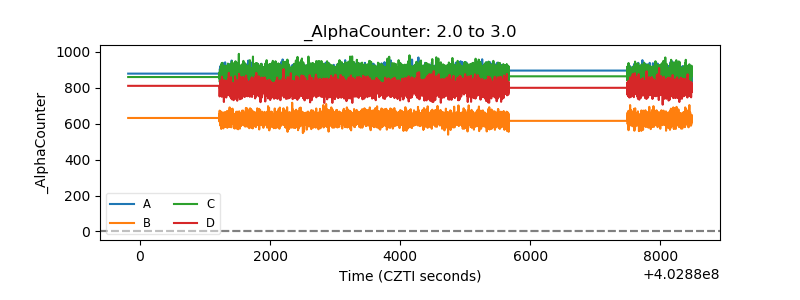 |
| _CPM_Rate | 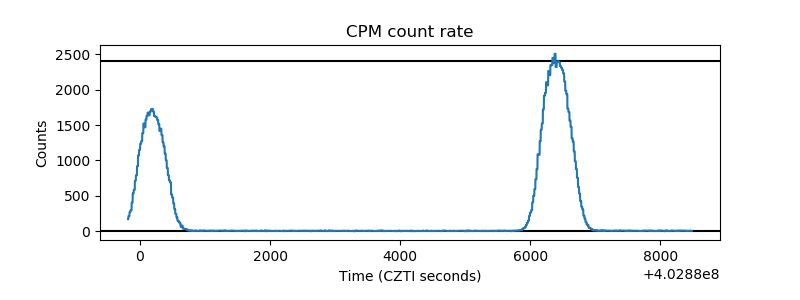 |
| CZT Counter | 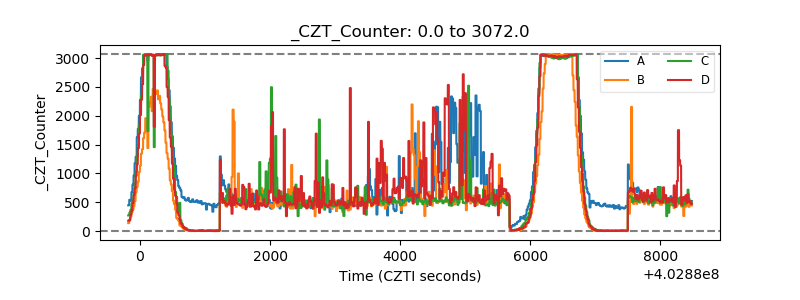 |
| +2.5 Volts monitor | 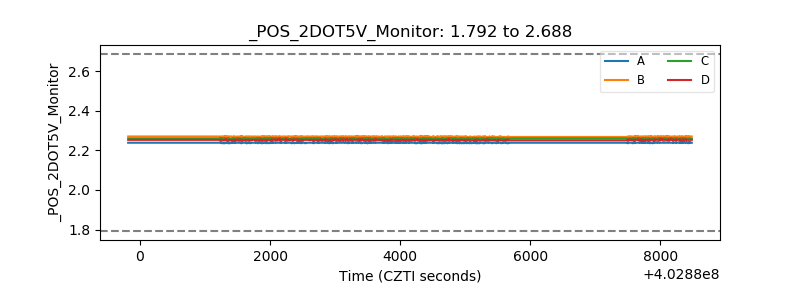 |
| +5 Volts monitor | 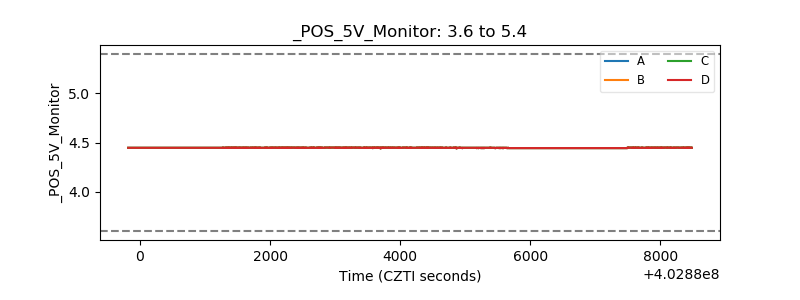 |
| _ROLL_ROT | 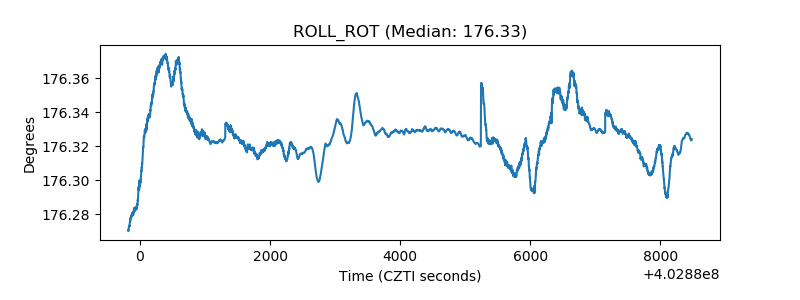 |
| _Roll_DEC | 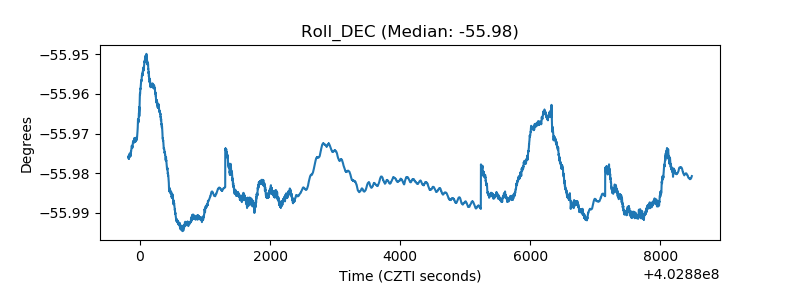 |
| _Roll_RA | 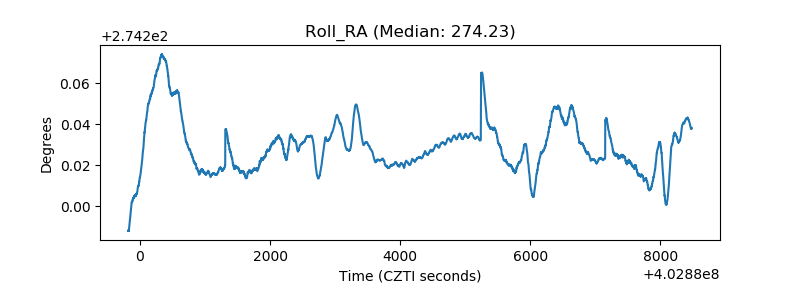 |
| Veto Counter | 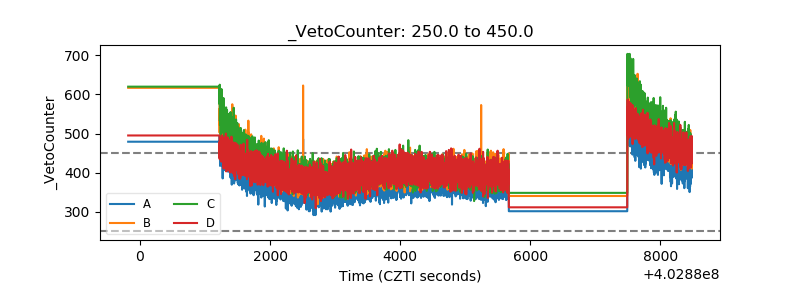 |