| Param | Original file | Final file |
|---|---|---|
| Filename | modeM0/AS1A11_082T01_9000005356_37997cztM0_level2.fits | modeM0/AS1A11_082T01_9000005356_37997cztM0_level2_quad_clean.evt |
| Size (bytes) | 347,244,480 | 51,770,880 |
| Size | 331.2 MB | 49.4 MB |
| Events in quadrant A | 2,807,224 | 312,835 |
| Events in quadrant B | 2,618,113 | 324,637 |
| Events in quadrant C | 2,948,721 | 306,114 |
| Events in quadrant D | 4,082,793 | 266,642 |
| Mode M0 | |||
|---|---|---|---|
| Quadrant | BADHDUFLAG | Total packets | Discarded packets |
| A | 0 | 11268 | 2 |
| B | 0 | 10816 | 1 |
| C | 0 | 11569 | 1 |
| D | 0 | 15527 | 1 |
| Mode SS | |||
|---|---|---|---|
| Quadrant | BADHDUFLAG | Total packets | Discarded packets |
| A | 0 | 104 | 0 |
| B | 0 | 104 | 0 |
| C | 0 | 104 | 0 |
| D | 0 | 104 | 0 |
| Mode M9 | |||
|---|---|---|---|
| Quadrant | BADHDUFLAG | Total packets | Discarded packets |
| A | 0 | 20 | 0 |
| B | 0 | 20 | 0 |
| C | 0 | 20 | 0 |
| D | 0 | 20 | 0 |
| Quadrant | Total seconds | Saturated seconds | Saturation percentage |
|---|---|---|---|
| A | 5099 | 10 | 0.196117% |
| B | 5099 | 20 | 0.392234% |
| C | 5099 | 118 | 2.314179% |
| D | 5099 | 329 | 6.452246% |
Noise dominated data is calculated using 1-second bins in cleaned event files. If a bin has >2000 counts, and if more than 50% of those come from <1% of pixels, then it is considered to be noise-dominated and hence unusable.
| Quadrant | # 1 sec bins | Bins with >0 counts | Bins with >2000 counts | High rate bins dominated by noise | Noise dominated (total time) | Noise dominated (detector-on time) | Marked lightcurve |
|---|---|---|---|---|---|---|---|
| A | 7071 | 5100 | 6 | 6 | 0.08% | 0.12% | 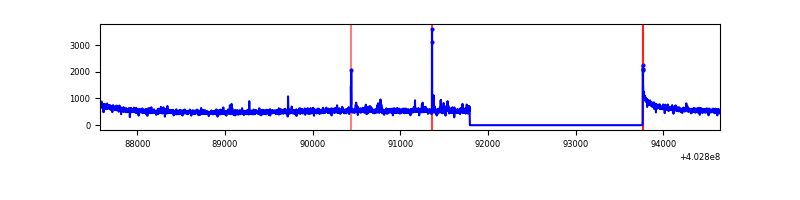 |
| B | 7071 | 5100 | 8 | 8 | 0.11% | 0.16% | 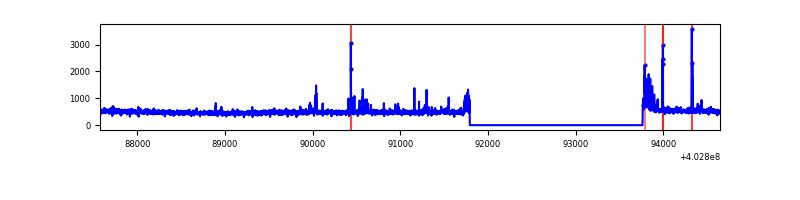 |
| C | 7071 | 5100 | 110 | 110 | 1.56% | 2.16% | 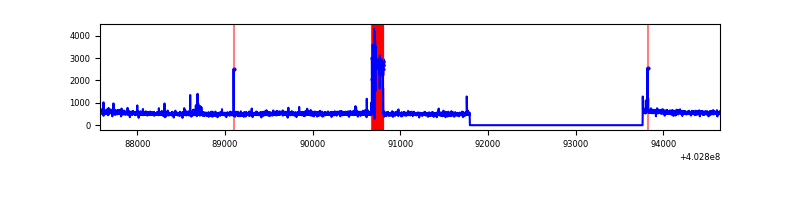 |
| D | 7071 | 5100 | 272 | 272 | 3.85% | 5.33% | 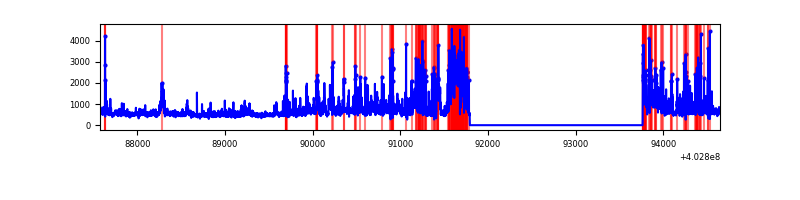 |
Top three noisy pixels from each quadrant. If the there are fewer than three noisy pixels in the level2.evt file, extra rows are filled as -1
| Pixel properties | Quadrant properties | ||||||
|---|---|---|---|---|---|---|---|
| Quadrant | DetID | PixID | Counts | Sigma | Mean | Median | Sigma |
| A | 10 | 83 | 319134 | 2551.27 | 624 | 612 | 124.8 |
| A | 12 | 16 | 35379 | 278.47 | 624 | 612 | 124.8 |
| A | 13 | 6 | 11452 | 86.83 | 624 | 612 | 124.8 |
| B | 5 | 255 | 71159 | 605.43 | 626 | 611 | 116.5 |
| B | 4 | 232 | 23279 | 194.53 | 626 | 611 | 116.5 |
| B | 5 | 184 | 21988 | 183.45 | 626 | 611 | 116.5 |
| C | 14 | 254 | 315986 | 2253.38 | 612 | 617 | 140.0 |
| C | 15 | 214 | 212879 | 1516.65 | 612 | 617 | 140.0 |
| C | 1 | 23 | 17088 | 117.69 | 612 | 617 | 140.0 |
| D | 1 | 52 | 797907 | 5476.36 | 601 | 585 | 145.6 |
| D | 1 | 47 | 533501 | 3660.3 | 601 | 585 | 145.6 |
| D | 7 | 223 | 241170 | 1652.44 | 601 | 585 | 145.6 |
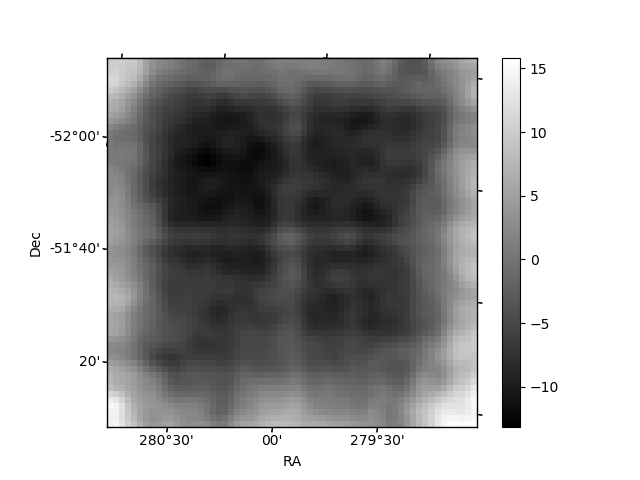
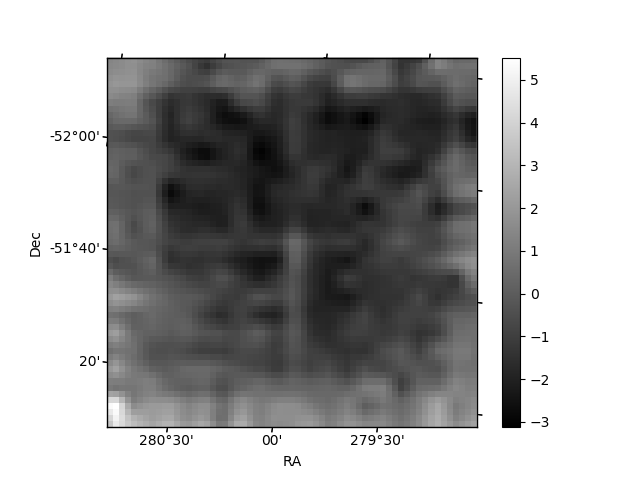
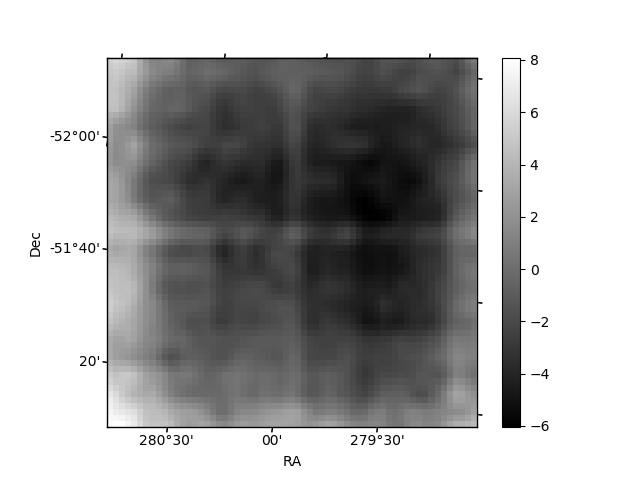
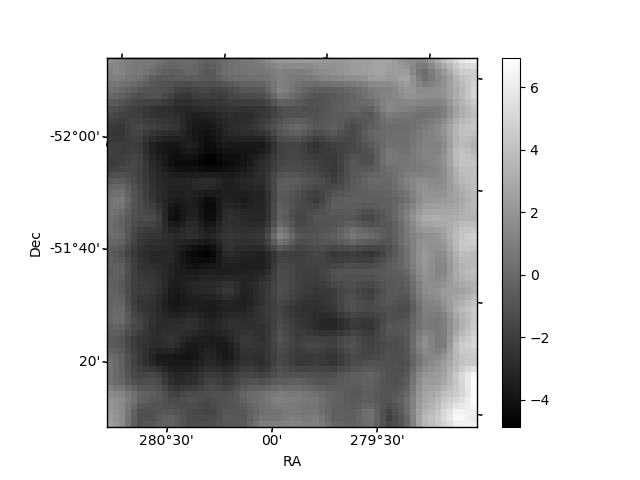
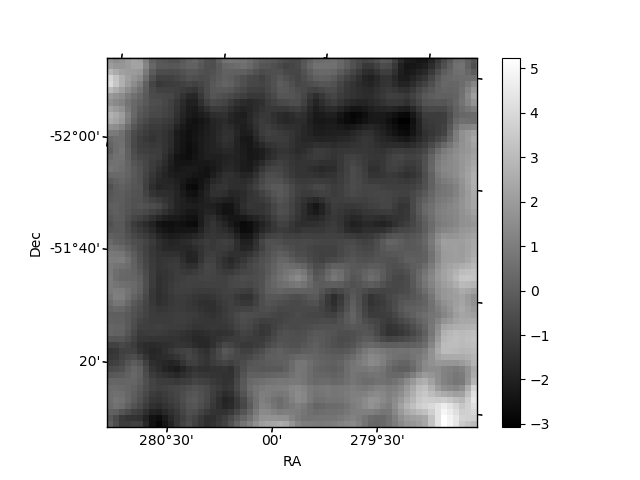
Histogram calculated using DETX and DETY for each event in the final _common_clean file
| Quadrant A | 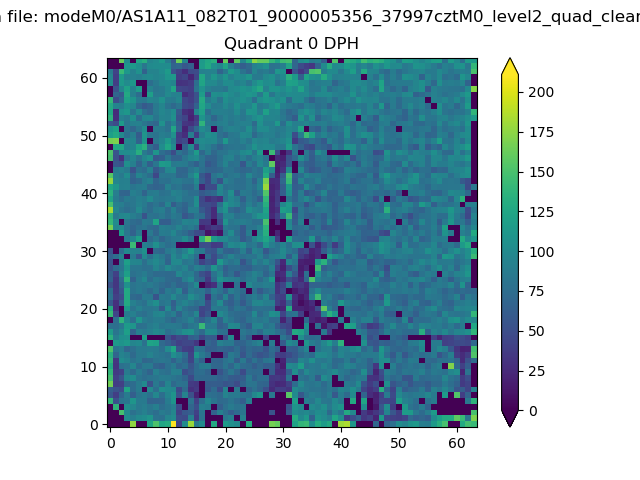 |
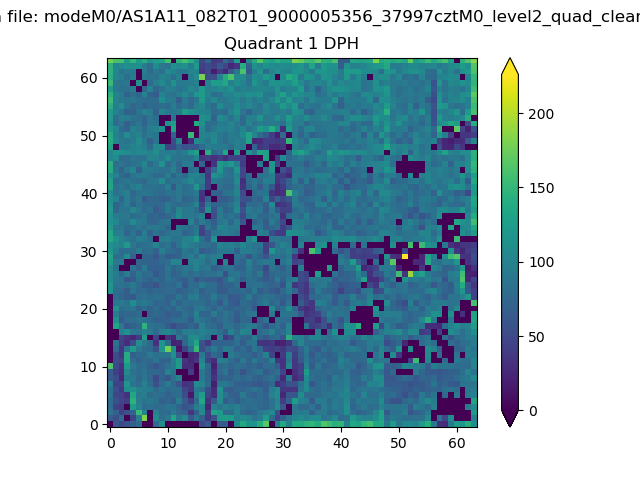 |
Quadrant B |
|---|---|---|---|
| Quadrant D | 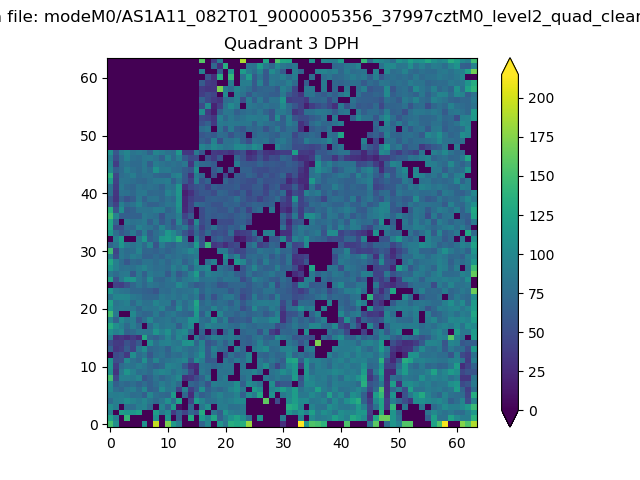 |
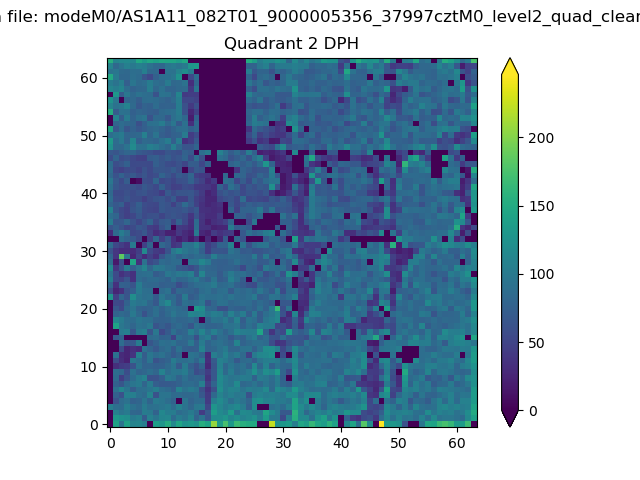 |
Quadrant C |
| Plot type | Count rate plots | Images |
|---|---|---|
| Comparison with Poisson distribution Blue bars denote a histogram of data divided into 1 sec bins. Red curve is a Poisson curve with rate = median count rate of data. |
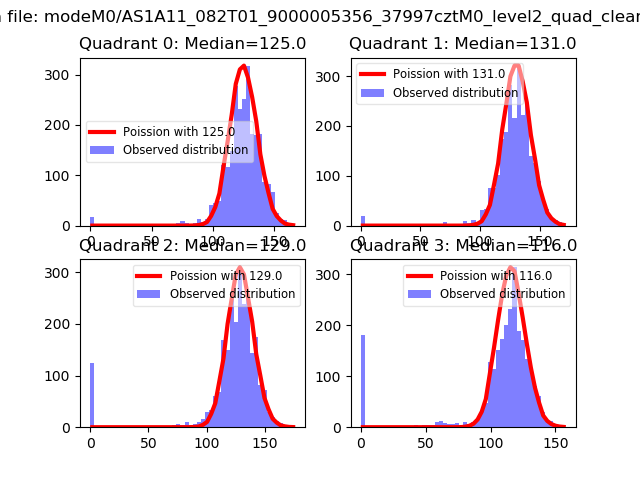 |
 |
| Quadrant-wise count rates Data is divided into 100 sec bins |
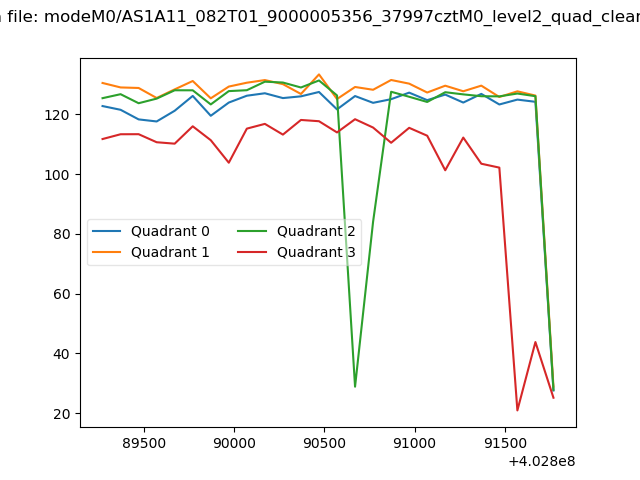 |
|
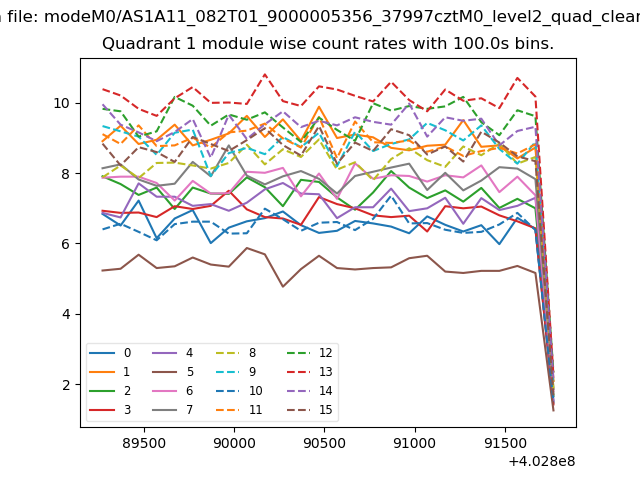
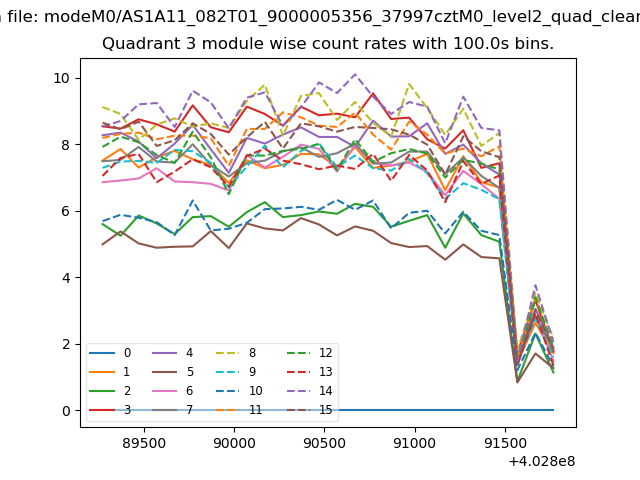
| Module-wise count rates for Quadrant A Data is divided into 100 sec bins |
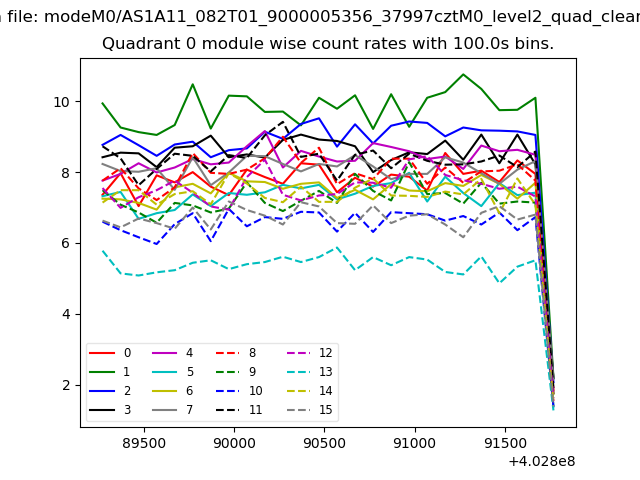 |
 |
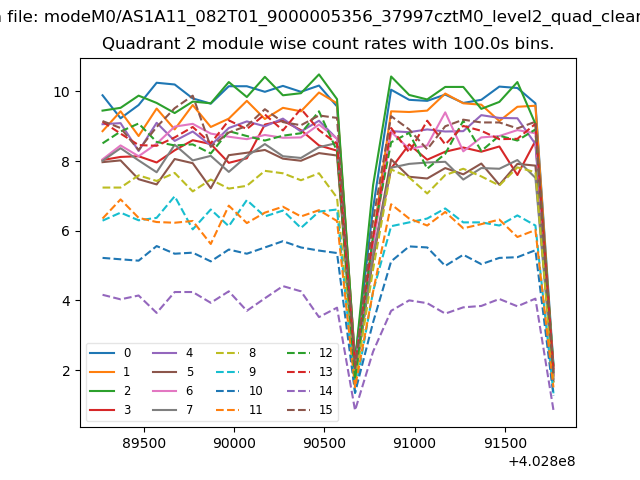
| Module-wise count rates for Quadrant B Data is divided into 100 sec bins |
 |
 |
| Module-wise count rates for Quadrant C Data is divided into 100 sec bins |
 |
 |
| Module-wise count rates for Quadrant D Data is divided into 100 sec bins |
 |
 |
| Parameter | Plot |
|---|---|
| CZT HV Monitor | 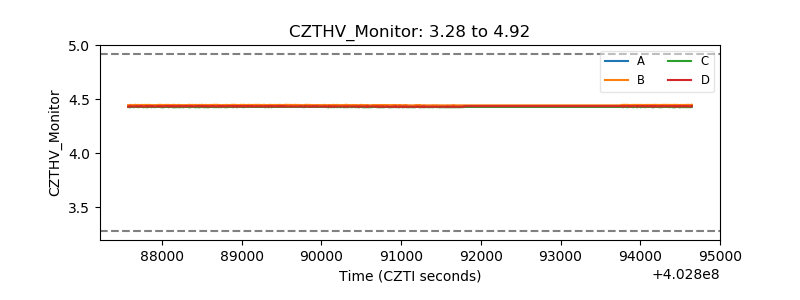 |
| D_VDD | 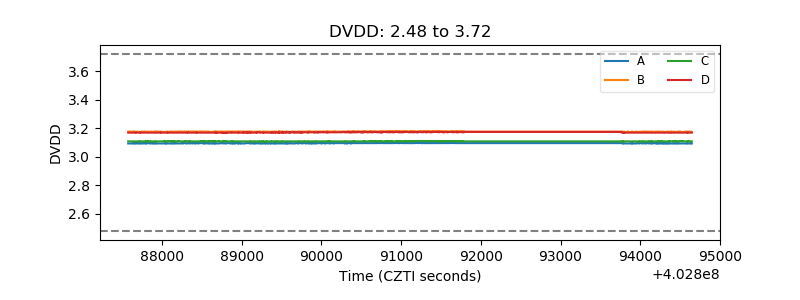 |
| Temperature 1 | 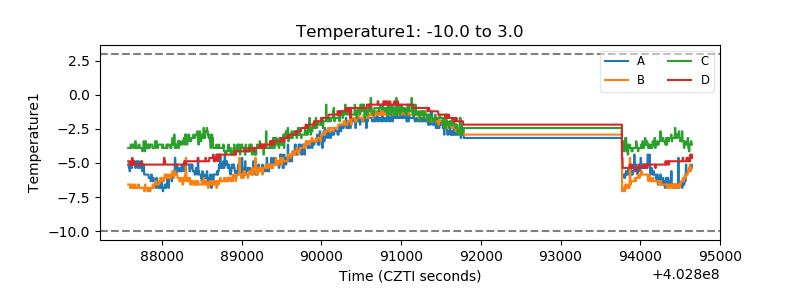 |
| Veto HV Monitor | 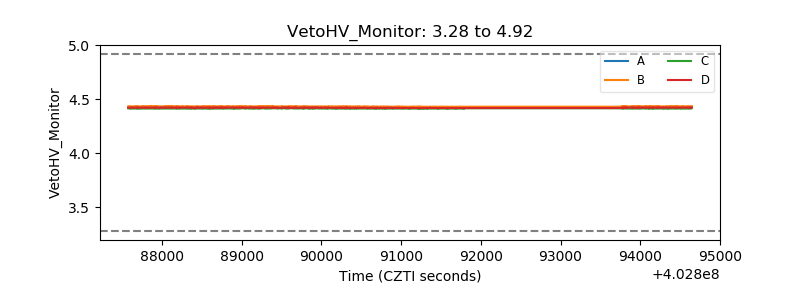 |
| Veto LLD | 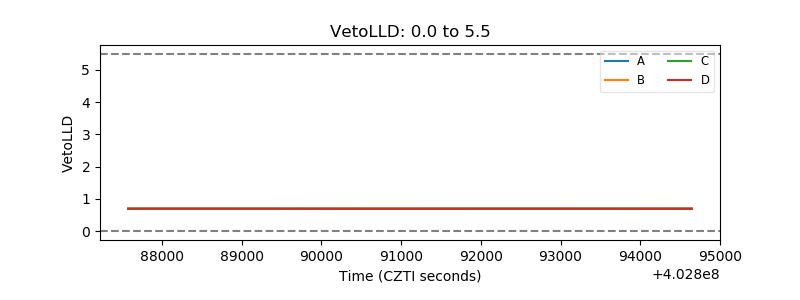 |
| Alpha Counter | 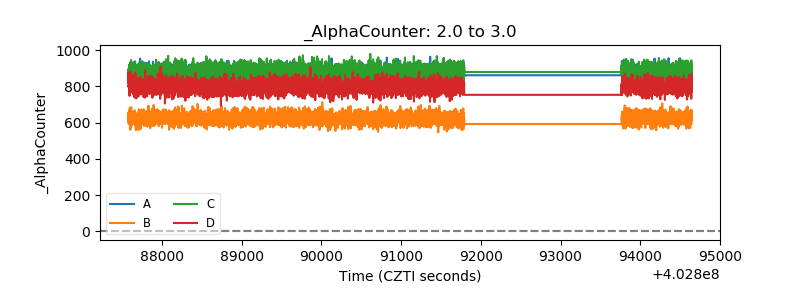 |
| _CPM_Rate | 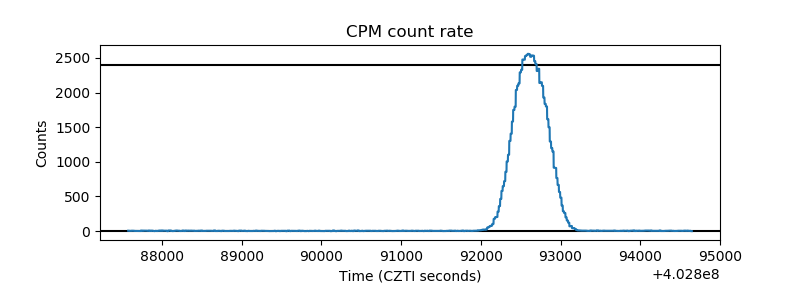 |
| CZT Counter | 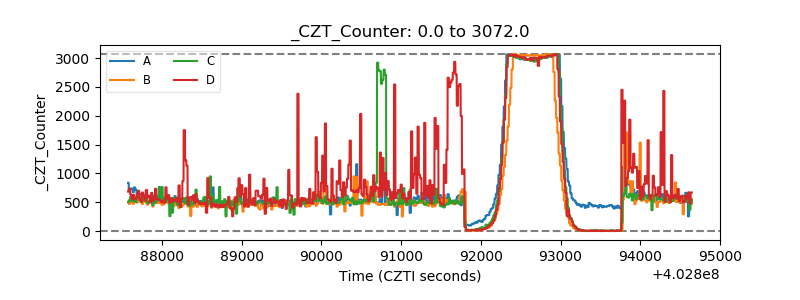 |
| +2.5 Volts monitor | 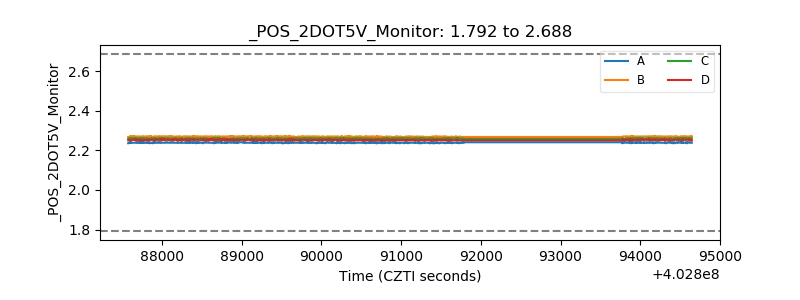 |
| +5 Volts monitor | 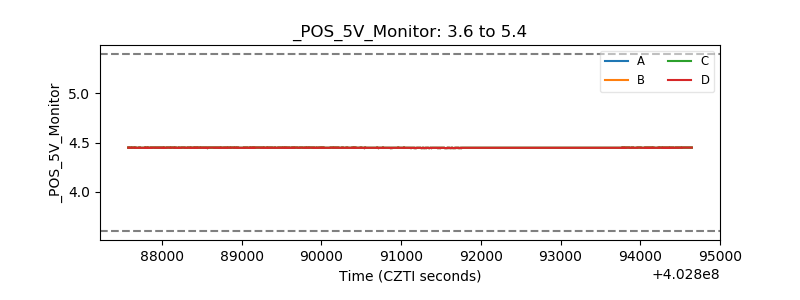 |
| _ROLL_ROT | 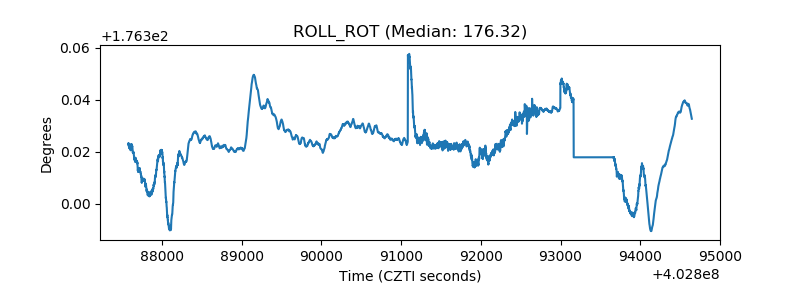 |
| _Roll_DEC | 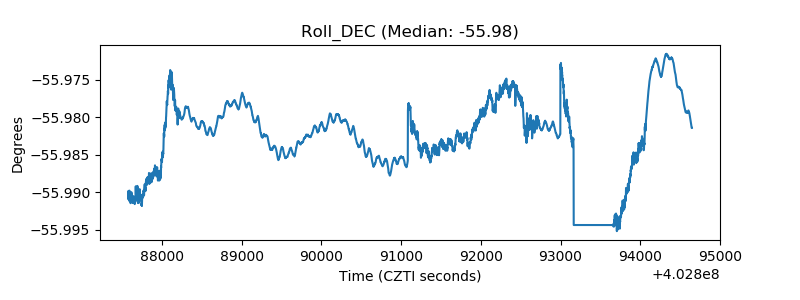 |
| _Roll_RA | 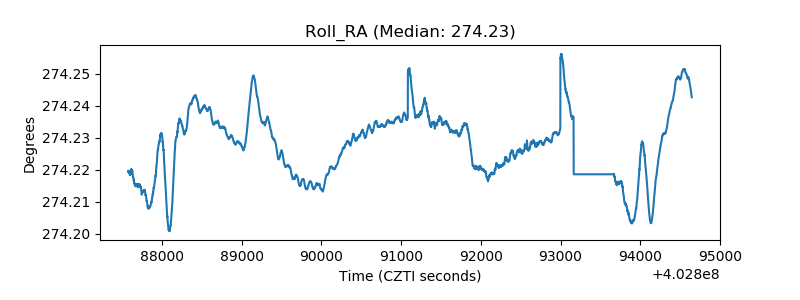 |
| Veto Counter | 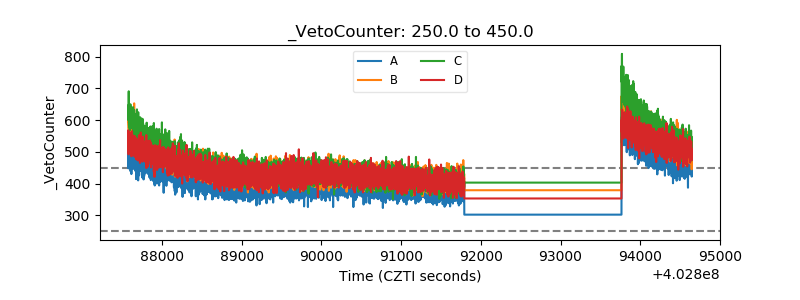 |