| Param | Original file | Final file |
|---|---|---|
| Filename | modeM0/AS1A11_082T01_9000005356_37999cztM0_level2.fits | modeM0/AS1A11_082T01_9000005356_37999cztM0_level2_quad_clean.evt |
| Size (bytes) | 338,728,320 | 52,128,000 |
| Size | 323.0 MB | 49.7 MB |
| Events in quadrant A | 2,881,548 | 310,212 |
| Events in quadrant B | 2,768,167 | 318,921 |
| Events in quadrant C | 2,659,818 | 317,200 |
| Events in quadrant D | 3,844,693 | 285,694 |
| Mode M0 | |||
|---|---|---|---|
| Quadrant | BADHDUFLAG | Total packets | Discarded packets |
| A | 0 | 11404 | 3 |
| B | 0 | 11098 | 2 |
| C | 0 | 10608 | 2 |
| D | 0 | 14522 | 2 |
| Mode SS | |||
|---|---|---|---|
| Quadrant | BADHDUFLAG | Total packets | Discarded packets |
| A | 0 | 100 | 0 |
| B | 0 | 100 | 0 |
| C | 0 | 100 | 0 |
| D | 0 | 100 | 0 |
| Mode M9 | |||
|---|---|---|---|
| Quadrant | BADHDUFLAG | Total packets | Discarded packets |
| A | 0 | 27 | 0 |
| B | 0 | 27 | 0 |
| C | 0 | 27 | 0 |
| D | 0 | 28 | 0 |
| Quadrant | Total seconds | Saturated seconds | Saturation percentage |
|---|---|---|---|
| A | 4938 | 16 | 0.324018% |
| B | 4938 | 19 | 0.384771% |
| C | 4938 | 8 | 0.162009% |
| D | 4938 | 287 | 5.812070% |
Noise dominated data is calculated using 1-second bins in cleaned event files. If a bin has >2000 counts, and if more than 50% of those come from <1% of pixels, then it is considered to be noise-dominated and hence unusable.
| Quadrant | # 1 sec bins | Bins with >0 counts | Bins with >2000 counts | High rate bins dominated by noise | Noise dominated (total time) | Noise dominated (detector-on time) | Marked lightcurve |
|---|---|---|---|---|---|---|---|
| A | 7060 | 4939 | 3 | 3 | 0.04% | 0.06% | 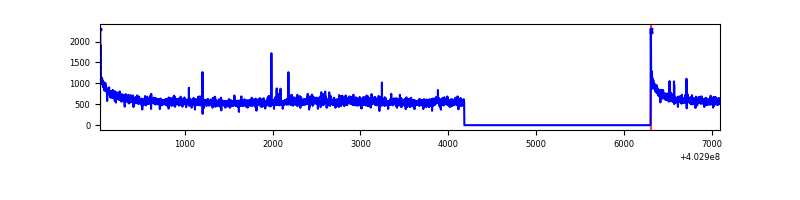 |
| B | 7060 | 4939 | 10 | 10 | 0.14% | 0.20% | 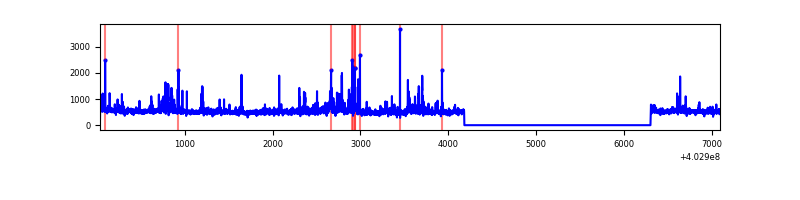 |
| C | 7060 | 4939 | 4 | 4 | 0.06% | 0.08% | 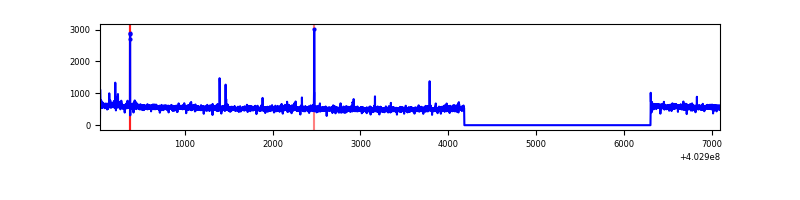 |
| D | 7060 | 4939 | 224 | 224 | 3.17% | 4.54% | 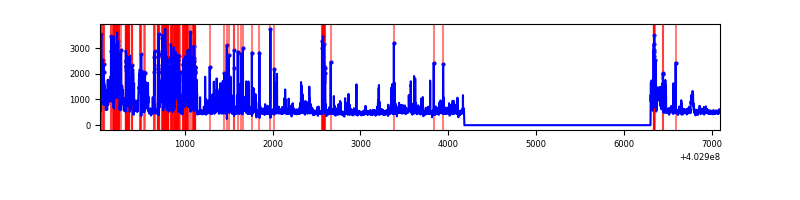 |
Top three noisy pixels from each quadrant. If the there are fewer than three noisy pixels in the level2.evt file, extra rows are filled as -1
| Pixel properties | Quadrant properties | ||||||
|---|---|---|---|---|---|---|---|
| Quadrant | DetID | PixID | Counts | Sigma | Mean | Median | Sigma |
| A | 10 | 83 | 363880 | 2925.74 | 622 | 611 | 124.2 |
| A | 15 | 222 | 79700 | 636.98 | 622 | 611 | 124.2 |
| A | 12 | 189 | 15046 | 116.26 | 622 | 611 | 124.2 |
| B | 4 | 171 | 96593 | 833.14 | 618 | 602 | 115.2 |
| B | 0 | 213 | 65860 | 566.4 | 618 | 602 | 115.2 |
| B | 0 | 186 | 60615 | 520.87 | 618 | 602 | 115.2 |
| C | 15 | 214 | 215367 | 1535.26 | 612 | 617 | 139.9 |
| C | 1 | 23 | 22575 | 156.98 | 612 | 617 | 139.9 |
| C | 14 | 254 | 16352 | 112.49 | 612 | 617 | 139.9 |
| D | 1 | 52 | 1191953 | 8204.7 | 600 | 585 | 145.2 |
| D | 13 | 249 | 137970 | 946.14 | 600 | 585 | 145.2 |
| D | 7 | 223 | 54323 | 370.08 | 600 | 585 | 145.2 |
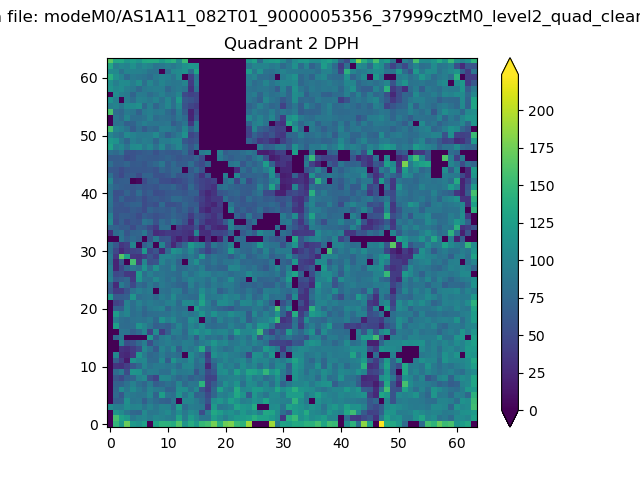
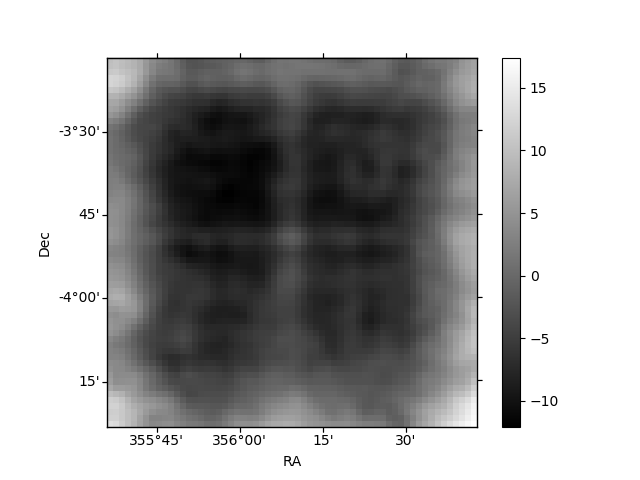
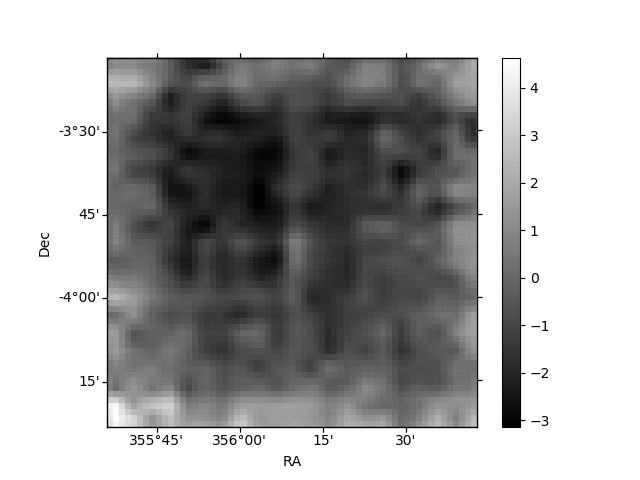
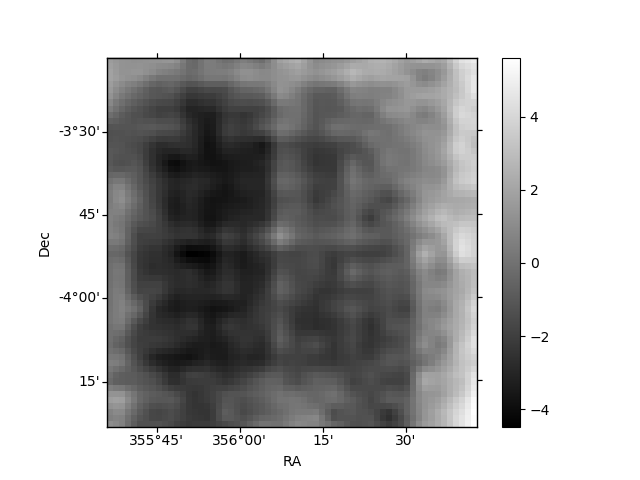
Histogram calculated using DETX and DETY for each event in the final _common_clean file
| Quadrant A | 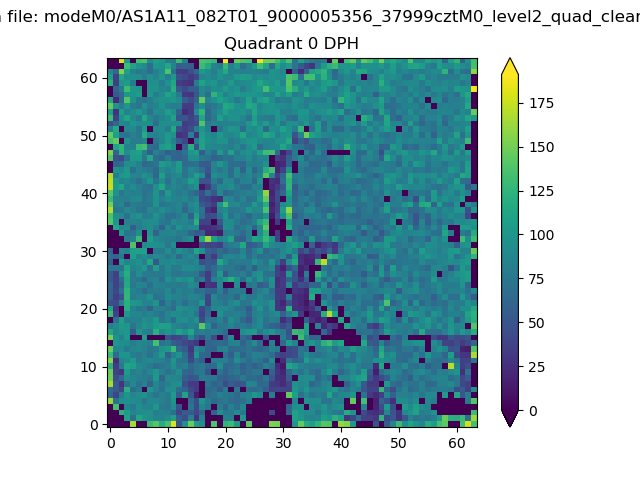 |
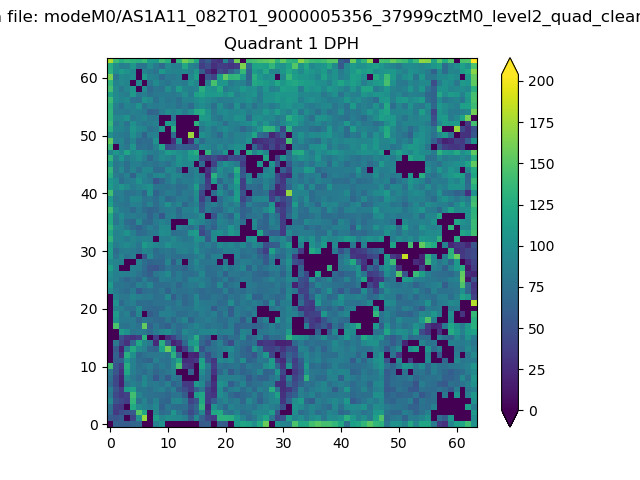 |
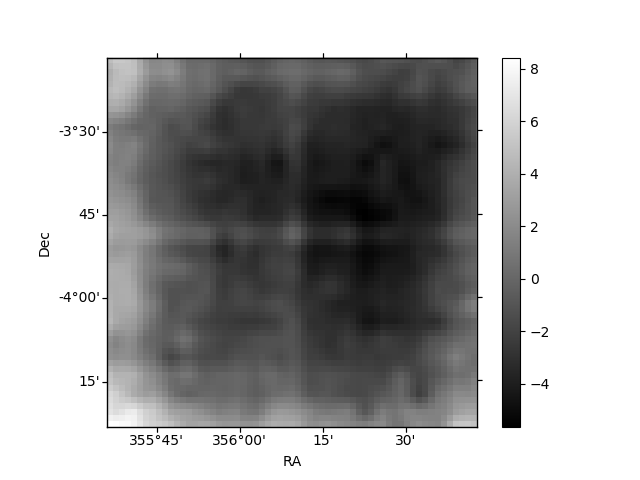
Quadrant B |
|---|---|---|---|
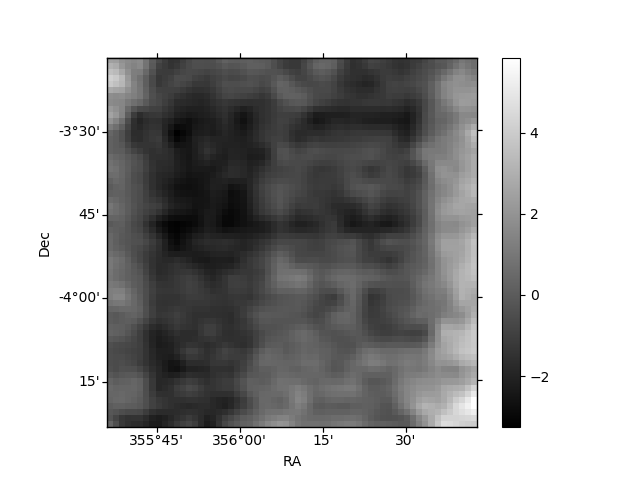
| Quadrant D | 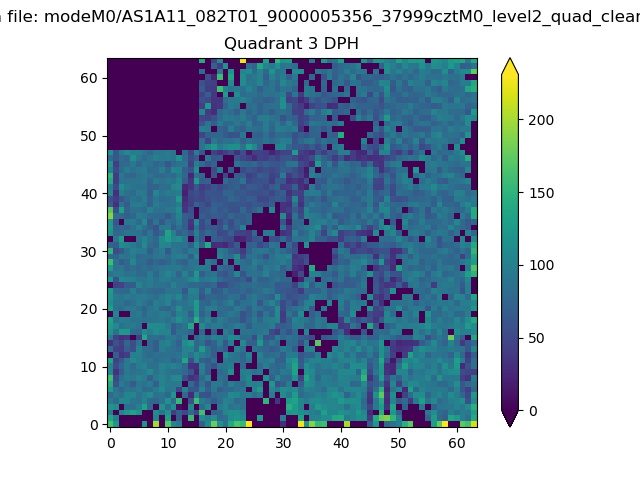 |
 |
Quadrant C |
| Plot type | Count rate plots | Images |
|---|---|---|
| Comparison with Poisson distribution Blue bars denote a histogram of data divided into 1 sec bins. Red curve is a Poisson curve with rate = median count rate of data. |
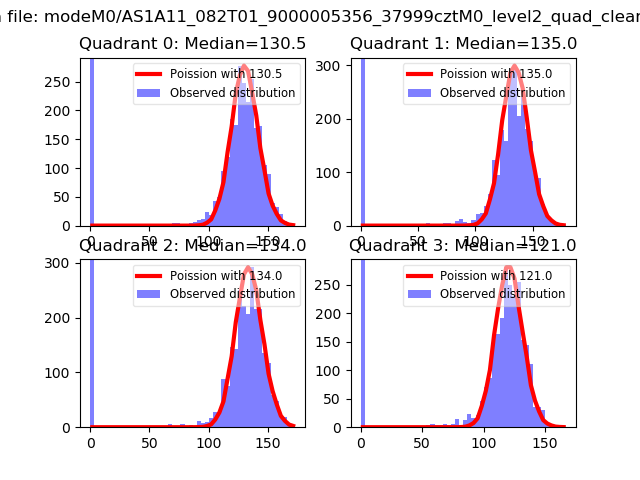 |
 |
| Quadrant-wise count rates Data is divided into 100 sec bins |
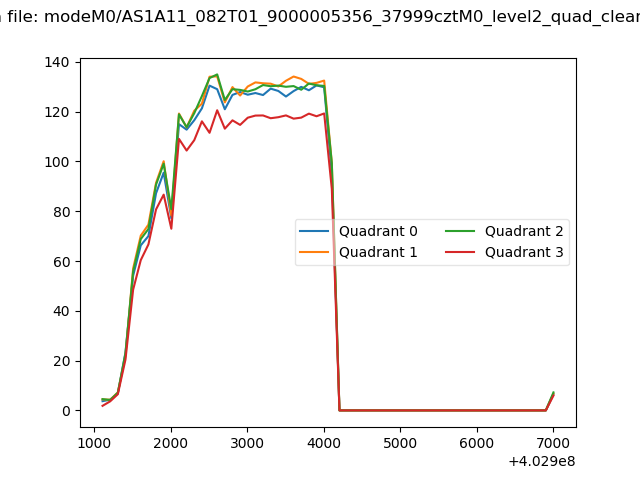 |
|
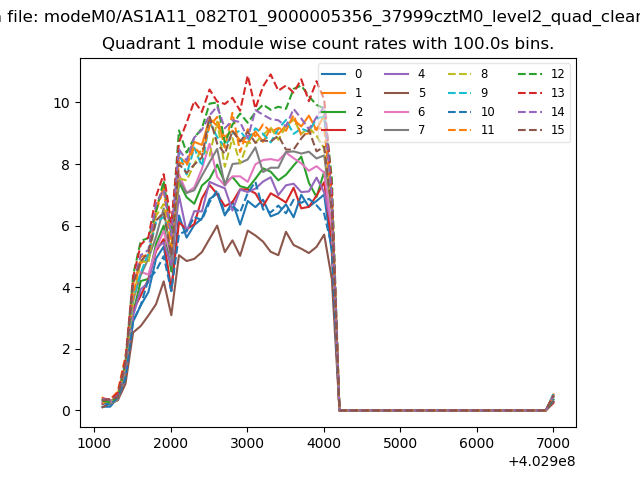
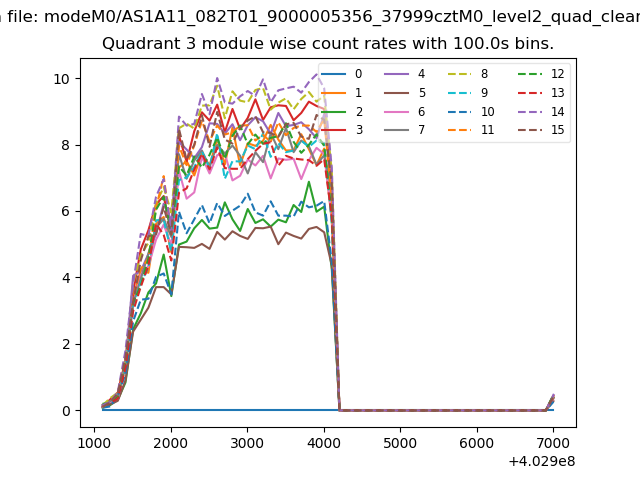
| Module-wise count rates for Quadrant A Data is divided into 100 sec bins |
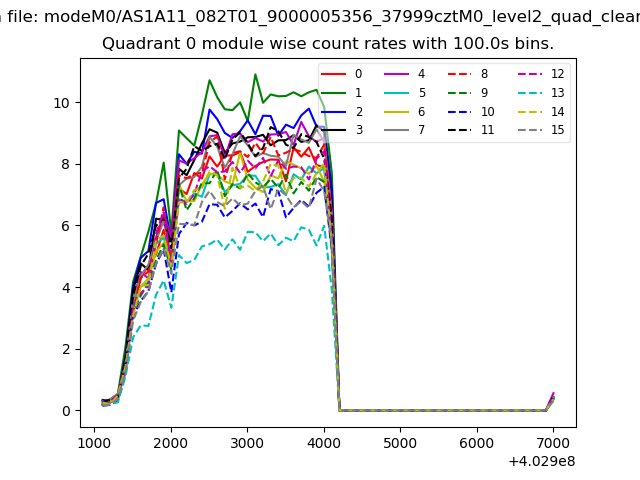 |
 |
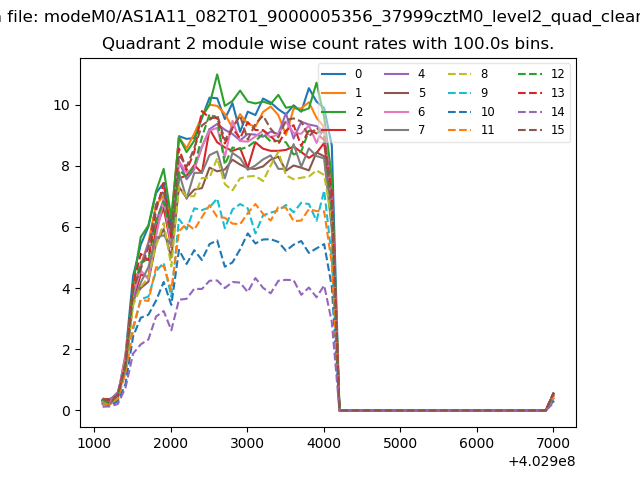
| Module-wise count rates for Quadrant B Data is divided into 100 sec bins |
 |
 |
| Module-wise count rates for Quadrant C Data is divided into 100 sec bins |
 |
 |
| Module-wise count rates for Quadrant D Data is divided into 100 sec bins |
 |
 |
| Parameter | Plot |
|---|---|
| CZT HV Monitor | 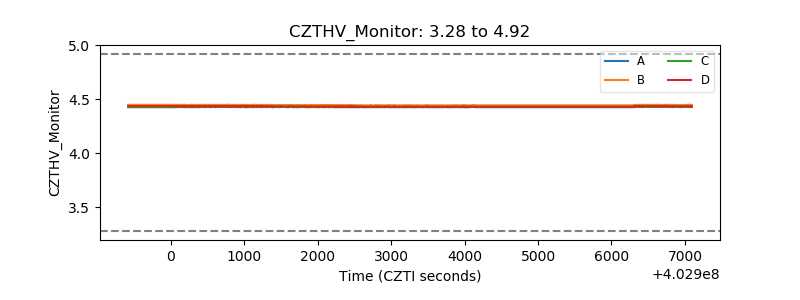 |
| D_VDD | 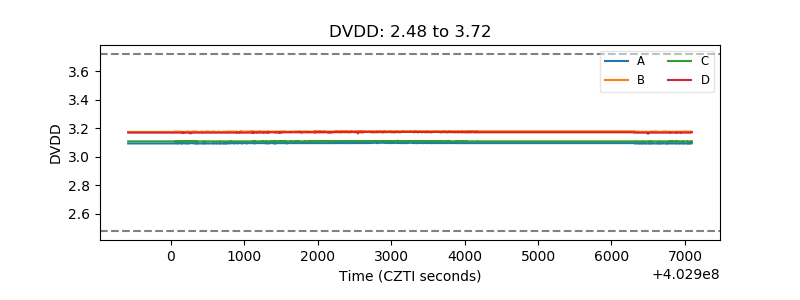 |
| Temperature 1 | 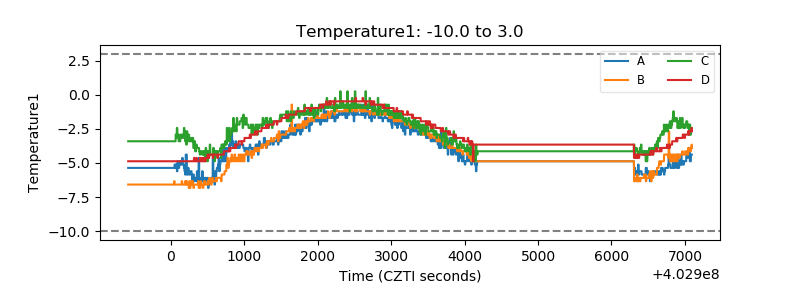 |
| Veto HV Monitor | 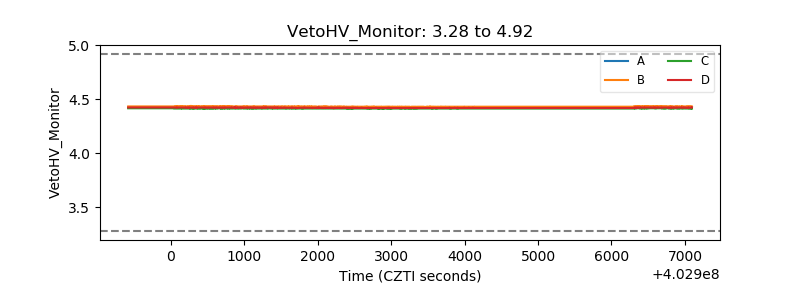 |
| Veto LLD | 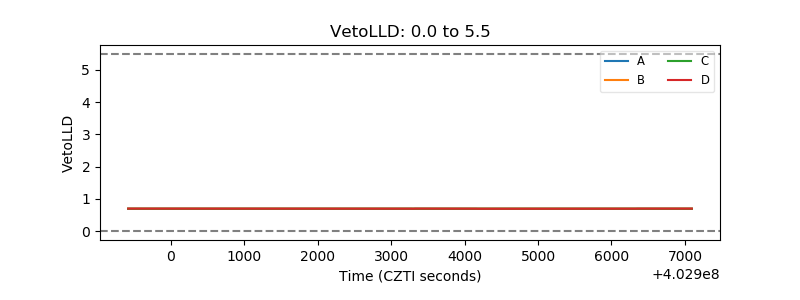 |
| Alpha Counter | 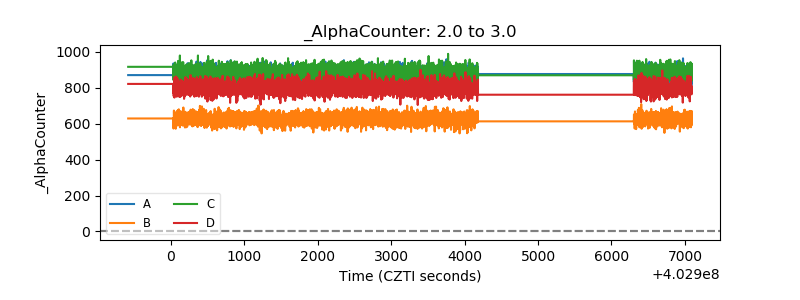 |
| _CPM_Rate |  |
| CZT Counter | 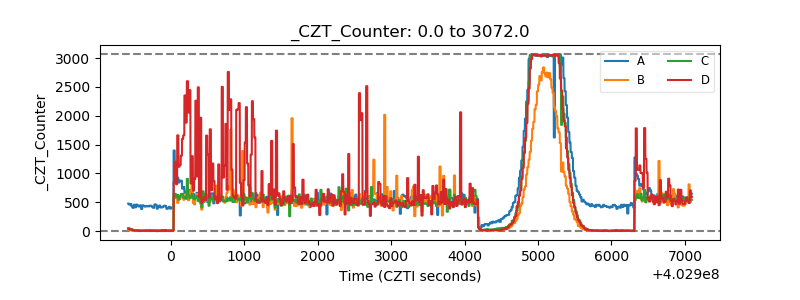 |
| +2.5 Volts monitor | 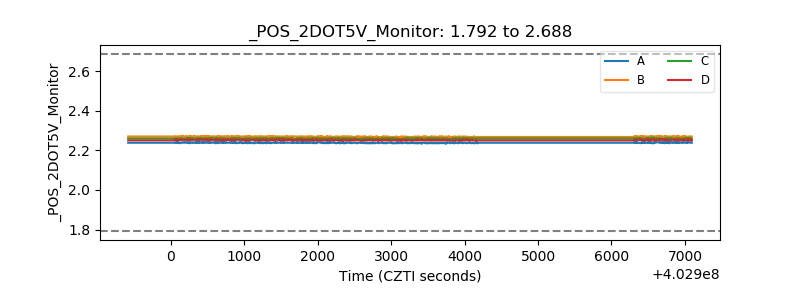 |
| +5 Volts monitor | 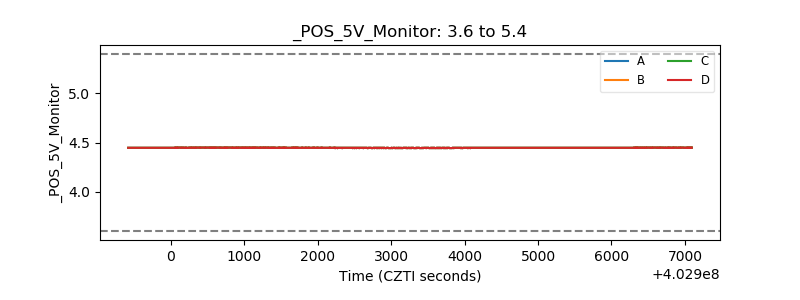 |
| _ROLL_ROT | 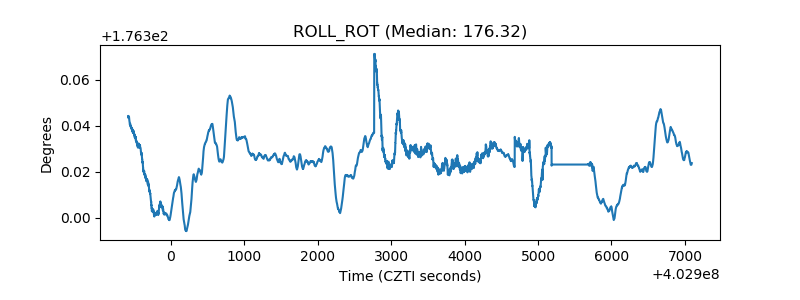 |
| _Roll_DEC | 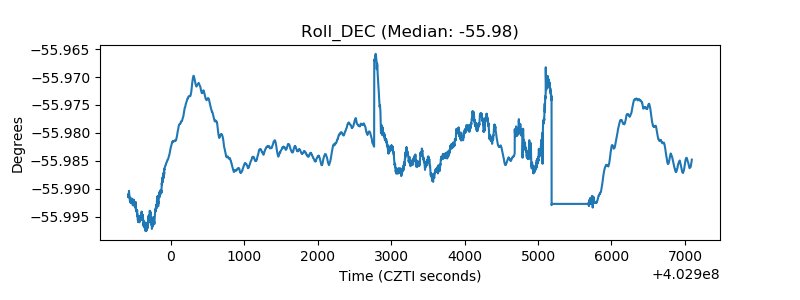 |
| _Roll_RA | 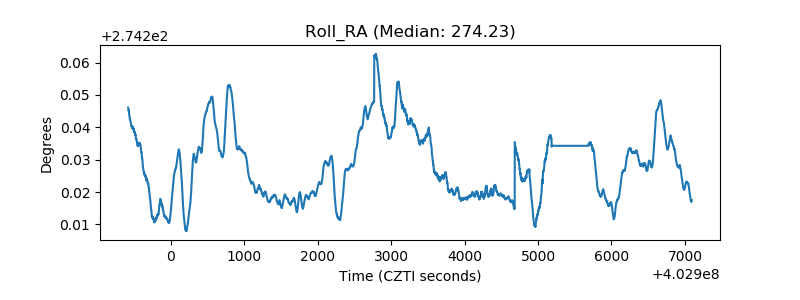 |
| Veto Counter | 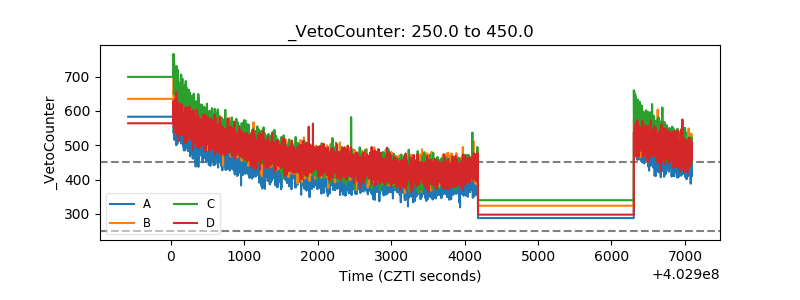 |