| Param | Original file | Final file |
|---|---|---|
| Filename | modeM0/AS1A11_082T01_9000005356_38000cztM0_level2.fits | modeM0/AS1A11_082T01_9000005356_38000cztM0_level2_quad_clean.evt |
| Size (bytes) | 330,206,400 | 92,635,200 |
| Size | 314.9 MB | 88.3 MB |
| Events in quadrant A | 2,997,653 | 624,690 |
| Events in quadrant B | 2,662,016 | 645,257 |
| Events in quadrant C | 2,576,957 | 634,116 |
| Events in quadrant D | 3,606,885 | 558,911 |
| Mode M0 | |||
|---|---|---|---|
| Quadrant | BADHDUFLAG | Total packets | Discarded packets |
| A | 0 | 11918 | 3 |
| B | 0 | 10806 | 2 |
| C | 0 | 10393 | 2 |
| D | 0 | 13811 | 2 |
| Mode SS | |||
|---|---|---|---|
| Quadrant | BADHDUFLAG | Total packets | Discarded packets |
| A | 0 | 100 | 0 |
| B | 0 | 100 | 0 |
| C | 0 | 100 | 0 |
| D | 0 | 100 | 0 |
| Mode M9 | |||
|---|---|---|---|
| Quadrant | BADHDUFLAG | Total packets | Discarded packets |
| A | 0 | 26 | 0 |
| B | 0 | 26 | 0 |
| C | 0 | 26 | 0 |
| D | 0 | 27 | 0 |
| Quadrant | Total seconds | Saturated seconds | Saturation percentage |
|---|---|---|---|
| A | 4878 | 29 | 0.594506% |
| B | 4878 | 44 | 0.902009% |
| C | 4878 | 12 | 0.246002% |
| D | 4878 | 201 | 4.120541% |
Noise dominated data is calculated using 1-second bins in cleaned event files. If a bin has >2000 counts, and if more than 50% of those come from <1% of pixels, then it is considered to be noise-dominated and hence unusable.
| Quadrant | # 1 sec bins | Bins with >0 counts | Bins with >2000 counts | High rate bins dominated by noise | Noise dominated (total time) | Noise dominated (detector-on time) | Marked lightcurve |
|---|---|---|---|---|---|---|---|
| A | 7002 | 4879 | 19 | 19 | 0.27% | 0.39% | 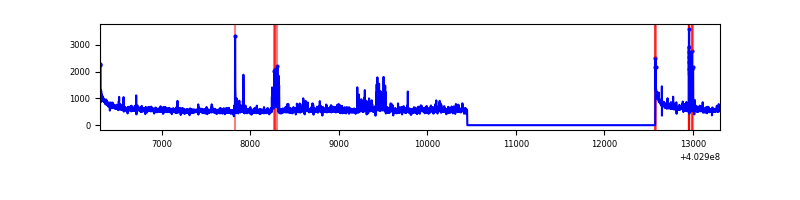 |
| B | 7002 | 4879 | 27 | 27 | 0.39% | 0.55% | 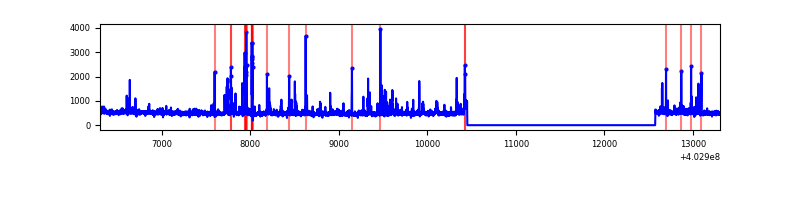 |
| C | 7002 | 4879 | 7 | 7 | 0.10% | 0.14% |  |
| D | 7002 | 4879 | 161 | 161 | 2.30% | 3.30% | 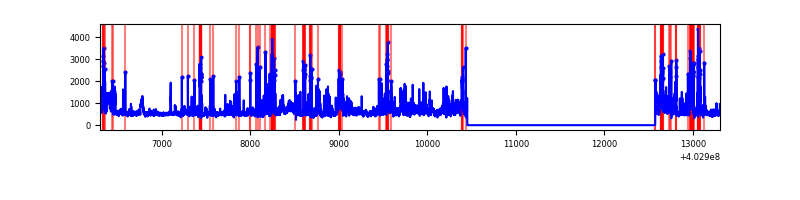 |
Top three noisy pixels from each quadrant. If the there are fewer than three noisy pixels in the level2.evt file, extra rows are filled as -1
| Pixel properties | Quadrant properties | ||||||
|---|---|---|---|---|---|---|---|
| Quadrant | DetID | PixID | Counts | Sigma | Mean | Median | Sigma |
| A | 10 | 83 | 359374 | 3019.3 | 591 | 580 | 118.8 |
| A | 12 | 16 | 151152 | 1267.08 | 591 | 580 | 118.8 |
| A | 15 | 222 | 102967 | 861.6 | 591 | 580 | 118.8 |
| B | 4 | 171 | 126334 | 1133.6 | 587 | 573 | 110.9 |
| B | 5 | 172 | 54834 | 489.1 | 587 | 573 | 110.9 |
| B | 5 | 255 | 48847 | 435.14 | 587 | 573 | 110.9 |
| C | 15 | 214 | 211766 | 1572.72 | 582 | 587 | 134.3 |
| C | 1 | 23 | 48600 | 357.57 | 582 | 587 | 134.3 |
| C | 14 | 254 | 28582 | 208.49 | 582 | 587 | 134.3 |
| D | 1 | 52 | 742412 | 5313.43 | 574 | 560 | 139.6 |
| D | 1 | 47 | 232273 | 1659.62 | 574 | 560 | 139.6 |
| D | 7 | 223 | 89080 | 634.01 | 574 | 560 | 139.6 |
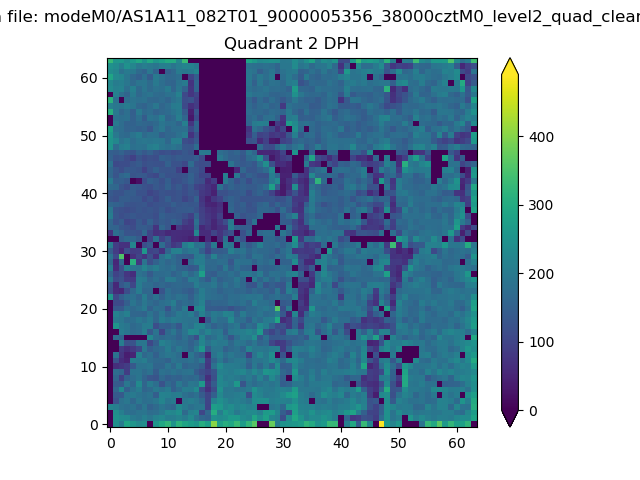
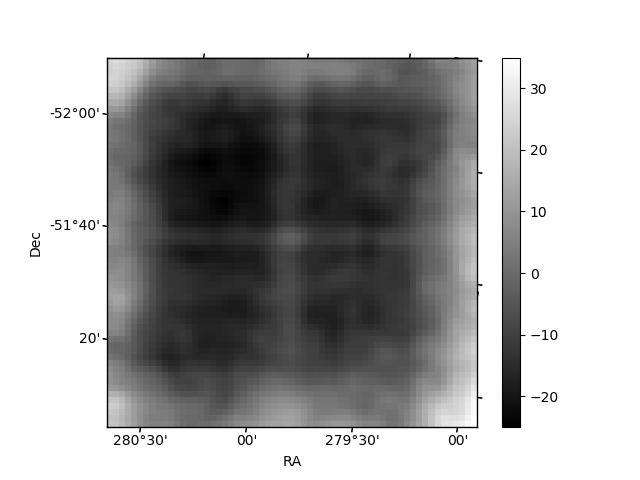
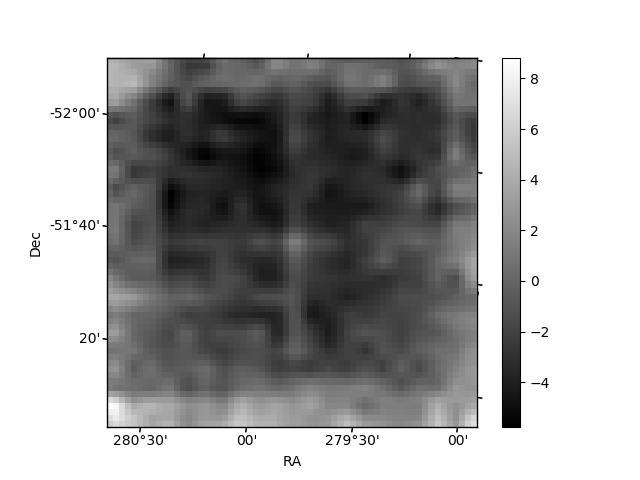
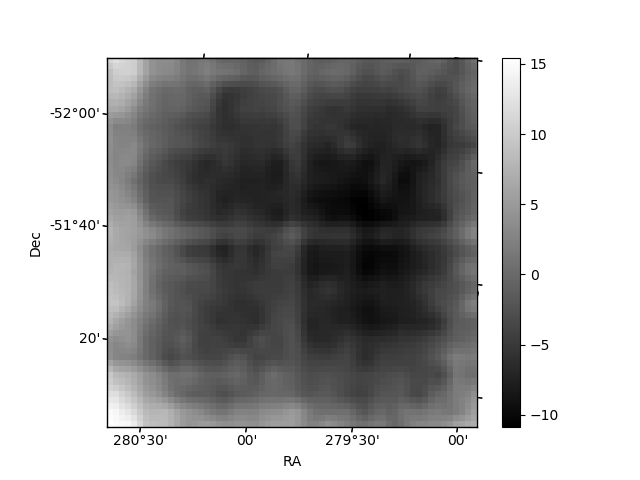
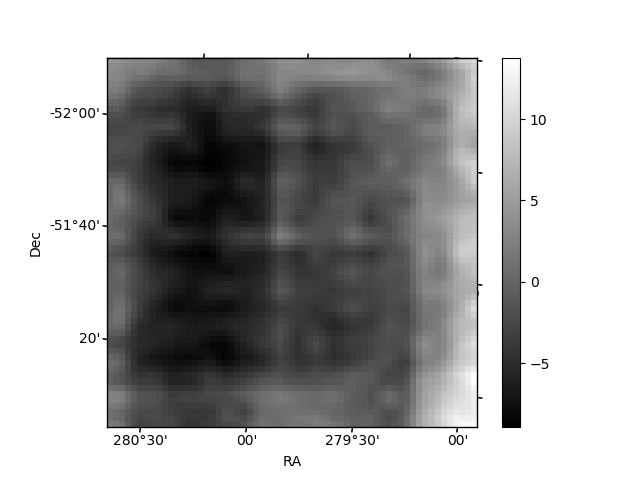
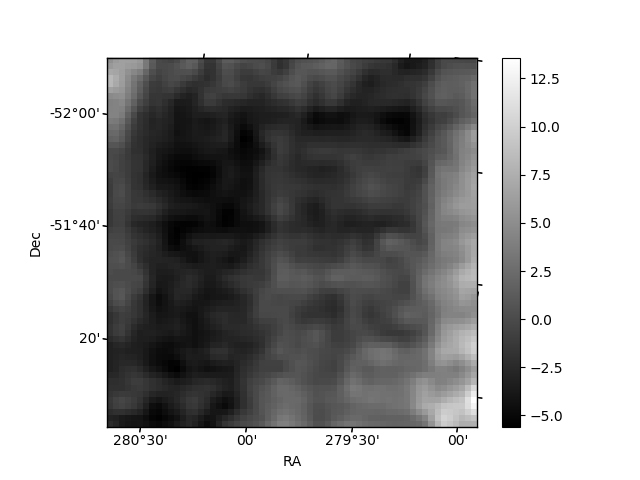
Histogram calculated using DETX and DETY for each event in the final _common_clean file
| Quadrant A | 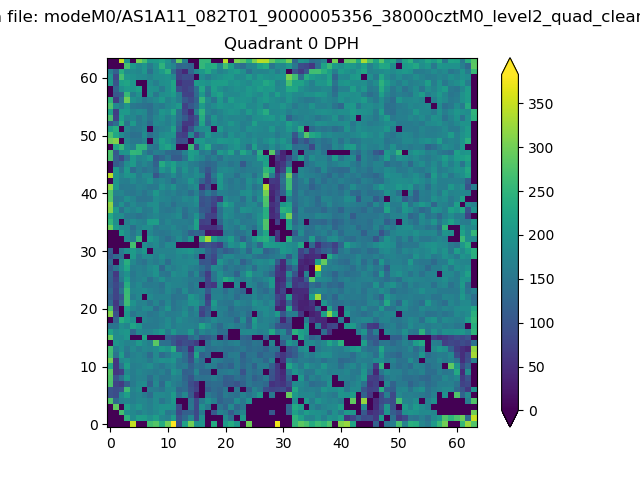 |
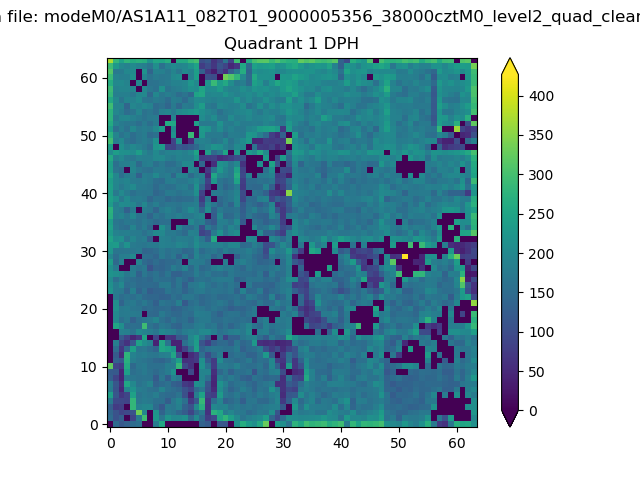 |
Quadrant B |
|---|---|---|---|
| Quadrant D | 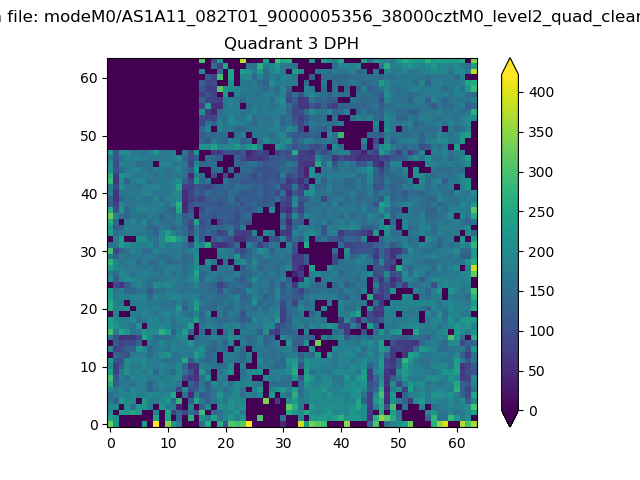 |
 |
Quadrant C |
| Plot type | Count rate plots | Images |
|---|---|---|
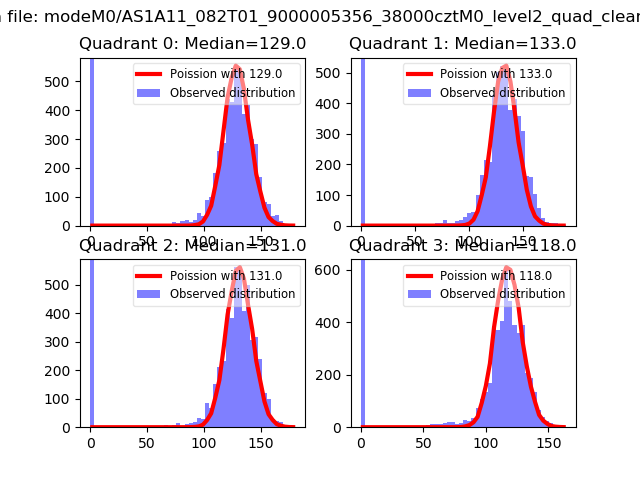
| Comparison with Poisson distribution Blue bars denote a histogram of data divided into 1 sec bins. Red curve is a Poisson curve with rate = median count rate of data. |
 |
 |
| Quadrant-wise count rates Data is divided into 100 sec bins |
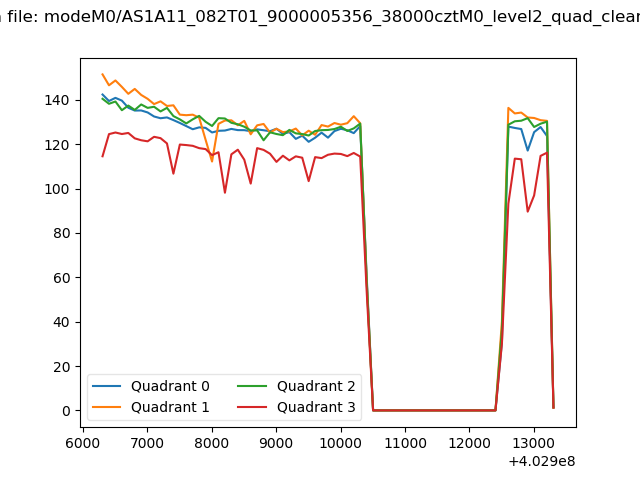 |
|
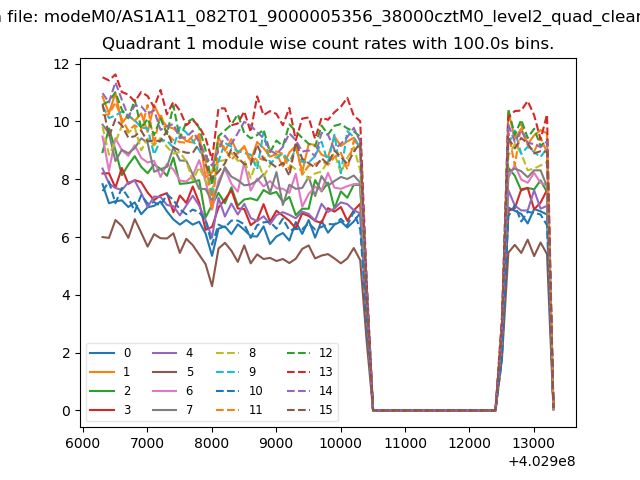
| Module-wise count rates for Quadrant A Data is divided into 100 sec bins |
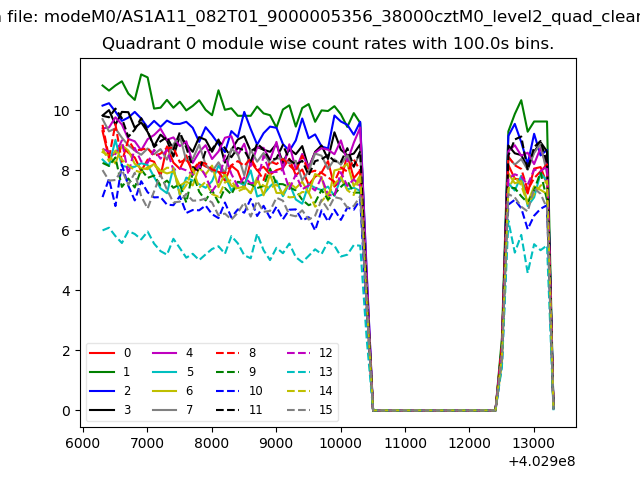 |
 |
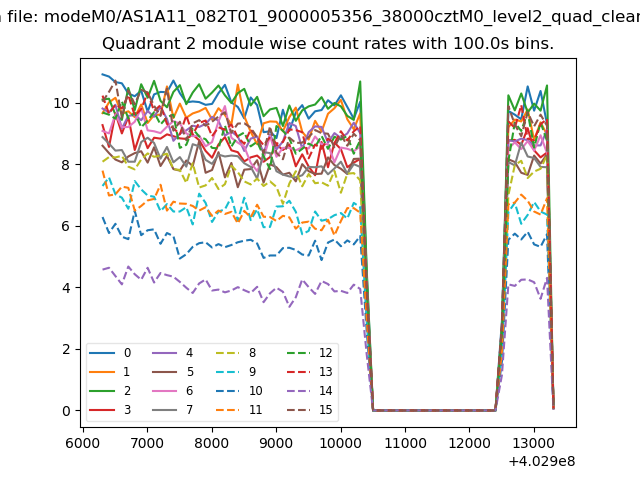
| Module-wise count rates for Quadrant B Data is divided into 100 sec bins |
 |
 |
| Module-wise count rates for Quadrant C Data is divided into 100 sec bins |
 |
 |
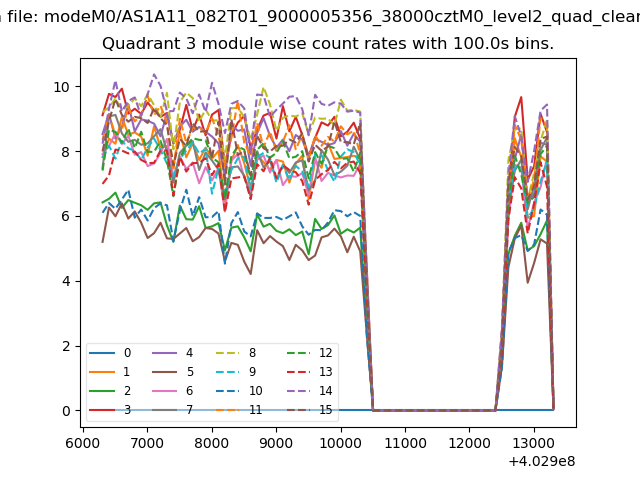
| Module-wise count rates for Quadrant D Data is divided into 100 sec bins |
 |
 |
| Parameter | Plot |
|---|---|
| CZT HV Monitor |  |
| D_VDD | 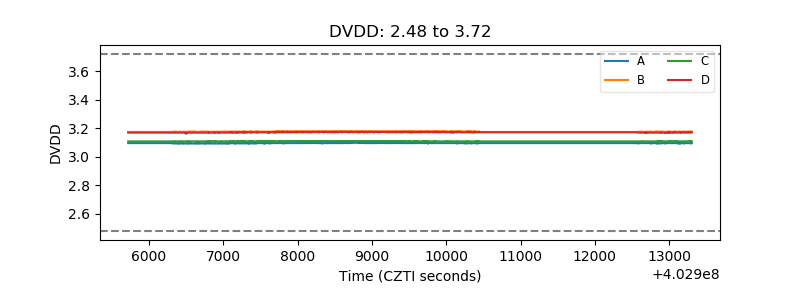 |
| Temperature 1 | 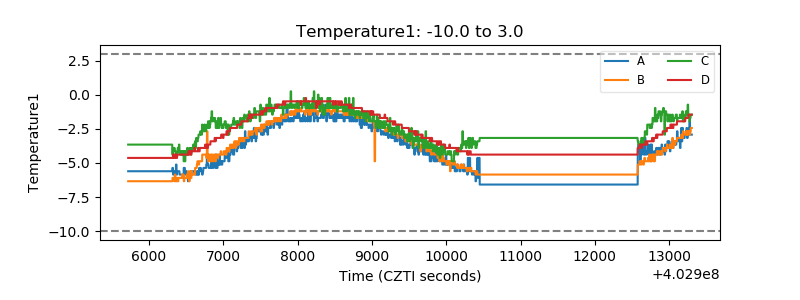 |
| Veto HV Monitor | 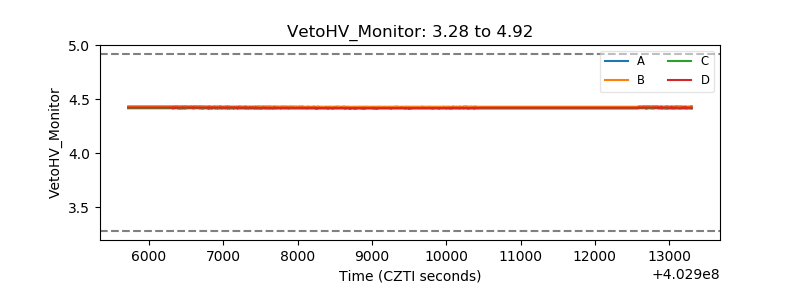 |
| Veto LLD | 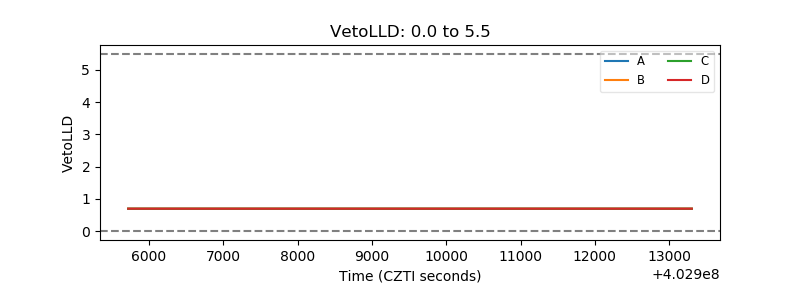 |
| Alpha Counter | 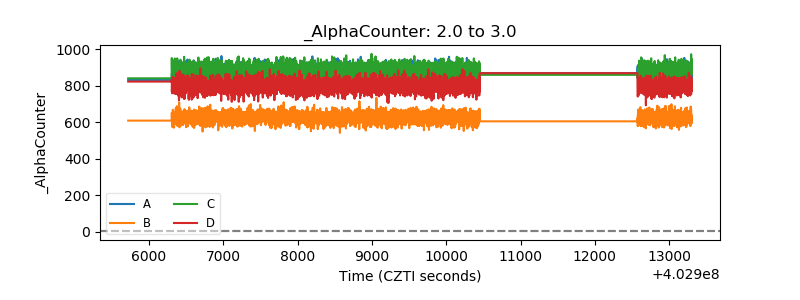 |
| _CPM_Rate | 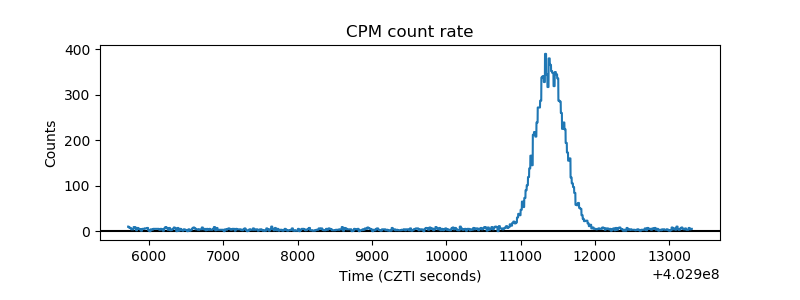 |
| CZT Counter | 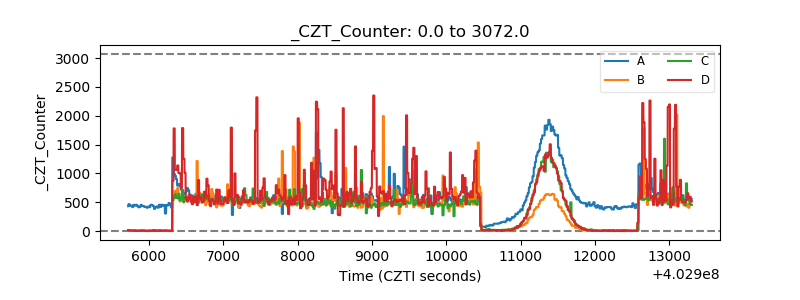 |
| +2.5 Volts monitor | 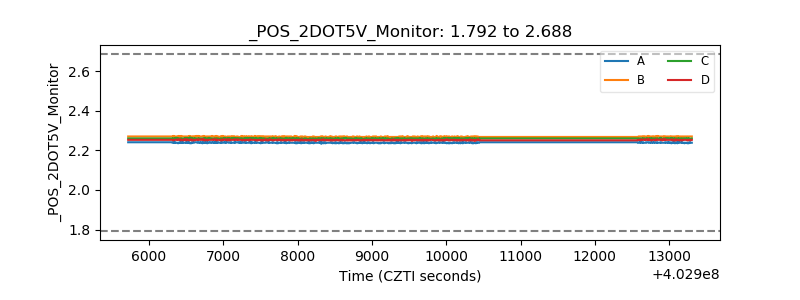 |
| +5 Volts monitor | 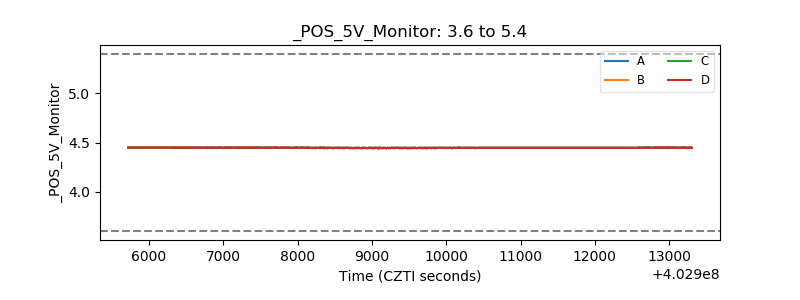 |
| _ROLL_ROT | 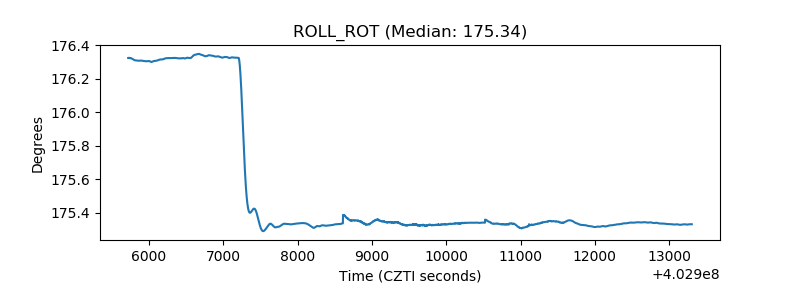 |
| _Roll_DEC | 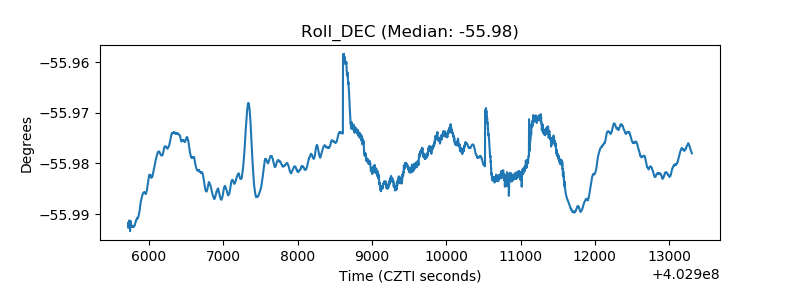 |
| _Roll_RA | 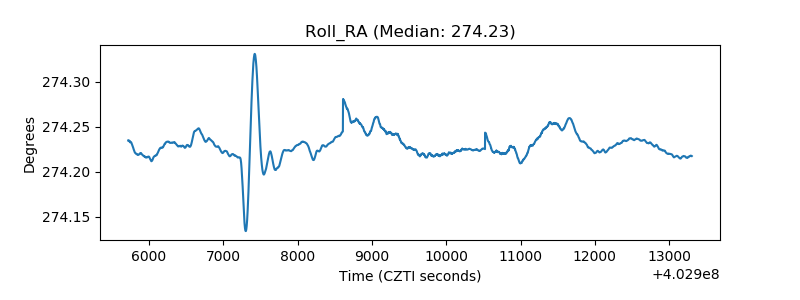 |
| Veto Counter | 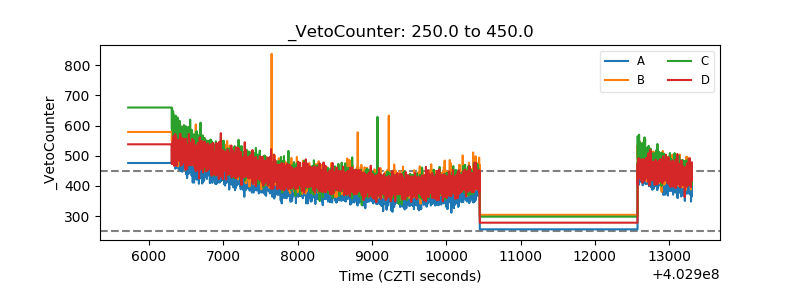 |